
SP500 Tests Resistance at $6,572.87 as Payrolls Data Looms
The S&P 500 is hovering near resistance at $6,572.87, with traders awaiting crucial US payrolls data for direction. Geopolitical tensions add another layer of uncertainty.
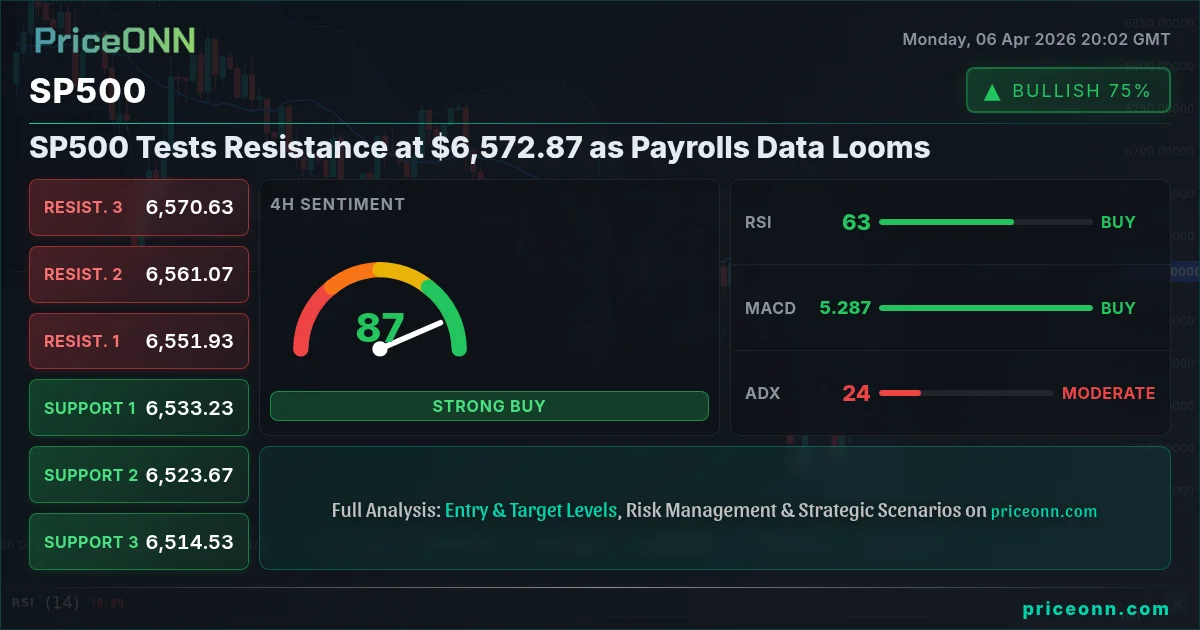
The S&P 500 is currently finding itself at a critical juncture, testing the resistance level around $6,572.87. This isn't just another day on the market; it's a pivotal moment where key economic data, particularly the upcoming US payrolls report, is poised to dictate the near-term trajectory. As traders and investors brace for this crucial data release, the broader market sentiment, influenced by geopolitical undercurrents and the dollar's strength, is creating a complex tapestry of signals. Understanding the interplay between these factors is paramount for navigating the choppy waters ahead.
- The S&P 500 is testing resistance at $6,572.87, with the 4-hour chart showing a strong uptrend but daily indicators suggesting caution.
- US payrolls data, due soon, is the key event risk, with previous non-farm payrolls at 63.
- Geopolitical tensions, particularly concerning the Strait of Hormuz, are creating underlying market caution despite recent equity gains.
- The DXY is trading near 99.77, influencing currency pairs and potentially impacting risk assets like the S&P 500.
The market's current position near resistance is a classic setup, where the bulls have pushed prices higher, but the sellers are waiting to defend key technical levels. For the S&P 500, that psychological and technical barrier lies at $6,572.87. The index has seen a notable rise, with the 1-hour chart showing a 100% uptrend, but the daily outlook presents a more nuanced picture. While the ADX at 47.51 on the daily chart indicates a strong downtrend, a conflicting signal emerges from the RSI at 45.35, suggesting it's in neutral territory with a downward lean. This divergence hints at underlying indecision, making the upcoming payrolls report even more critical. The market is essentially holding its breath, waiting for a catalyst to break this stalemate.
The broader economic backdrop continues to be a dominant theme. While recent news highlights a push to boost domestic copper production and debates about AI's impact on jobs, the immediate focus for equity markets remains on inflation, interest rates, and employment. The Eurozone's relative resilience to energy shocks, as reported, provides some global economic stability, but the US labor market is the primary driver for Fed policy expectations and, consequently, for US equities. Traders are scrutinizing every piece of data, looking for clues about the Federal Reserve's next move. Any deviation from the expected employment figures could significantly shift market sentiment and trigger a decisive move in the S&P 500.
Navigating the Technical Landscape: A Tale of Divergence
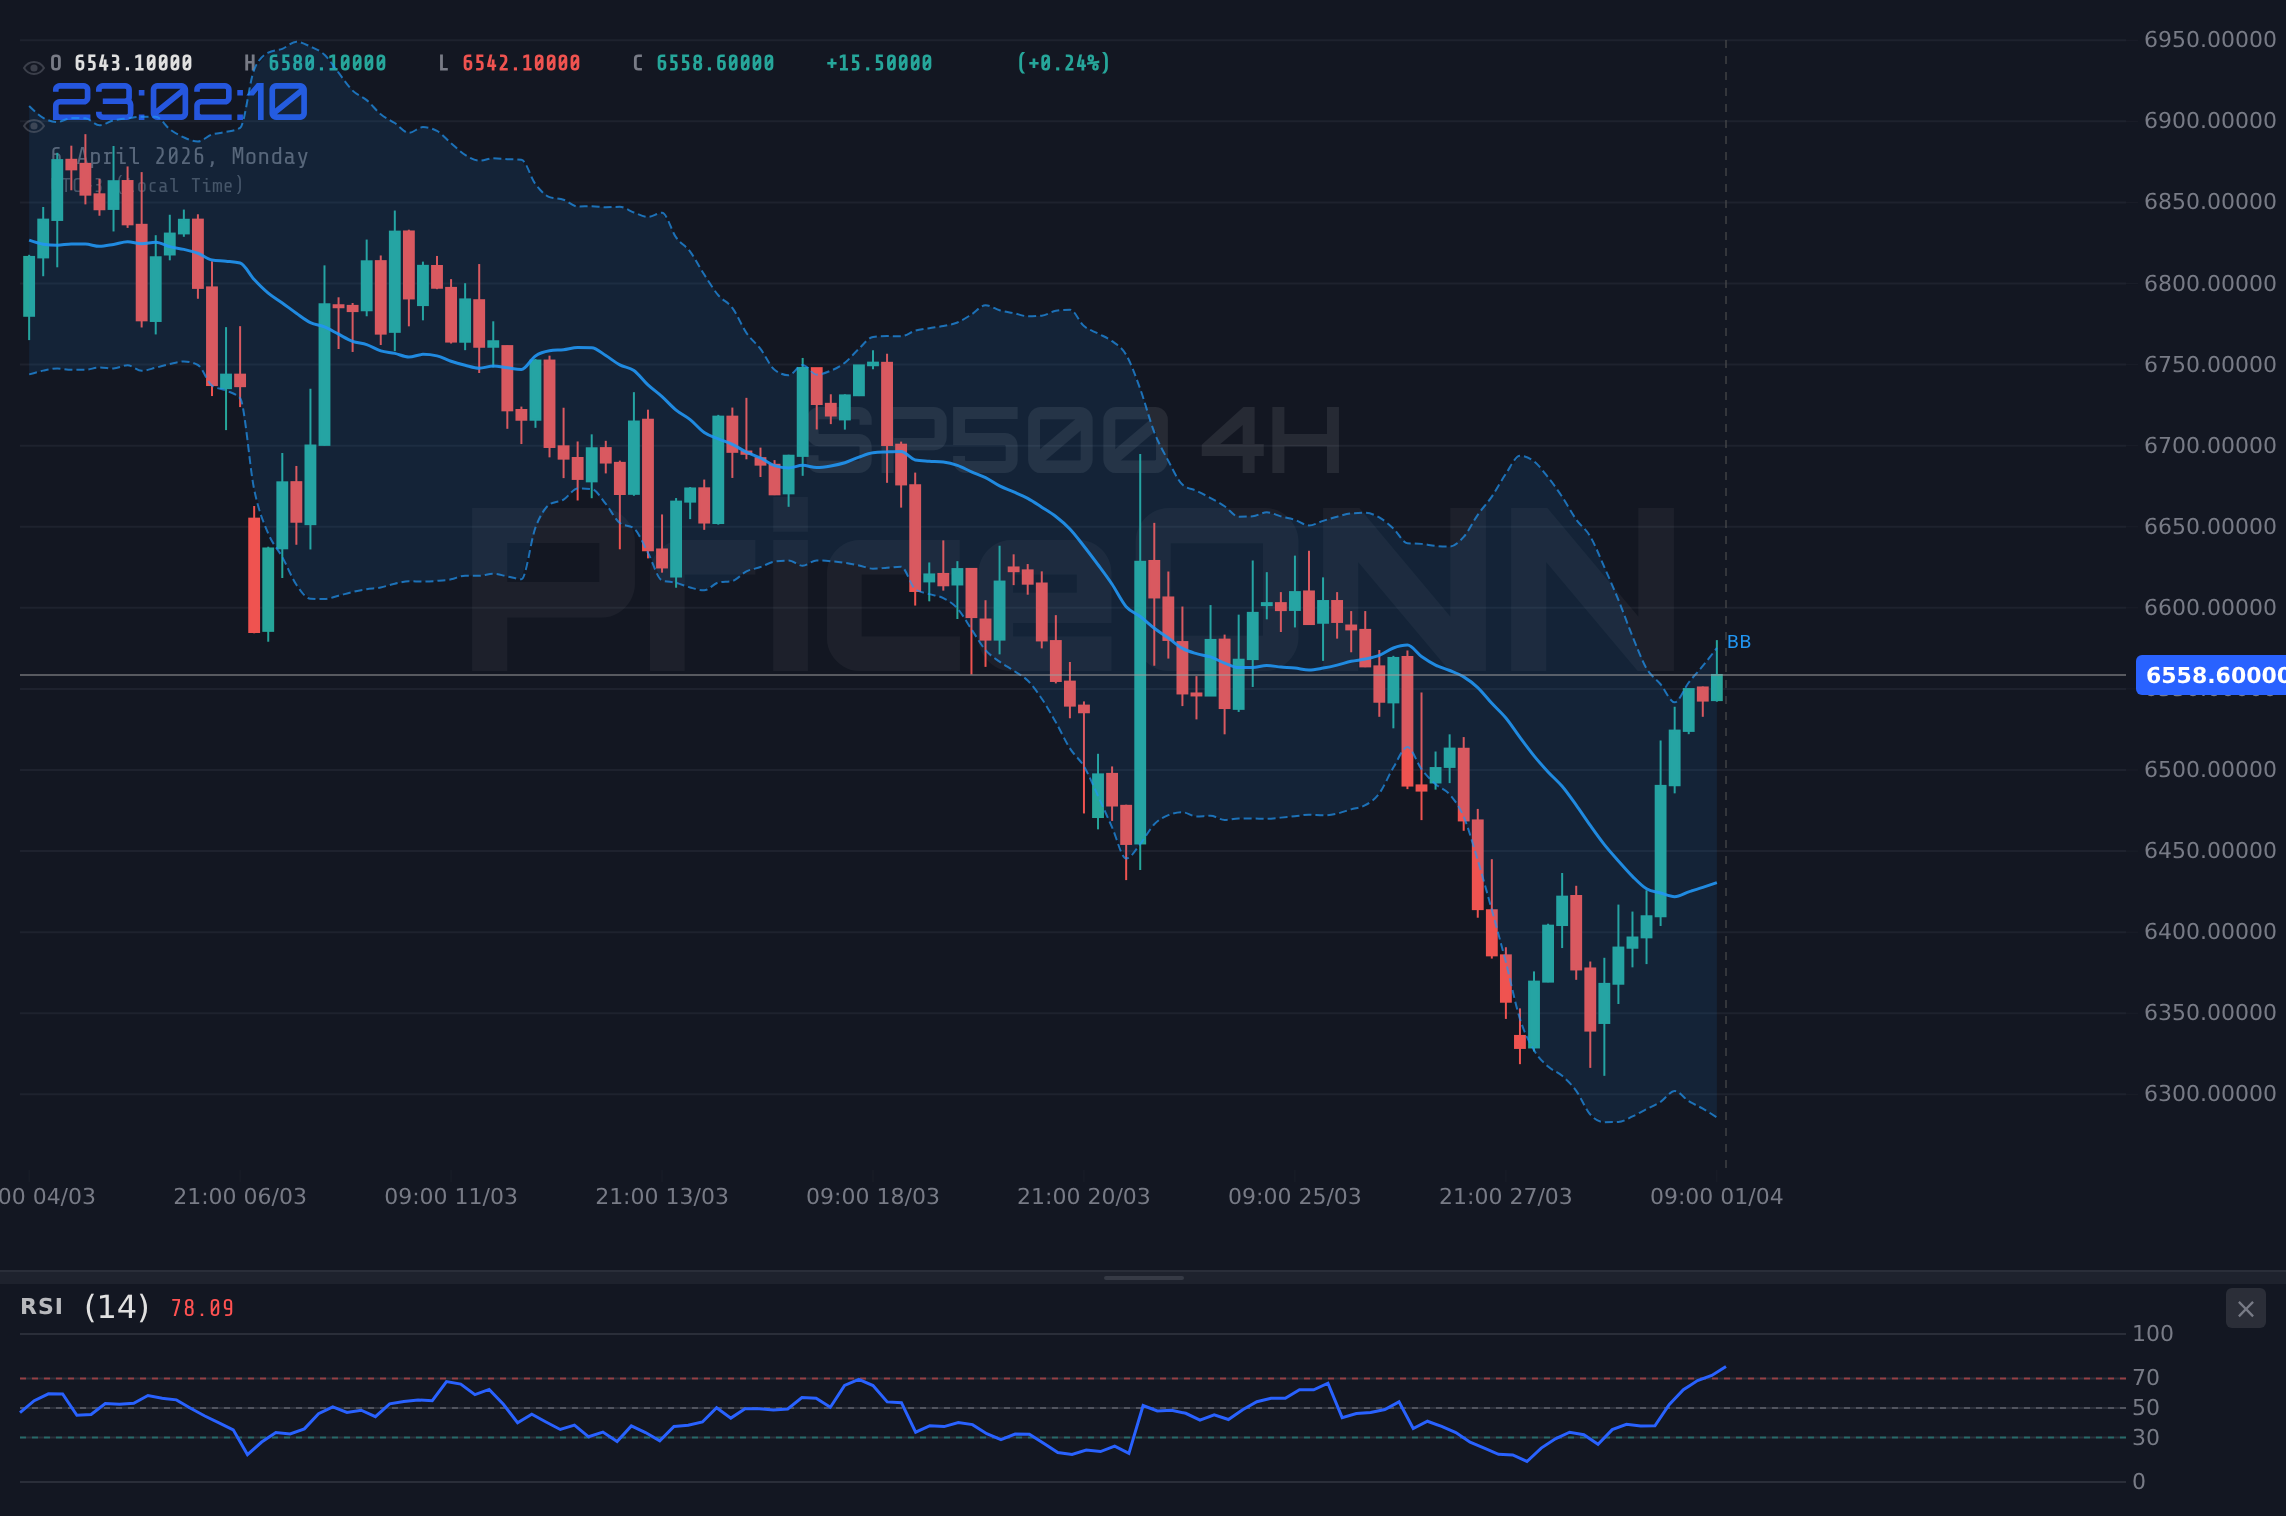
On the 1-hour chart, the S&P 500 paints a picture of bullish momentum, with an ADX reading of 49.72 indicating a strong uptrend. The RSI at 70.95, however, flags an overbought condition, suggesting that the recent surge might be approaching exhaustion. This is a classic scenario where short-term strength meets potential overextension. The MACD histogram is showing negative momentum, dipping below its signal line, which typically signals a potential pullback or consolidation. Furthermore, the Stochastic Oscillator, with K=65.73 and D=73.5, also indicates an overbought condition and a bearish crossover, reinforcing the idea that the immediate upward pressure could be waning. The Bollinger Bands are trading above the middle band, aligning with the upward trend, but the RSI's position warrants caution for aggressive bullish plays at these levels.
Shifting to the 4-hour timeframe, the narrative becomes more balanced. The trend strength is neutral (50%), reflecting a market caught between opposing forces. The RSI at 62.83 is in neutral territory but leaning towards bullish, while the Stochastic Oscillator is deep in overbought territory (K=97.85, D=86.96), signaling a potential reversal or at least a pause. The ADX at 24.23 suggests a moderately strong trend, but the Stochastic's extreme readings cannot be ignored. The MACD is positive, supporting the bulls, but the confluence of overbought Stochastic and a neutral trend strength indicates that the path higher might not be straightforward. This timeframe suggests that while the overall trend might still be up, the immediate buying pressure could be facing headwinds.
The daily chart presents the most complex picture, revealing a strong downtrend with an ADX of 47.51. This is a significant indicator of underlying weakness, suggesting that the recent upward moves might be mere corrections within a larger bearish structure. The RSI at 45.35 is in neutral territory, leaning downwards, which aligns with the strong downtrend signal. However, the Stochastic Oscillator shows a bullish signal with K=42.97 and D=29.88, indicating potential for a short-term bounce or a reversal. The MACD is positive, with its histogram above the signal line, which is a bullish divergence from the overall downtrend indicated by the ADX. This conflict between strong downtrend indicators (ADX) and potential bullish signals (Stochastic, MACD) highlights the current indecision and the critical role upcoming data will play in resolving this technical ambiguity. The battle for control between bulls and bears is clearly evident across different timeframes.
The Dollar's Shadow: DXY and Its Influence
The Dollar Index (DXY) is currently trading at 99.77, showing a slight increase and a strong daily uptrend signal (ADX: 29.76). This strengthening dollar typically exerts downward pressure on commodities like gold and can influence currency pairs, potentially impacting US equities indirectly by affecting corporate earnings and investor sentiment. A stronger dollar can make US exports more expensive and imports cheaper, and it often reflects a global preference for safe-haven assets, which can sometimes come at the expense of riskier assets like stocks. The DXY's movement is a crucial piece of the puzzle, acting as a barometer for global risk appetite and monetary policy expectations. Its current upward trajectory suggests that, despite potential Fed pauses, the dollar is still seen as a relatively strong currency in the current global landscape.
The correlation between the DXY and the S&P 500 isn't always straightforward, but a rising dollar can sometimes coincide with a risk-off sentiment, leading to declines in US equities. Conversely, periods of dollar weakness might accompany rallies in stocks. At 99.77, the DXY is testing key levels itself. If it continues to climb, it could add to the resistance pressure on the S&P 500, especially if it breaches the 100.04 resistance level on the daily chart. Conversely, a weakening dollar, perhaps triggered by dovish signals from the Fed or positive global economic news, could provide a tailwind for the S&P 500, helping it break through the current resistance. This dynamic underscores the importance of monitoring the DXY alongside equity indices.
Economic Catalysts: The Specter of Payrolls Data
The most significant event on the horizon is the release of the US payrolls data. The previous Non-Farm Payrolls (NFP) figure came in at 63, which was a mixed signal. Forecasts for the upcoming report are crucial, and any significant deviation from expectations could trigger substantial market volatility. Stronger-than-expected job growth might fuel inflation concerns and prompt the Federal Reserve to maintain a hawkish stance on interest rates, potentially pressuring equities. Conversely, weaker job growth could signal economic slowdown, leading to expectations of Fed rate cuts, which might boost stock prices in the short term but raise concerns about the underlying economic health.
The market's reaction to past economic data releases is also telling. For instance, the previous USD data point for employment change was 0.4, and the unemployment rate was 3.1. These figures, along with other leading indicators like PMI data (forecasted at 51.1 vs. previous 51.7), paint a picture of an economy that is perhaps cooling but still showing resilience. However, the sheer number of economic data points and their varying impacts mean that the upcoming payrolls report, often considered a leading indicator for the broader economy, will likely take center stage. Traders will be dissecting not just the headline NFP number but also average hourly earnings and the labor force participation rate for a comprehensive view.
The interplay between central bank policy and economic data cannot be overstated. The Federal Reserve has been navigating a delicate balance, attempting to curb inflation without triggering a severe recession. Market participants are constantly pricing in the probability of future interest rate hikes or cuts. Tools like CME FedWatch are closely watched, though specific probabilities are not available in the provided data. However, the general sentiment surrounding monetary policy – whether it’s perceived as hawkish or dovish – significantly influences risk appetite. If the upcoming economic data suggests persistent inflationary pressures or a robust labor market, it could reinforce expectations of higher-for-longer interest rates, acting as a headwind for the S&P 500. Conversely, signs of economic cooling might increase the odds of rate cuts, potentially providing a bullish catalyst.
Geopolitical Undercurrents and Market Sentiment
Recent breaking news highlights escalating geopolitical tensions, particularly concerning the Strait of Hormuz. This is a critical chokepoint for global oil supply, and any disruptions there can send ripples through energy markets and global inflation expectations. While the news also mentions a push to boost domestic copper production and the ongoing debate around AI's job impact, the immediate market sentiment is often swayed by immediate geopolitical flashpoints. Such tensions typically increase demand for safe-haven assets, which could theoretically benefit gold (XAUUSD at $4,654.72) and potentially weigh on riskier assets like equities. However, the S&P 500's current upward trajectory suggests that market participants might be pricing in a de-escalation or deeming the risk manageable for now.
The reports about Bitcoin and Ethereum showing resilience despite geopolitical shocks and rising oil prices suggest that the crypto market, while sensitive to broader risk sentiment, might be developing its own drivers. However, for traditional markets like the S&P 500, geopolitical instability remains a significant risk factor. The news about Vizsla Copper's drilling success and Wheaton Precious Metals outperforming indicate specific sector strengths, but the overarching market sentiment is often dictated by larger macro trends. The current price action in the S&P 500, testing resistance despite these global concerns, could be interpreted in a few ways: either the market is becoming desensitized to geopolitical risks, or it's anticipating a positive resolution, or it's simply caught in a technical uptrend that is temporarily overriding fundamental concerns.
The narrative around energy prices, with Brent crude at $112.47 and WTI at $112.63, also plays a role. Rising oil prices can contribute to inflation, which, as discussed, could influence central bank policy. However, the news suggesting Europe is better positioned to weather energy shocks due to reduced intensity provides some counterpoint. For the S&P 500, the impact of oil prices is often felt through corporate earnings, particularly in the energy sector itself, and through their contribution to overall inflation. If oil prices continue to climb due to geopolitical events, it could add another layer of complexity, potentially dampening consumer spending and corporate margins in other sectors, even as energy stocks benefit.
Trading Scenarios: What Lies Ahead for the SP500?
Bearish Scenario: Resistance Holds Firm
65% ProbabilityConsolidation Scenario: Data Dependent Pause
25% ProbabilityBullish Scenario: Breakout on Strong Data
10% ProbabilityFrequently Asked Questions: SP500 Analysis
What happens if the S&P 500 fails to break above $6,572.87 resistance amid weak NFP data?
If the S&P 500 fails to surpass $6,572.87 and the NFP data is weak, a bearish scenario becomes more probable. Expect a move towards the $6,568.73 and potentially $6,547.63 support levels as traders reassess risk exposure.
Should I buy the S&P 500 at current levels of $6,572.87 given the mixed daily signals and upcoming payrolls?
Caution is advised. While the 1-hour chart shows bullish momentum, the daily ADX at 47.51 indicates a strong downtrend, and RSI is near overbought territory on the 1-hour chart. It might be prudent to wait for clearer direction after the payrolls report or a confirmed break above resistance.
Is the RSI at 70.95 on the 1-hour chart a sell signal for the S&P 500 right now?
An RSI of 70.95 on the 1-hour chart indicates an overbought condition, suggesting potential for a short-term pullback or consolidation. While not a direct sell signal on its own, it warrants vigilance for profit-taking or increased caution against chasing further upside.
How will the upcoming US payrolls data impact the S&P 500's correlation with the DXY near 99.77?
Stronger-than-expected payrolls could boost the DXY near 99.77, potentially pressuring the S&P 500. Conversely, weaker data might lead to a falling DXY and support higher equity prices. The market will likely react to how the data influences Fed rate expectations.
Track markets in real-time
AI-powered analysis, technical indicators and real-time price data.
Join Our Telegram Channel
Breaking market news, AI analysis and trading signals instantly.
Join Channel