
SP500 Today Analysis: $6,572.87 Holds Amidst Shifting Market Sentiment
The SP500 closed at $6,572.87, navigating a week of mixed signals. Can key support levels hold as geopolitical tensions and inflation fears clash?
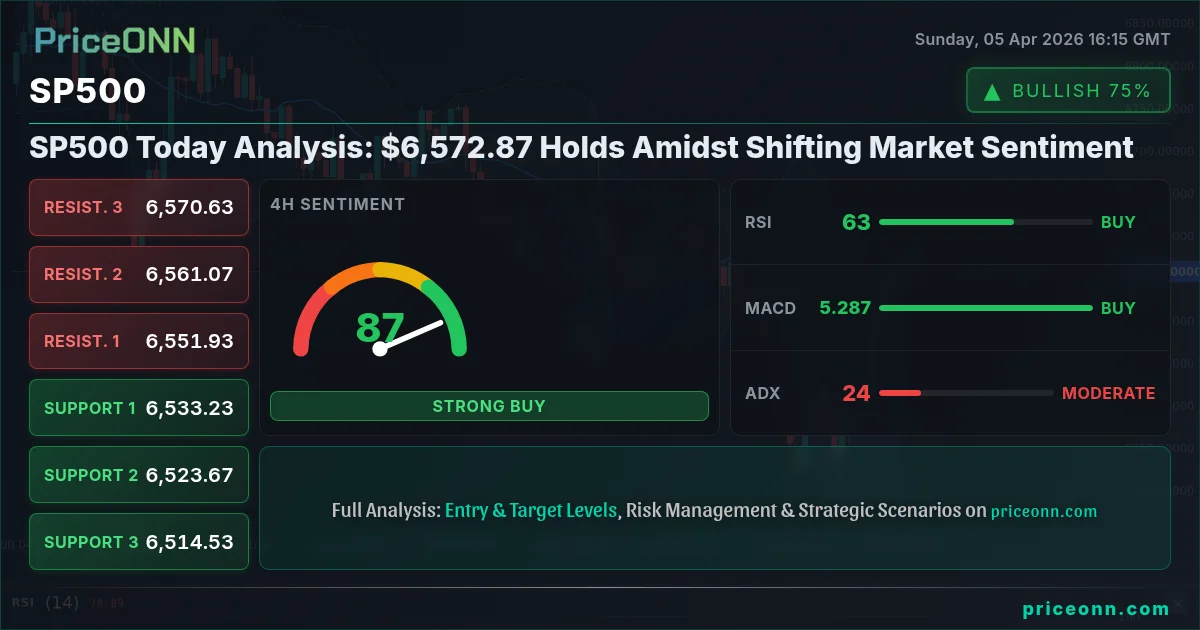
The S&P 500 index, a barometer for US equity market health, concluded the past trading week at $6,572.87, reflecting a modest 0.74% gain amid swirling geopolitical tensions and persistent inflation concerns. While the index managed to eke out a positive close, the underlying trend remains a subject of intense debate among market participants. The past week saw significant price action, with the index trading within a range from $6,522.10 to $6,580.10. This choppiness underscores a market caught between lingering geopolitical anxieties, which typically fuel risk-off sentiment and safe-haven demand, and the enduring narrative of potential central bank policy shifts. Understanding the interplay between these forces is crucial for navigating the upcoming trading sessions. This analysis delves into the technical and fundamental factors shaping the S&P 500's trajectory, examining key levels, market correlations, and the probabilities of various scenarios unfolding.
- The S&P 500 closed Friday at $6,572.87, up 0.74% for the week but facing a prevailing bearish trend signal on the daily chart.
- Key support for the SP500 sits at $6,522.10, tested multiple times this week, while resistance looms at $6,580.10.
- RSI at 45.35 on the daily chart indicates bearish momentum is building, despite short-term positive signals on lower timeframes.
- The correlation with a strengthening DXY (99.68) adds pressure, suggesting risk aversion might cap further upside for US equities.
The SP500's Tightrope Walk: Navigating Cross-Market Currents
The S&P 500's recent performance, closing at $6,572.87 after a 0.74% weekly rise, paints a picture of cautious optimism battling underlying bearish pressures. This delicate balance is heavily influenced by a complex web of global economic and geopolitical factors. The Dollar Index (DXY), currently at 99.68 and showing a strong upward trend on the daily chart, acts as a significant headwind. As the dollar strengthens, it typically dampens appetite for riskier assets like equities, including the S&P 500. Investors often see a strong dollar as a sign of global economic stability or a precursor to tighter monetary policy, both of which can reduce the appeal of stocks. This inverse correlation is a critical element in understanding potential price movements. When the DXY pushes higher, as it has been, it creates a natural ceiling for indices like the S&P 500, making significant rallies harder to sustain without a corresponding shift in currency dynamics.
Furthermore, the performance of other major indices provides vital context. The Nasdaq 100, currently at 23,954.64, experienced a slight dip of 0.37% for the week, suggesting a potential rotation away from growth-oriented tech stocks, which often form a significant part of the S&P 500. The Dow Jones Industrial Average, closing at 46,390.46 with a 0.27% weekly decline, also hints at a cautious sentiment pervading the broader market. This divergence in performance, or lack of strong upward momentum across the board, suggests that the recent gains in the S&P 500 might be more technical than fundamentally driven. The market appears to be in a state of flux, weighing the immediate impact of geopolitical events against longer-term economic data and central bank policy expectations. The SP500 price forecast remains heavily contingent on how these cross-currents resolve.
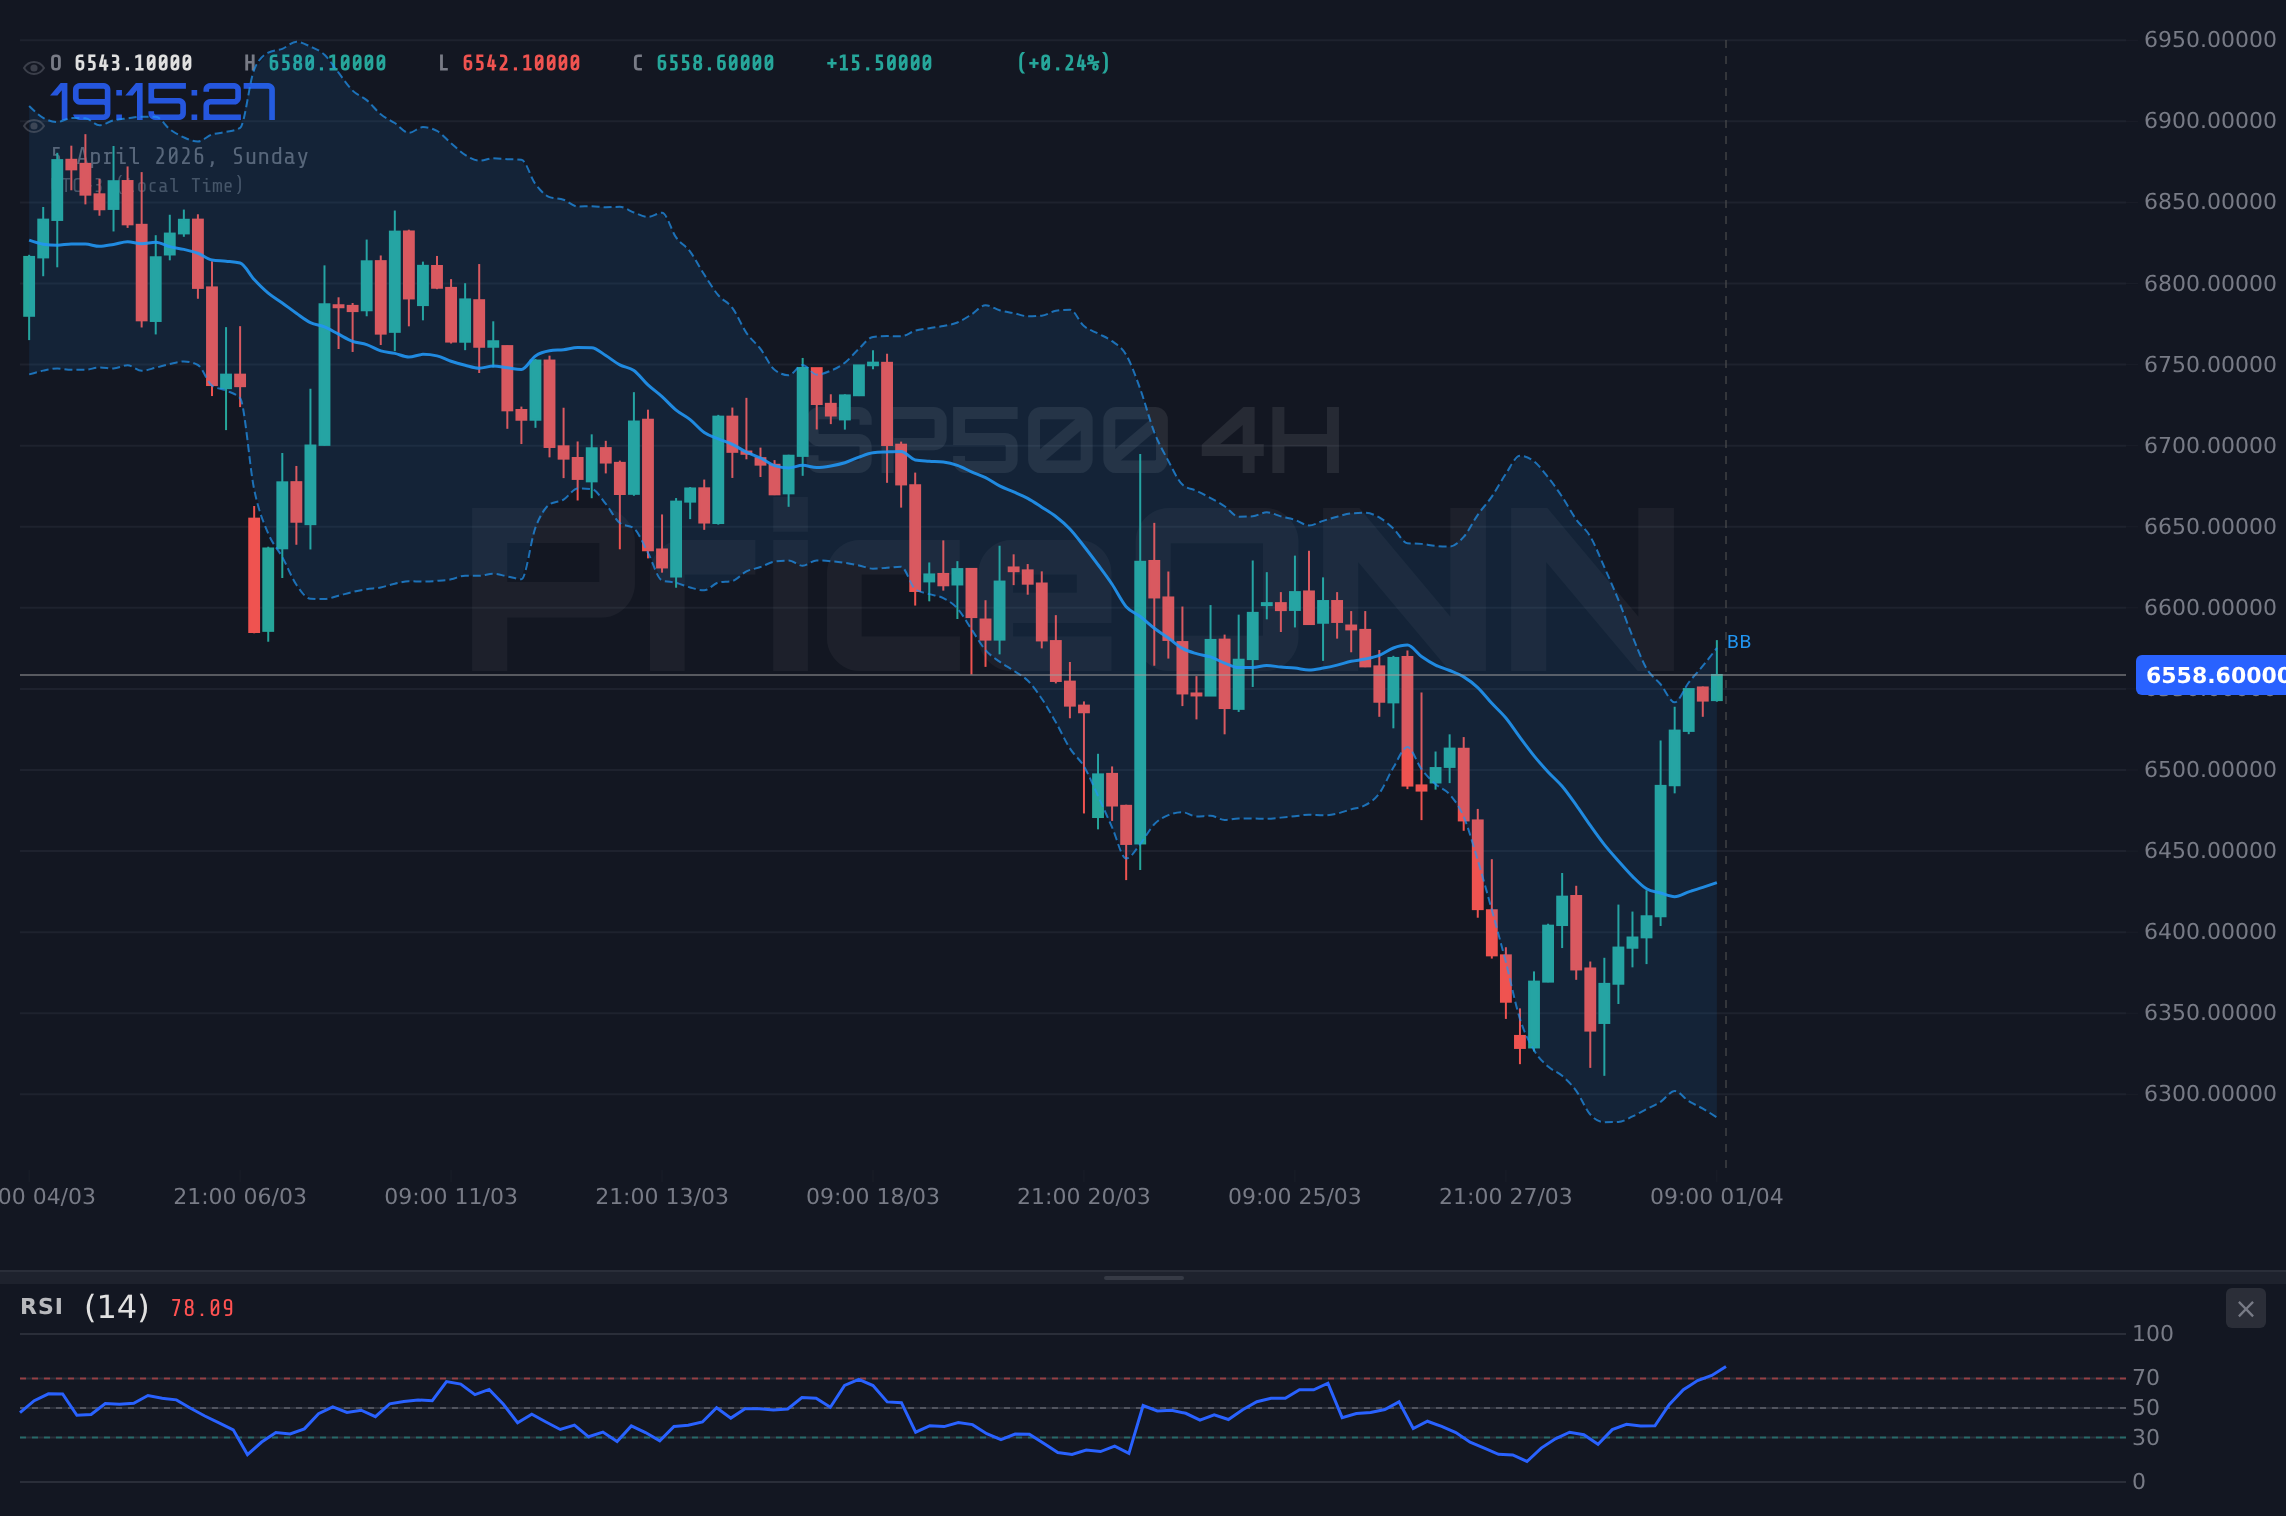
The prevailing bearish trend signal on the S&P 500's daily chart, despite the weekly gain, warrants careful consideration. The ADX at 47.51 signifies a strong downward trend, and the daily RSI at 45.35, while not yet deeply oversold, suggests that momentum is leaning towards the downside. This technical picture implies that the recent upward movement might be a retracement within a larger bearish structure rather than the beginning of a sustained recovery. For traders and investors, this means that while short-term opportunities might arise, the broader trend suggests caution. The SP500 trend analysis points towards potential headwinds, making a breakdown below key support levels a distinct possibility if the bearish sentiment solidifies.
Geopolitical Fault Lines and Their Impact on Risk Appetite
The global geopolitical landscape remains a significant wildcard, casting a long shadow over financial markets and directly influencing risk appetite. The ongoing tensions, particularly in the Middle East, continue to be a primary driver of market uncertainty. While precious metals like gold have shown resilience, currently trading around $4,676.18, the broader impact on risk assets like the S&P 500 cannot be ignored. Increased geopolitical turmoil often leads to a 'risk-off' environment, where investors flee from perceived riskier assets such as stocks and allocate capital to safer havens like gold, US Treasuries, or the US dollar itself. This dynamic was evident in the recent sharp downturn in precious metals, despite ongoing conflicts, highlighting a complex market reaction where underlying inflation fears might be overshadowing immediate conflict risks for some assets.
The market's reaction to these geopolitical events is not always linear. For instance, while oil prices, with Brent at $112.29 and WTI at $112.19, have surged due to supply disruption fears, their impact on inflation expectations can create a double-edged sword for equities. Higher oil prices can fuel inflation, potentially leading to delayed or fewer interest rate cuts by central banks. This, in turn, can weigh on stock valuations. The S&P 500 price forecast is therefore intricately linked to the de-escalation or escalation of these global hotspots. Any significant development, whether positive or negative, can trigger sharp market movements. The question for many traders is whether the market has fully priced in the current geopolitical risks or if further shocks are yet to come. This uncertainty makes SP500 market sentiment analysis a crucial exercise.
The Federal Reserve's stance on monetary policy is another critical factor intertwined with geopolitical events. If geopolitical instability leads to sustained higher energy prices and thus higher inflation, it could force the Fed to reconsider its rate cut trajectory. This possibility was highlighted in recent news, suggesting that rising oil prices might indeed force the Fed to halt rate cuts. Such a development would undoubtedly put downward pressure on the S&P 500, as higher-for-longer interest rates typically make equities less attractive compared to fixed-income investments. The market's sensitivity to Fed communication and economic data releases has intensified, making the upcoming economic calendar a focal point for SP500 analysis.
The Fed's Dilemma: Inflation vs. Growth
The Federal Reserve finds itself in a precarious position, balancing the need to control inflation with the desire to support economic growth. Recent economic data, while not explicitly detailed for the S&P 500's direct context in the provided data, generally indicates a complex picture. The lack of specific upcoming economic events in the provided calendar for USD makes it difficult to pinpoint precise catalysts, but the general sentiment surrounding inflation and growth remains paramount. If inflation proves more stubborn than anticipated, the Fed might be compelled to maintain a tighter monetary policy for longer, potentially delaying or even reversing planned interest rate cuts. This scenario would likely be bearish for the S&P 500, as higher borrowing costs can stifle corporate earnings and reduce consumer spending.
Conversely, if economic growth shows signs of faltering significantly, the Fed might feel compelled to ease policy to support the economy, even if inflation remains elevated. This would create a difficult trade-off, potentially leading to stagflationary concerns. The market's interpretation of Fed actions and communication is therefore critical. Traders are constantly scanning for clues about the Fed's next move, analyzing everything from employment figures to manufacturing data. The SP500 price forecast hinges significantly on the Fed's ability to navigate this tightrope walk effectively. The market's reaction to any hint of policy change - whether hawkish or dovish - can be swift and dramatic, leading to volatility around key economic data releases.
The current technical indicators on the S&P 500 also reflect this uncertainty. While lower timeframes might show some positive momentum, the daily chart's RSI at 45.35 and ADX at 47.51 clearly indicate a dominant bearish trend. This suggests that any rallies might be short-lived opportunities for profit-taking rather than the start of a sustainable upward move. The market's ability to digest inflation data and Fed signals will be key in determining whether the index can overcome these bearish technicals and challenge higher resistance levels.
The SP500's Technical Landscape: Levels to Watch
From a technical standpoint, the S&P 500 is currently trading at a critical juncture around $6,572.87. The past week saw the index test its lower support levels, with the immediate floor identified at $6,522.10. This level has been tested multiple times, and its ability to hold will be a significant determinant of the near-term outlook. A decisive break below $6,522.10 would likely trigger further selling pressure, potentially targeting the next support at $6,514.53 and subsequently $6,377.47 on the daily chart. The SP500 support and resistance levels are therefore crucial reference points for traders assessing risk.
On the upside, resistance remains a formidable barrier. The index struggled to break above $6,580.10 throughout the week, highlighting the strength of the selling pressure at these higher levels. The next significant resistance lies at $6,605.07, followed by $6,685.83. A sustained move above these levels would be required to invalidate the current bearish trend and signal a potential reversal. The SP500 key levels analysis shows a market poised between these two critical zones, with the immediate bias leaning towards the downside given the prevailing technical indicators.
Examining the indicators provides further insight into the S&P 500's technical posture. The daily RSI reading of 45.35 suggests that while the index is not deeply oversold, it has room to fall further before reaching extreme levels. This reading supports the idea that the current bearish trend has room to develop. The MACD, while showing positive momentum on some timeframes, presents a contrasting picture on the daily chart where it is below the signal line, reinforcing the bearish bias. The ADX at 47.51 is particularly telling; it indicates a strong downward trend is in place, meaning that rallies might be met with significant selling pressure. This SP500 trend analysis underscores the importance of adhering to risk management principles.
The Stochastic Oscillator on the daily chart, with K at 42.97 and D at 29.88, shows a bullish crossover, suggesting a potential short-term bounce. However, this signal must be viewed in the context of the stronger bearish indicators like the RSI and ADX. For this bullish signal to gain conviction, it would need to be accompanied by a significant increase in buying volume and a decisive break above immediate resistance levels. Without such confirmation, the Stochastic's signal may simply represent a temporary pause in the downtrend. The SP500 trading signals are currently mixed across different timeframes, demanding a nuanced approach.
The SP500's Chart Pattern Recognition: What the Charts Tell Us
The S&P 500's price action over the past week has formed a pattern that warrants close attention. On the daily chart, the index appears to be consolidating within a bearish channel, with higher highs and lower lows characteristic of a downtrend. The inability to decisively break above the resistance at $6,580.10, coupled with the repeated testing of support around $6,522.10, suggests a battle for control between buyers and sellers. The SP500 chart pattern recognition points towards a potential continuation of the downward move, especially if the key support fails. The volume accompanying these price movements will be crucial; a surge in volume on down days and low volume on up days would further confirm the bearish bias.
The 4-hour chart shows a slightly different picture, with some indicators suggesting a potential for a short-term rally. The RSI is at 62.83, indicating bullish momentum, and the Stochastic is in overbought territory (K=97.85, D=86.96), suggesting a potential reversal or consolidation. However, this short-term bullish signal on the 4-hour chart is being overshadowed by the stronger bearish signals on the daily timeframe. This multi-timeframe analysis highlights the importance of not relying on a single timeframe. Traders looking for confirmation of a bullish reversal would need to see a clear break above the daily resistance levels, accompanied by improving volume and more convincing daily indicator signals.
The 1-hour chart, while showing a bullish trend with an ADX of 23.39, is the least reliable for determining the overall direction due to its short-term focus. The RSI is at 70.95, nearing overbought territory, and the MACD histogram is negative, indicating weakening momentum. This suggests that any upward movement observed on the 1-hour chart might be a temporary correction within the larger bearish trend. The SP500 breakout scanner would likely be showing caution, with no clear signals for a sustained upward move at this juncture. The price action above $6,572.87 needs to be sustained and confirmed by higher timeframes to be considered a true bullish development.
Ultimately, the SP500's technical setup is currently leaning bearish. The confluence of bearish signals on the daily chart - RSI below 50, strong ADX, and price action respecting resistance - outweighs the short-term bullish indications from lower timeframes. The market sentiment analysis suggests that while traders might attempt to catch bounces, the prevailing trend implies that downside risks remain elevated. The SP500 price action needs to break decisively above key resistance levels and hold them, supported by improving macroeconomic data and a less hawkish central bank outlook, to signal a genuine shift in sentiment.
Scenario Analysis: Mapping Potential SP500 Futures
Bearish Scenario: The Downside Path
65% ProbabilityNeutral Scenario: The Waiting Game
25% ProbabilityBullish Scenario: The Upside Surprise
10% ProbabilityWhat I'm Watching: Key Triggers for the SP500
As we look ahead, several key triggers will dictate the S&P 500's path. The immediate focus remains on the support level at $6,522.10. A failure to hold this level on the daily chart, especially with increased volume, would significantly increase the probability of the bearish scenario unfolding. Conversely, a decisive close above the $6,580.10 resistance, backed by strong conviction and perhaps positive macroeconomic news or a shift in Fed sentiment, could open the door for a bullish move. The SP500 breakout scanner will be essential in monitoring these potential moves.
Beyond price action, market sentiment and correlations will play a vital role. The DXY's movement remains a critical indicator; a sustained rise above 100 could signal further headwinds for equities. Any significant escalation or de-escalation in geopolitical hotspots would also likely trigger volatility. Furthermore, traders will be closely watching for any hints from the Federal Reserve regarding its monetary policy stance. While specific economic calendar events were not detailed for the USD, any commentary or data that suggests a more hawkish stance could pressure the index downwards, while signs of easing inflation or slowing growth might paradoxically support a risk-on rally if the Fed signals flexibility.
The SP500's correlation with other markets, particularly the Nasdaq 100 and Dow Jones, will also provide clues. If the broader market sentiment shifts decisively, the S&P 500 is likely to follow suit. The current divergence, with the Nasdaq showing some weakness and the Dow Jones also declining slightly, suggests that the underlying strength supporting the S&P 500's recent gains might be fragile. Patience and disciplined risk management will be paramount. Waiting for clear confirmation of a trend - either a confirmed break of support or a decisive move through resistance - is the most prudent approach in this uncertain environment. The SP500's key levels provide the roadmap, but the catalyst will determine the direction.
The current market exhibits characteristics of a 'choppy' or 'range-bound' environment on lower timeframes, but the daily chart clearly shows a bearish trend. Always prioritize the higher timeframe trend. Look for pullbacks to resistance levels to initiate short positions if the bearish thesis plays out, or wait for a confirmed break of the key support at $6,522.10 before considering aggressive selling. Conversely, a bullish confirmation would require a clear break and hold above $6,580.10, ideally with strong volume and positive macro news.
Frequently Asked Questions: SP500 Analysis
What happens if SP500 breaks below the $6,522.10 support level?
A daily close below $6,522.10 would invalidate the current neutral stance and likely trigger a move towards the next support at $6,514.53. This would confirm the bearish trend, with a potential target of $6,377.47 in the medium term, especially if accompanied by rising DXY and inflation fears.
Should I buy SP500 at current levels of $6,572.87 given the mixed signals?
Buying at current levels of $6,572.87 carries significant risk due to the prevailing bearish daily trend (RSI 45.35, ADX 47.51). A more prudent approach would be to wait for confirmation: either a confirmed break above $6,580.10 resistance for a bullish setup, or a breakdown below $6,522.10 support for a bearish opportunity. The probability of the bearish scenario is currently higher.
Is the RSI at 45.35 a sell signal for SP500 right now?
An RSI of 45.35 on the daily chart is not an extreme sell signal but indicates bearish momentum is building. It suggests that sellers are gaining an upper hand and that rallies may be met with resistance. It supports the overall bearish trend analysis, implying that downside potential is greater than immediate upside potential.
How will the geopolitical situation and DXY at 99.68 affect SP500 this week?
Heightened geopolitical tensions and a strong DXY at 99.68 typically create a risk-off environment, pressuring assets like the SP500. If these factors persist, they could cap any upside attempts and increase the likelihood of the index testing lower support levels. Traders should monitor the DXY for continued strength as a key indicator of potential equity market weakness.
| Indicator | Value | Signal | Interpretation |
|---|---|---|---|
| RSI (14) | 45.35 | Bearish | Momentum leaning downwards, room to fall. |
| MACD Histogram | -0.38 | Bearish | Negative momentum developing on daily chart. |
| Stochastic %K/%D | 42.97 / 29.88 | Bullish Crossover | Short-term bounce signal, but needs higher TF confirmation. |
| ADX | 47.51 | Strong Trend | Indicates a strong prevailing trend (downward). |
| Bollinger Bands | Middle Band | Watch | Price currently below middle band, indicating bearish pressure. |
Key Levels
Track markets in real-time
AI-powered analysis, technical indicators and real-time price data.
Join Our Telegram Channel
Breaking market news, AI analysis and trading signals instantly.
Join Channel