

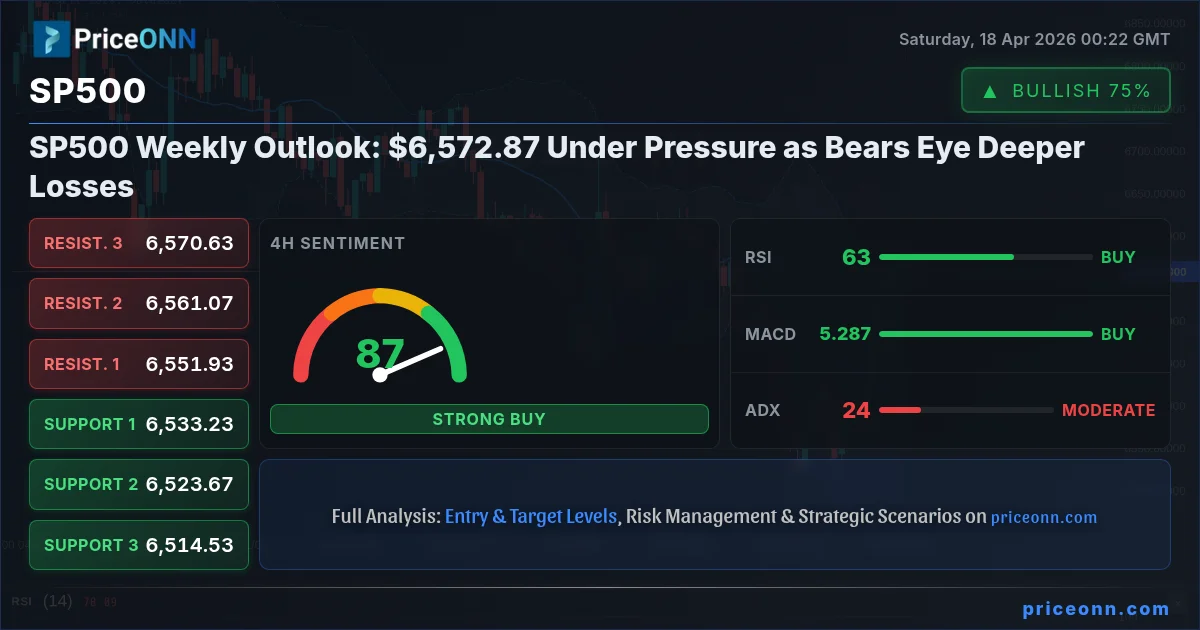
The S&P 500 index stands at a critical juncture, currently trading at $6,572.87. Last week saw significant volatility, with the index closing on a bearish note. Bulls are fighting to defend key support levels, while bears are pressing their advantage, eyeing further declines. This divergence in market sentiment sets the stage for a crucial week ahead. The question on every trader's mind is whether the current weakness signals a deeper correction or merely a pause before the next leg higher. Understanding the interplay between macroeconomic data, central bank policy expectations, and technical indicators will be paramount for navigating this complex market environment.
- The S&P 500's RSI at 45.35 on the daily chart indicates bearish momentum is building.
- Key support for the SP500 sits at $6,533.23, a level tested multiple times this past week.
- The MACD histogram showing negative momentum suggests potential for further downside pressure.
- Fed rate expectations and their correlation with the DXY at 97.9 are influencing the SP500's direction.
The Battle for $6,572.87: Bulls vs. Bears
The Case for the Bulls: A Temporary Pause?
Despite the prevailing bearish sentiment, there are arguments to be made for a potential rebound. The S&P 500's 4-hour chart, for instance, shows a bullish trend with a power score of 50%, suggesting that the underlying strength might still be present. The MACD indicator on this timeframe is positive, with the MACD line above the signal line, indicating upward momentum. Furthermore, the Stochastic indicator on the 4-hour chart presents a bullish signal (%K > %D), currently at 60.96% for %K and 34.62% for %D. This suggests that the market might be oversold on this particular timeframe, potentially setting up for a bounce. The ADX, while indicating a strong trend on the 1-hour chart at 49.72, is at 24.23 on the 4-hour chart, suggesting a moderate trend strength that could still be overcome by buying pressure. The daily chart, although showing a bearish trend with a power score of 100%, also presents a Stochastic reading of K=42.97 and D=29.88, which, while suggesting further downside, is also approaching oversold territory and has a bullish crossover signal. This conflicting data across different timeframes suggests that while the bears have had the upper hand, the bulls haven't entirely capitulated.
The recent surge in the Nasdaq 100, up 1.45% to $26,682.75, and the Dow Jones Industrial Average, up 1.74% to $49,470.5, also offers a glimmer of hope. These indices often lead the broader market, and their upward momentum could eventually spill over to the S&P 500. The narrative driving these gains includes renewed optimism in artificial intelligence and easing oil fears, as evidenced by the Brent crude price holding above $92.54. If this risk-on sentiment continues to dominate, it could pull the S&P 500 higher, forcing the bears to cover their positions. The RSI on the 1-hour chart for the S&P 500 is at 70.95, which is approaching overbought territory, but this doesn't necessarily preclude further upside, especially in strong trending markets. The key will be whether the index can decisively break above the immediate resistance levels identified at $6,568.73 and $6,577.27.
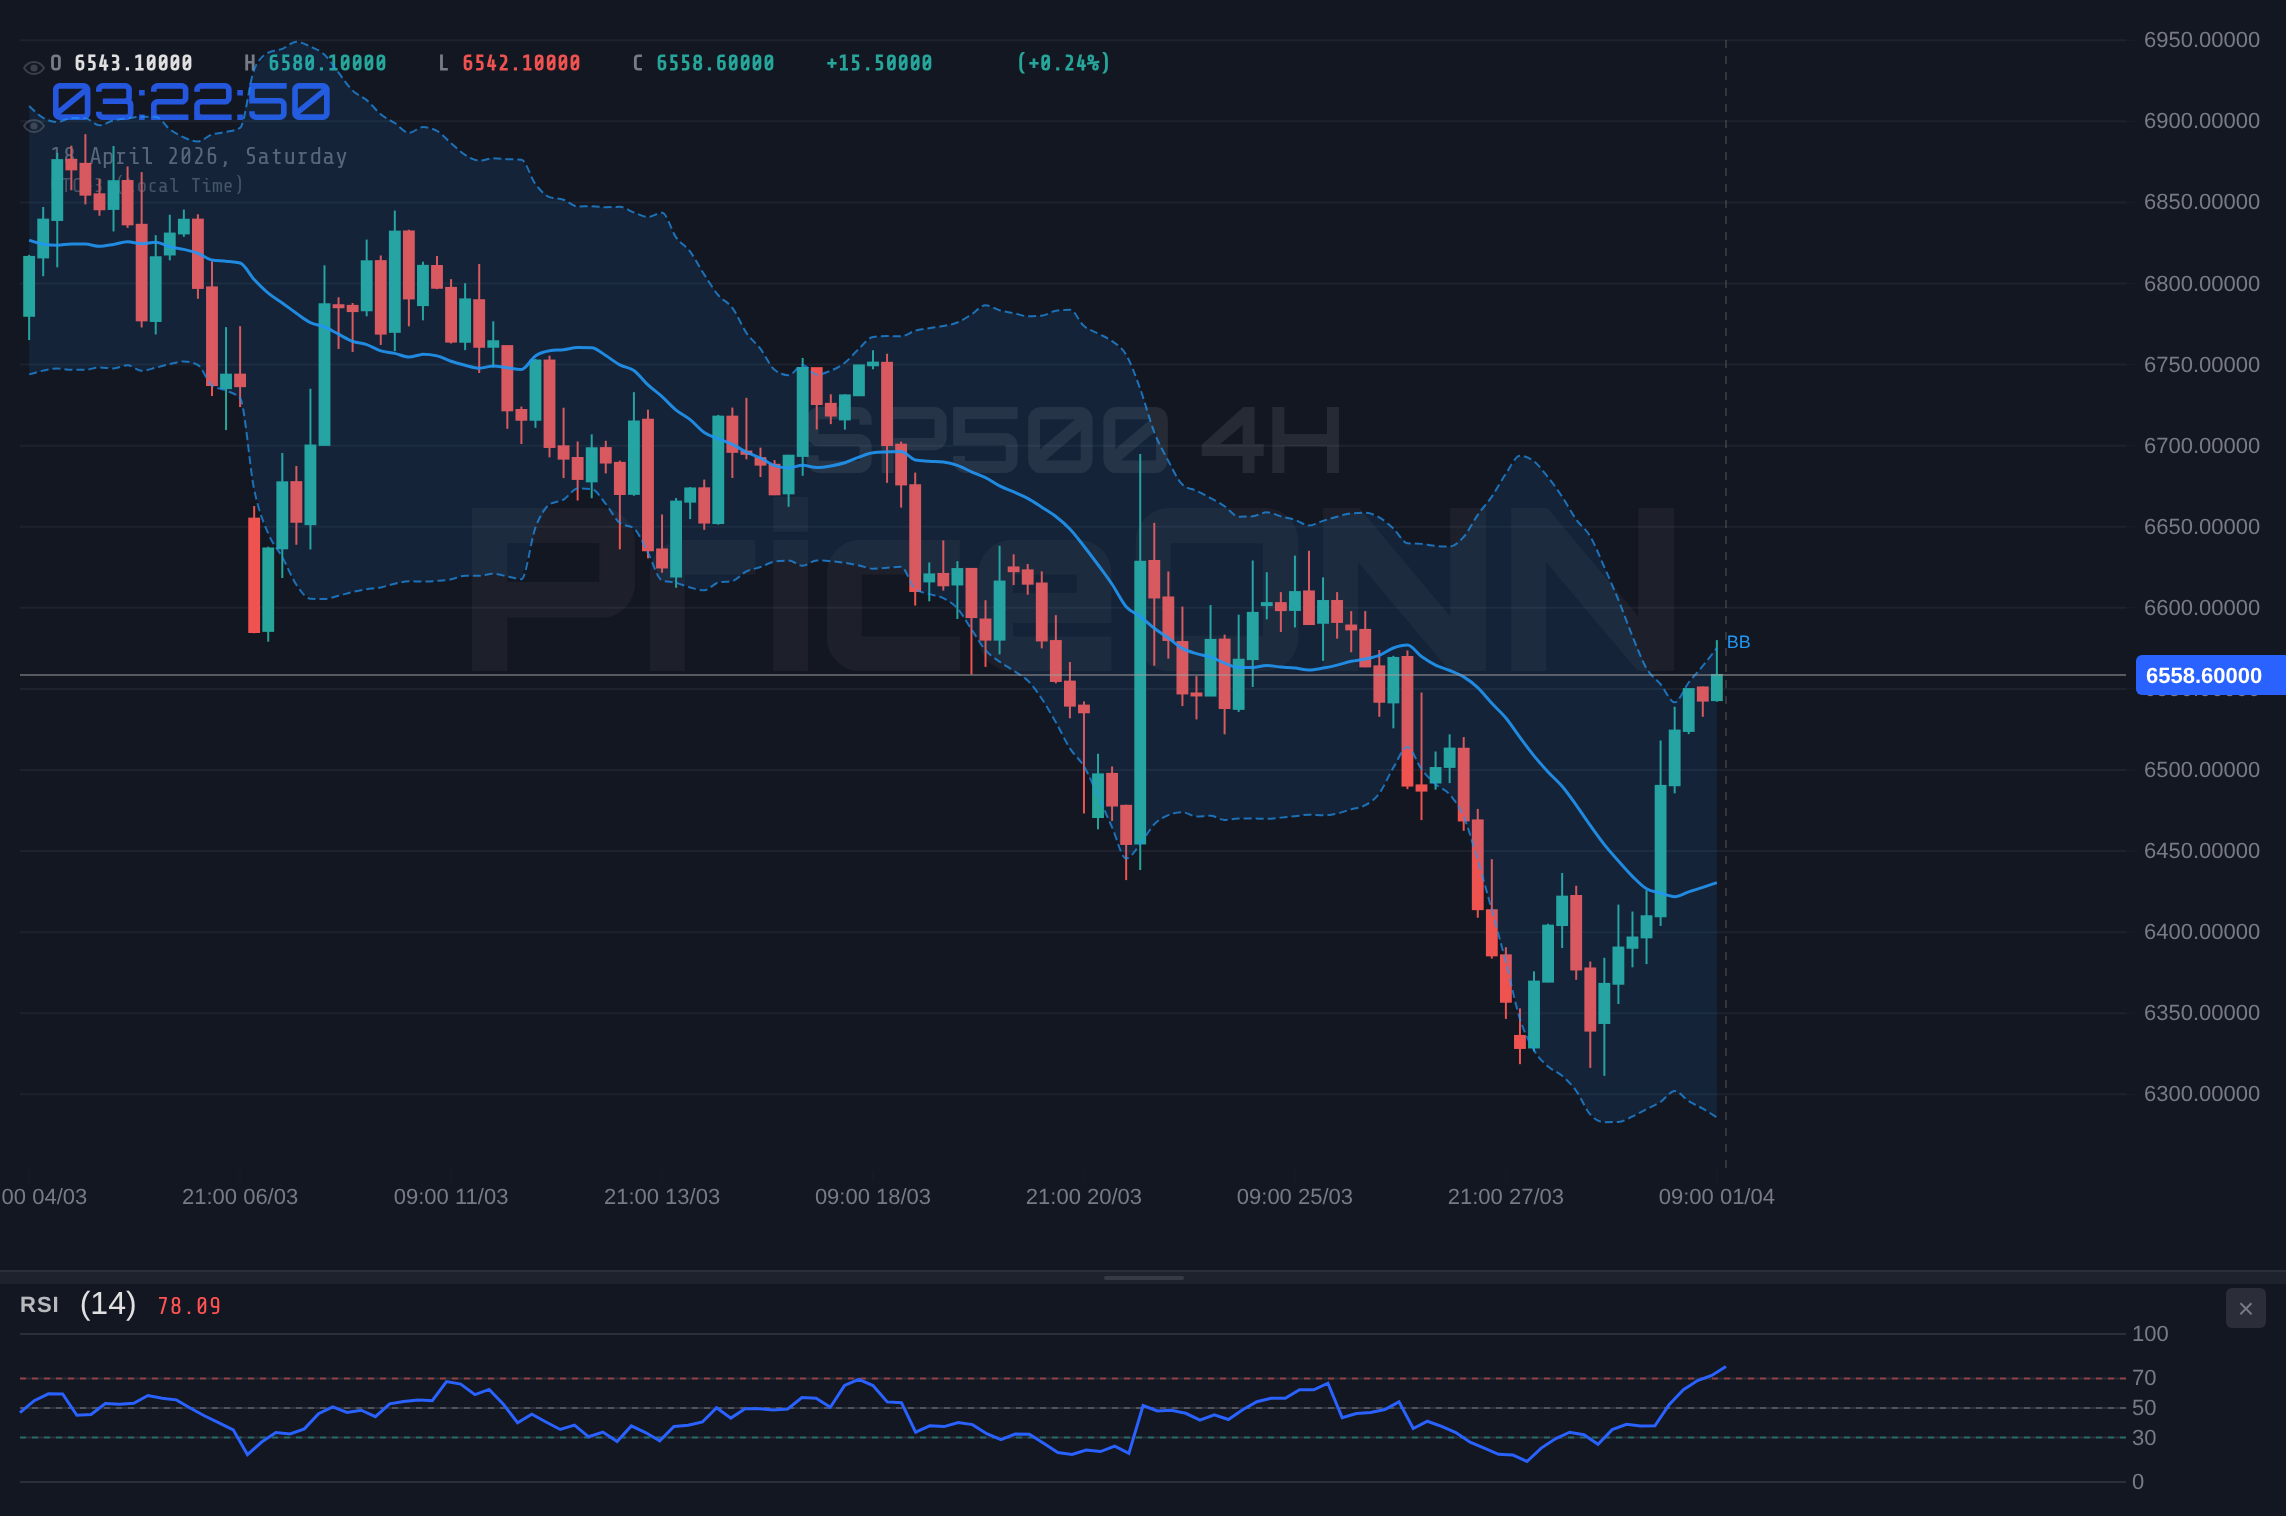
Moreover, the economic calendar, despite its mixed signals, has elements that could support risk assets. The recent GBP inflation data came in higher than expected at 0.5%, and the EUR inflation also exceeded forecasts at 2.6%. While these might typically lead to hawkish central bank expectations, the overall cautious tone from the Fed, as suggested by the slight dip in the DXY to 97.9, could provide a buffer. The market is sensitive to any hint of a pivot or a less aggressive stance from the Federal Reserve, and if upcoming data releases, particularly any concerning employment figures, suggest a cooling economy, it might prompt a reassessment of rate hike probabilities, potentially boosting equities. The fact that the DXY is showing a general downward trend on the 1D chart, with an ADX of 26.2 indicating a strong bearish trend, could also be a tailwind for US equities, as a weaker dollar often correlates with higher stock prices, especially for multinational corporations listed on the S&P 500.
The Bears' Grip: Why the Downside Risk Remains
On the other side of the coin, the bearish case is substantial, supported by several technical and fundamental indicators. The S&P 500's daily chart paints a concerning picture. The trend is decidedly bearish with a power score of 100%, and the RSI at 45.35, while not deeply oversold, clearly indicates bearish momentum is in play. The MACD on the daily timeframe is negative, with the MACD histogram below the signal line, reinforcing the idea of selling pressure. The ADX on the daily chart stands at 47.51, signifying a strong downtrend. This technical setup suggests that the recent upward moves might be mere retracements within a larger downtrend, rather than the start of a new rally. The immediate resistance levels at $6,568.73, $6,577.27, and the more significant $6,605.07 are likely to cap any upside attempts.
The 1-hour chart, often a leading indicator for short-term moves, also shows signs of weakness despite the current price holding above $6,572.87. The RSI at 70.95 is entering overbought territory, which, combined with the bearish MACD momentum and Stochastic showing a %K below %D, suggests that the immediate upward push might be losing steam. The ADX at 49.72 on this timeframe confirms a strong trend, but in this context, it points to the strength of the ongoing bearish move rather than an impending reversal. Furthermore, the S&P 500's correlation with the DXY (Dollar Index) is crucial. The DXY, despite a slight dip to 97.9, has strong bearish signals on the 4-hour and daily charts, with an ADX of 37.19 and 26.2 respectively. A strengthening dollar, which could resume if global risk aversion increases, would typically put pressure on the S&P 500. The fact that the DXY is showing oversold conditions on the daily chart (Stochastic K=15.25, D=9.38) suggests a potential bounce in the dollar, which would be negative for equities.
Fundamentally, the economic data released over the past few days presents a mixed but leaning-negative picture for risk assets. While some inflation figures like GBP and EUR were higher than expected, the USD data paints a different story. The previous USD figure for an economic indicator was 3.081, and the forecast was 2.1, but the actual came in significantly lower at -0.913. Another USD indicator showed a previous value of 0.5 and a forecast of -, with the actual at 207, which is a massive beat. However, other key USD data points, like the previous value of 0.6 and forecast of -, with the actual at 26.7, and another previous value of 0.5 and forecast of -, with the actual at 207, suggest some mixed signals, but the -0.913 reading is particularly concerning for economic growth. If these figures continue to point towards a slowdown, it could reinforce the Federal Reserve's hawkish stance or, conversely, spark fears of a recession, both of which are typically negative for the stock market. The market's reaction to these data points will be critical in determining the next directional move.
Navigating the Levels: What to Watch Next Week
Key Technical Levels in Focus
The immediate price action for the S&P 500 will likely revolve around the $6,572.87 level. On the 1-hour chart, resistance is seen at $6,568.73, $6,577.27, and $6,589.83. A decisive break and hold above $6,580 would be the first sign of bullish conviction. However, the more significant resistance lies at the daily chart levels of $6,605.07 and potentially $6,685.83. These levels represent formidable barriers that would need significant buying pressure to overcome. The fact that the Nasdaq and Dow Jones are showing strength, while the S&P 500 lags slightly, could indicate a rotation or simply a lag effect, but it warrants close observation. The 4-hour chart shows resistance at $6,551.93 and $6,561.07, suggesting that even intra-week gains might face immediate headwinds.
On the downside, the support levels are becoming increasingly important. The 1-hour chart shows immediate support at $6,547.63, followed by $6,535.07 and $6,526.53. A break below $6,533.23, a key level identified on the 4-hour chart, would be a significant bearish signal, potentially opening the door for a test of the daily support at $6,377.47. The daily chart's support structure begins at $6,377.47, then $6,230.63, and finally $6,149.87. These lower levels represent significant downside potential if the current bearish trend resumes with force. The volatility last week, with a daily range between $6,522.1 and $6,580.1, underscores the importance of these levels. Traders will be closely watching to see which side of this range breaks first.
Economic Calendar and Fundamental Catalysts
Looking ahead to the coming week, the economic calendar holds several high-impact events that could sway market sentiment. While today, April 18th, is a Saturday, the previous days saw some significant releases. For instance, the USD saw a notable drop in one indicator to -0.913, contrasting with a previous high of 3.081. Another USD indicator showed a significant beat with an actual of 207 against a previous of 0.5. These mixed signals highlight the data-dependent nature of current market moves. Upcoming high-impact events include crucial US data releases that will shape the Federal Reserve's policy outlook. Investors will be scrutinizing employment figures, inflation data, and manufacturing indices for clues on the economic trajectory. Any deviation from forecasts could trigger significant market volatility.
The Federal Reserve's stance remains a primary driver. While there's no immediate FOMC meeting scheduled, the market is constantly pricing in future rate decisions based on incoming data. The correlation between the DXY and the S&P 500 is also a key factor to monitor. A stronger dollar, potentially driven by a resurgence in risk aversion or hawkish Fed commentary, would likely weigh on US equities. Conversely, a weaker dollar could provide a much-needed tailwind. Furthermore, geopolitical developments, particularly concerning energy markets and international relations, continue to cast a shadow. Any escalation of tensions could lead to a flight to safety, impacting equity markets. The price of Brent crude, currently around $92.54, and WTI at $86.42, will be closely watched as indicators of inflationary pressures and global demand. The sharp drop in oil prices last week (-6.93% for Brent, -6.71% for WTI) might offer some relief on the inflation front, but it also raises questions about global economic health.
The Verdict: Bears in Control, but Watch for Traps
Market Sentiment Analysis
The prevailing market sentiment appears to be leaning bearish for the S&P 500, at least in the short to medium term. The technical indicators on the daily and 1-hour charts predominantly signal downside risk. The RSI values hover in the mid-40s to low-70s, suggesting room for further downside before becoming oversold, while the MACD consistently shows negative momentum. The ADX readings, particularly on the daily chart (47.51), confirm a strong downtrend is in place. This suggests that the recent price action, including the small gains seen on the Nasdaq and Dow Jones, might be temporary pullbacks within a larger bearish structure.
However, the conflicting signals on the 4-hour chart, showing bullish momentum and a potential oversold Stochastic, cannot be ignored. This creates a classic 'bull vs. bear' scenario where the market is grappling with opposing forces. The key will be the reaction to the critical support level around $6,533.23. A failure to hold this level would significantly strengthen the bearish case, potentially triggering stop-loss orders and accelerating declines towards the $6,377.47 mark. Conversely, a strong bounce from this level, confirmed by increasing volume and a shift in momentum indicators, could signal a bear trap and the beginning of a short-term recovery.
Technical Indicators as a Tiebreaker
When faced with conflicting signals, it's crucial to prioritize the indicators that have historically proven more reliable for the S&P 500 and to consider the timeframe. The daily chart's bearish setup, with its strong ADX and negative MACD, carries more weight for the medium-term outlook than the mixed signals on the shorter timeframes. The RSI at 45.35 suggests that while there's room to fall, a sustained move lower would be required to enter deeply oversold territory. The Stochastic on the daily chart (K=42.97, D=29.88) is showing a bullish crossover, which could be an early warning of a potential reversal, but it needs confirmation from price action and other indicators.
The 1-hour chart's overbought RSI (70.95) coupled with a bearish Stochastic crossover (%K
Bearish Scenario: The Slide Continues
65% ProbabilityNeutral Scenario: Range-Bound Consolidation
25% ProbabilityBullish Scenario: A Bear Trap?
10% ProbabilityFrequently Asked Questions: SP500 Analysis
What happens if SP500 breaks below the $6,533.23 support level?
A break below $6,533.23 on the 4-hour chart would confirm the bearish trend, potentially triggering stop-losses and accelerating declines towards the next major daily support at $6,377.47. This would invalidate any short-term bullish hopes.
Should I buy SP500 at current levels of $6,572.87 given the mixed technical signals?
Buying at $6,572.87 carries significant risk due to the bearish daily trend (RSI 45.35, MACD negative). A more prudent approach would be to wait for confirmation, ideally a close above $6,577.27 resistance or a confirmed bounce from $6,533.23 support.
Is the RSI at 45.35 on the daily chart a sell signal for SP500 right now?
An RSI of 45.35 is not a direct sell signal but indicates bearish momentum. It suggests that sellers are in control, and while there is room for further downside before reaching oversold territory, it supports the bearish outlook rather than a bullish one.
How will the upcoming US employment data affect SP500 this week?
Stronger-than-expected employment data could fuel Fed tightening fears, pressuring the SP500 lower. Conversely, weaker data might lead to hopes of a Fed pause, potentially boosting the index. The market's reaction will depend heavily on the magnitude of the surprise relative to forecasts.
Track markets in real-time
AI-powered analysis, technical indicators and real-time price data.
Join Our Telegram Channel
Breaking market news, AI analysis and trading signals instantly.
Join Channel