Weekly Market Outlook - Week 15 (April 6, 2026 – April 10, 2026): Inflation Data Dominates, Risk Appetite in Focus
Week 15 (April 6, 2026 – April 10, 2026) market outlook: U.S. Core PCE inflation data is the key event, with significant implications for the USD, risk appetite, and Fed policy expectations. Energy markets show strong bullish momentum.
5 April 2026, 17:02
15 min read
382 views
Written by
PO
PriceONN ResearchMarket Analysis Team
Weekly Market Outlook: April 6, 2026 – April 10, 2026 (Week 15)
Executive Summary
The upcoming trading week, April 6-10, 2026, will be heavily influenced by a critical U.S. economic data release, with the Core PCE Price Index on Thursday, April 9th, poised to shape market sentiment and potential Federal Reserve policy expectations. Traders will closely monitor this inflation gauge alongside Personal Spending and GDP figures. Technical indicators across major asset classes present a mixed picture: a strong bullish sentiment persists in energy markets (Brent and WTI), while currency majors like EUR/USD and GBP/USD show bearish leanings. Precious metals are navigating key Fibonacci levels, and cryptocurrencies remain under pressure. Stock indices are exhibiting signs of short-term weakness despite longer-term bullish undertones.
The U.S. Dollar Index (DXY) enters the week with a robust bullish technical setup, supported by a strong daily sentiment reading (84%) and positive signals across multiple timeframes (1H: Buy, 4H: Buy, 1D: Buy). The DXY is trading above its 20-day SMA (99.707) and 50-day SMA (99.484) on the daily chart, indicating upward momentum. The RSI(14) is in the neutral zone at 56.9 on the daily timeframe, suggesting room for further upward movement without immediate overbought conditions. The MACD histogram is showing declining bearish momentum on the daily chart, while Stochastics are in overbought territory on the 4H (77.2) and 1W (86.9) timeframes, hinting at potential consolidation. The key focus will be on the upcoming U.S. economic data, particularly the Core PCE Price Index. A higher-than-expected reading could further bolster the dollar, while a softer print might trigger a retracement.
EUR/USD faces considerable downside pressure, with a strong bearish sentiment (84%) across all monitored timeframes (1H: Sell, 4H: Sell, 1D: Sell). The pair is trading below its key SMAs on the daily chart, including the 20-day SMA (1.15433) and 50-day SMA (1.17026), reinforcing the bearish outlook. The RSI(14) at 43.3 on the daily chart indicates bearish momentum is building, while Stochastic %K at 53.4 on the daily and 19.3 on the weekly suggests a potential for oversold conditions on longer timeframes if selling pressure intensifies. Williams%R at -64.0 on the daily and -84.6 on the weekly points towards significant selling pressure. The upcoming U.S. PCE data will be a critical catalyst; a strong USD could push EUR/USD towards its support levels.
GBP/USD mirrors the weakness seen in EUR/USD, exhibiting a strong bearish sentiment (84%) on daily and weekly charts (1H: Sell, 4H: Sell, 1D: Sell). The pair is trading below its key daily SMAs (20-day at 1.33209, 50-day at 1.34711). The daily RSI(14) at 39.8 indicates a bearish trend, and the Stochastic %K at 25.4 on the daily chart is approaching oversold territory, while the weekly %K at 10.7 suggests considerable bearish momentum. Williams%R at -90.7 on both daily and 4H charts strongly indicates oversold conditions. A stronger USD, driven by U.S. economic data, will likely exert further downward pressure. Traders will watch the U.K. Services PMI and Construction PMI for potential counter-movements, though the dominant factor will be USD strength.
USD/JPY presents a more neutral yet bullish leaning technical picture, with a predominantly buy signal (50% neutral strength, 1H: Buy, 4H: Buy, 1D: Buy). The pair is trading above its key SMAs on the daily chart, including the 20-day (159.04) and 50-day (156.75). The daily RSI(14) at 57.4 is comfortably in the bullish territory, and the Stochastics are showing strength, with %K at 53.5 on the daily and a strong 93.1 on the weekly, suggesting potential upward momentum, although the weekly %K is nearing overbought extremes. The ADX at 1.0 across timeframes indicates a lack of strong directional trend, but the overall sentiment leans positive. The key will be whether the pair can maintain its upward trajectory amidst potential safe-haven flows if global risk sentiment deteriorates. Japanese economic data, such as Household Spending, will be secondary to USD dynamics.
AUD/USD is under significant selling pressure, reflecting a strong bearish sentiment (82%) across short to medium term timeframes (1H: Sell, 4H: Sell, 1D: Sell). The pair is trading below its 20-day SMA (0.69926) and 50-day SMA (0.70236) on the daily chart. The daily RSI(14) at 40.6 indicates bearish momentum, and Stochastic %K at 31.2 on the daily chart is moving towards oversold territory, with the weekly %K at 27.6 reinforcing this. Williams%R at -83.5 on the daily suggests strong selling pressure. The pair's weakness is likely tied to a stronger U.S. dollar and potential shifts in global risk appetite. If U.S. economic data proves robust, AUD/USD could extend its decline. The key will be the 0.68000 support level.
NZD/USD is exhibiting pronounced weakness, with a strong bearish sentiment (83%) across all analyzed timeframes (1H: Sell, 4H: Sell, 1D: Sell). The pair is trading below its daily SMAs (20-day at 0.58092, 50-day at 0.59196). The daily RSI(14) at 33.1 indicates significant bearish momentum, and Stochastic %K at 12.3 on the daily, coupled with 9.0 on the weekly, points to oversold conditions and strong selling pressure. Williams%R at -98.5 on both daily and 4H charts underscores the extent of the downside. Similar to AUD/USD, a stronger USD driven by U.S. economic data will likely exacerbate the downtrend. The 0.56000 level will be a key area to watch.
Gold is showing mixed signals, with a daily sentiment leaning towards a sell (45.8 RSI) despite a stronger weekly buy signal (55.2 RSI). The 1H and 4H charts indicate a buy sentiment, while the daily chart is neutral, with the MACD histogram showing slight positive momentum (+1.78). However, the daily RSI(14) at 45.8 suggests bearish pressure is building. Stochastics are in overbought territory on the daily (83.7%K) but oversold on the weekly (26.0%K), indicating conflicting signals across timeframes. The price is currently trading below its 200-day SMA (4,781.30) but above its 20-day SMA (4,647.13). The key Fibonacci level to watch is the 38.2% retracement at 4,671.04, which is currently acting as support. A decisive break above the pivot at 4,737.62 could signal a move towards R1 at 4,813.39. Conversely, a fall below the 38.2% Fibonacci level could lead to a test of S1 at 4,682.26 and potentially lower towards the 50% Fibonacci retracement at 4,847.76.
Silver displays a mixed technical picture, with a neutral weekly sentiment (52.4 RSI) but a bearish daily sentiment (44.2 RSI). The 1H chart shows a buy signal, while 4H and 1D are neutral or sell. The daily RSI(14) at 44.2 indicates bearish momentum, and Stochastics are showing divergence, with %K at 87.5 on the daily (overbought) and 18.3 on the weekly (oversold). The price is trading below its 20-day SMA (76.386) and 50-day SMA (82.795), suggesting short-term weakness. Key support is seen around the 61.8% Fibonacci retracement at 98.430. A push above the pivot at 74.960 could target R1 at 76.200. However, a break below S1 at 73.830 could see a test of the 50% Fibonacci retracement at 91.280.
Brent Crude exhibits a strong bullish technical setup, with a high buy sentiment (94%) and positive indicators across all timeframes. The daily RSI(14) at 65.1 is in bullish territory, and Stochastics are strong, with %K at 57.8 on the daily and 85.4 on the weekly, suggesting sustained upward momentum. The price is trading well above its 20-day (102.82) and 50-day (83.78) SMAs. The recent surge in price, coupled with the bullish sentiment, indicates that upward momentum is likely to continue. Key resistance is seen at R2 (112.30) and potentially R3 (115.50). Support is found at the pivot (104.60) and S1 (100.10).
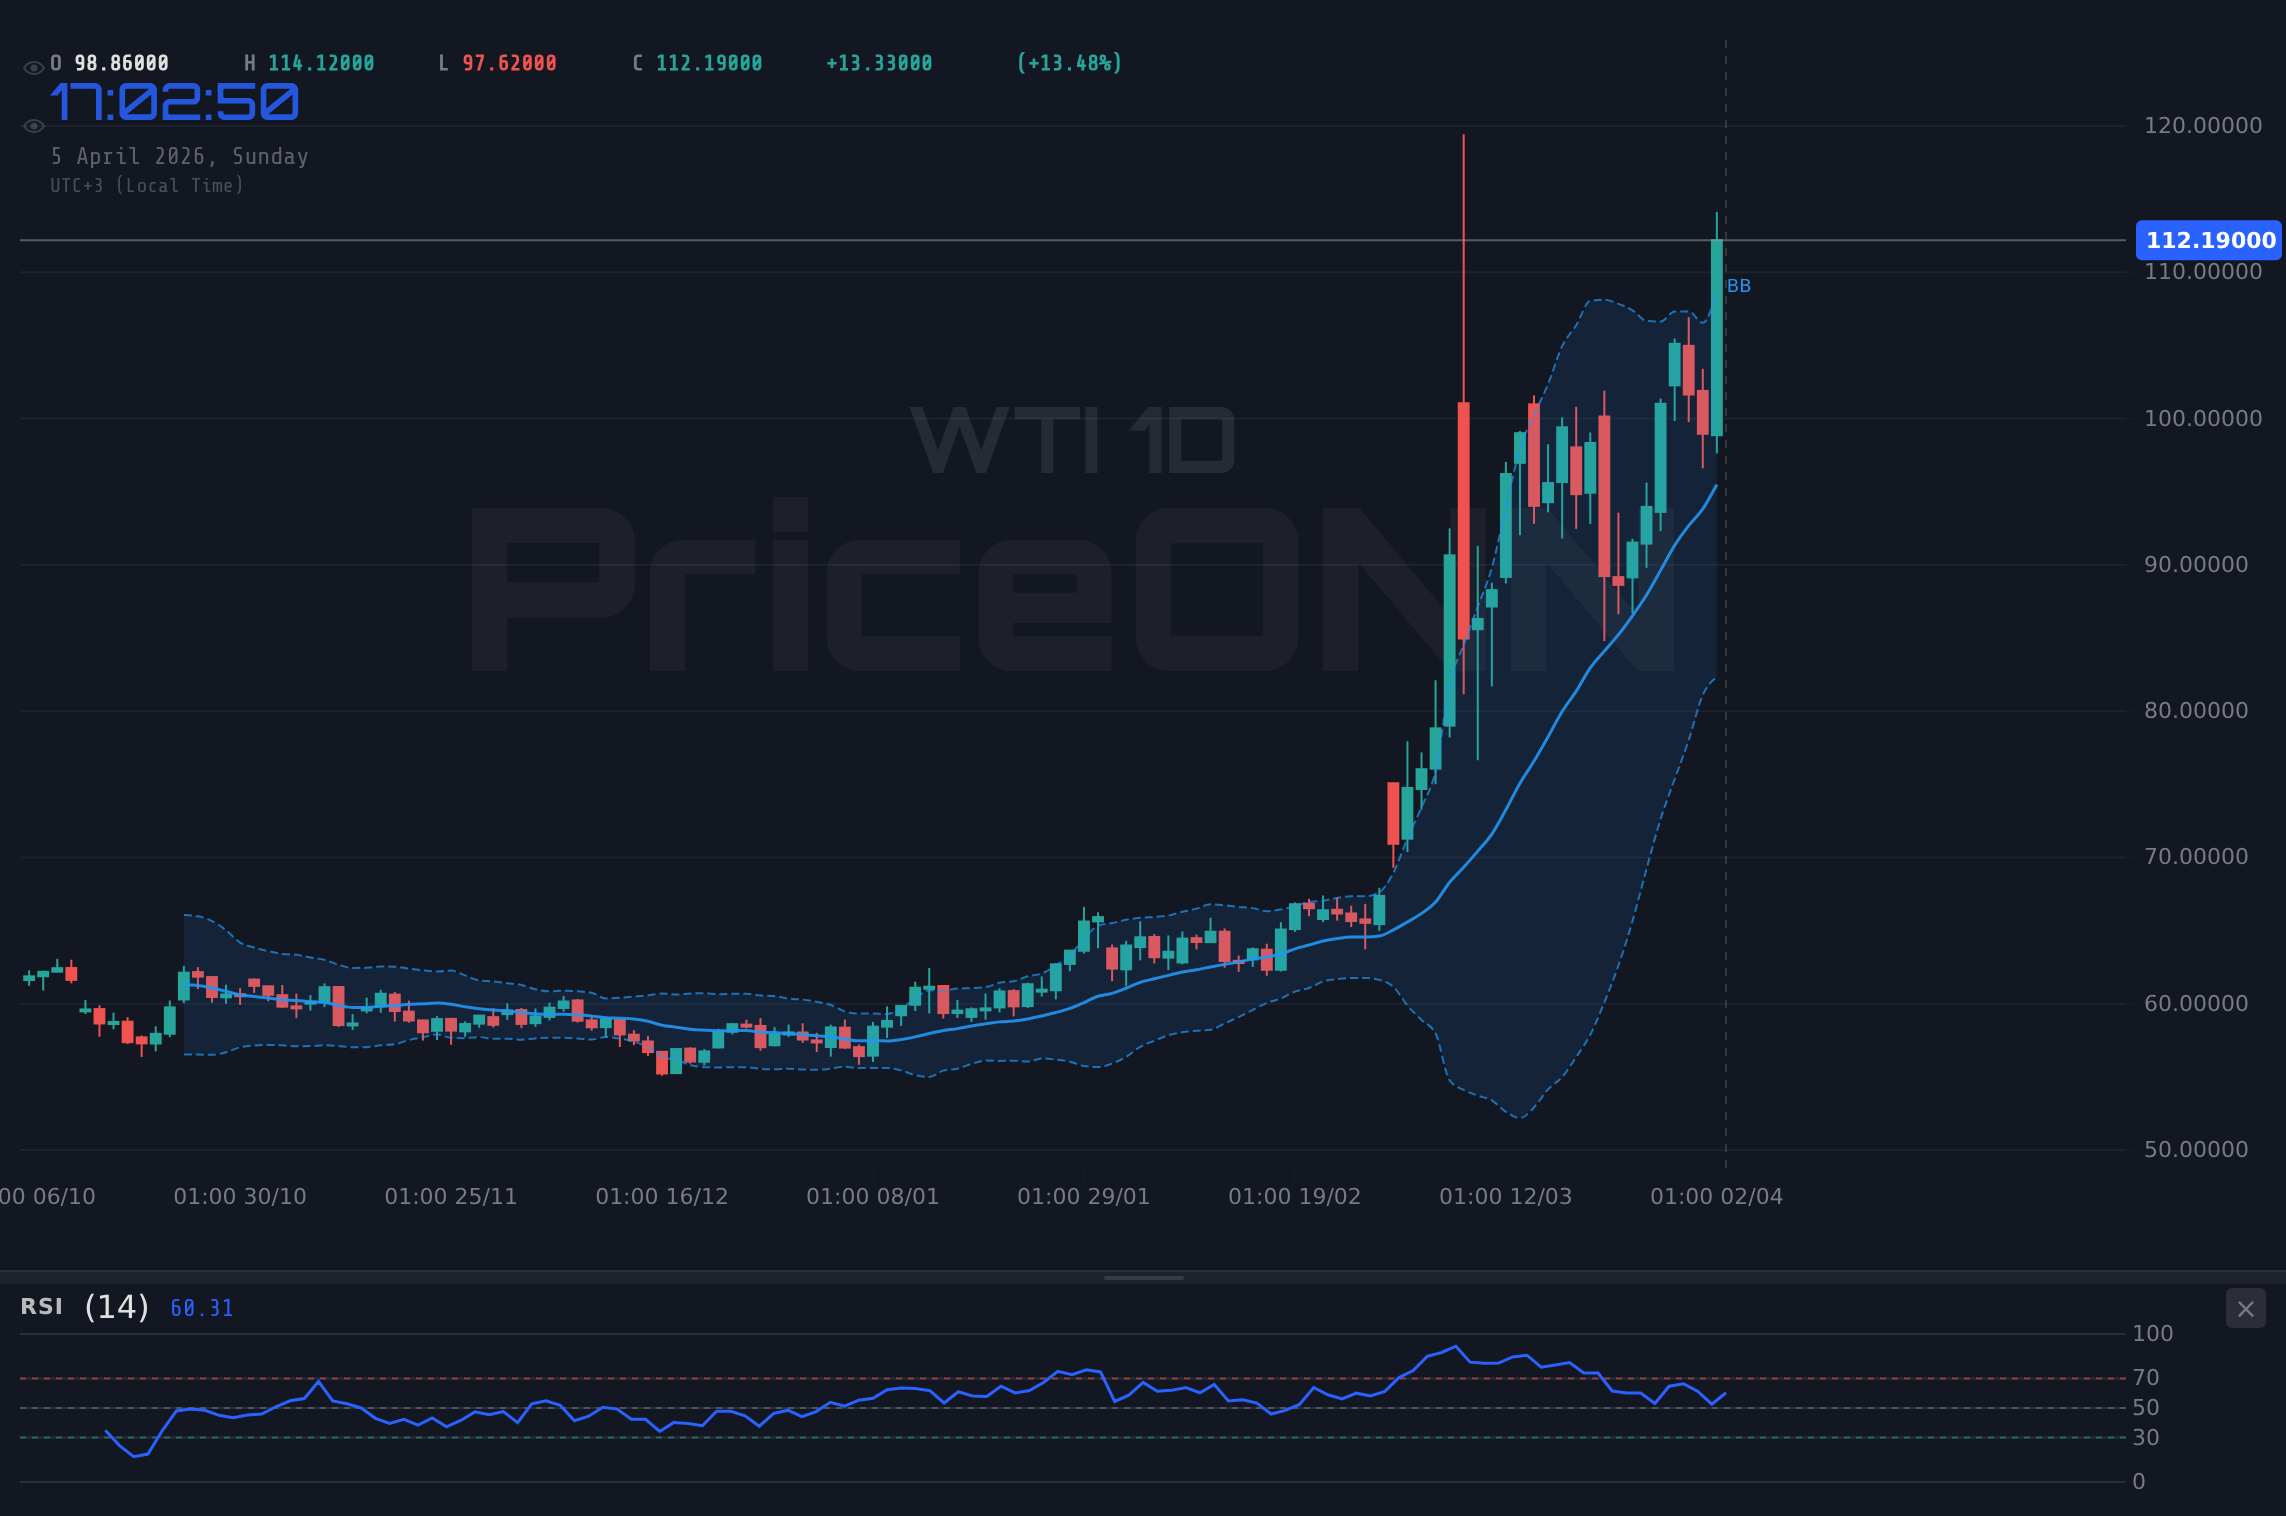
WTI Crude mirrors the bullish strength seen in Brent, displaying a strong buy sentiment (92%) and positive technical signals across all monitored timeframes. The daily RSI(14) at 70.2 is firmly in overbought territory, and Stochastics are strong (%K at 77.8 daily, 73.9 weekly), confirming the bullish trend. The price is trading significantly above its 20-day (95.49) and 50-day (77.66) SMAs. The recent sharp price increase suggests strong underlying demand, likely driven by geopolitical concerns and supply expectations. Traders will watch for any signs of consolidation near the upper Bollinger Band, but the immediate bias remains bullish. Key resistance is at R1 (102.71) and R2 (106.45), while support lies at the pivot (99.65) and S1 (95.91).
Bitcoin presents a predominantly bearish technical outlook, with a strong sell signal (88%) on the daily chart and mixed signals across shorter timeframes (1H: Sell, 4H: Sell, 1D: Sell). The daily RSI(14) at 43.5 indicates bearish momentum, and Stochastics are in neutral territory (%K at 41.5 daily, 30.5 weekly). The price is trading below its 20-day SMA (68,839) and 50-day SMA (68,701), suggesting a bearish bias. The MACD histogram on the daily chart is negative (-156.18), reinforcing the downside pressure. Key support will be tested at S1 (66,852) and S2 (66,431). A break below the 61.8% Fibonacci retracement at 70,860 could signal further downside towards the 50% Fibonacci at 69,271. The news flow regarding institutional adoption and regulatory clarity will be crucial for any potential reversal.
Ethereum mirrors Bitcoin's bearish sentiment, with a strong sell signal (91%) across all timeframes (1H: Sell, 4H: Sell, 1D: Sell). The daily RSI(14) at 46.2 suggests bearish momentum, and Stochastics are neutral to oversold (%K at 48.2 daily, 34.9 weekly). The price is trading below its 20-day SMA (2,101.18) and 50-day SMA (2,048.00), indicating a bearish trend. The MACD histogram on the daily chart is negative (-4.73). Key support levels to monitor are S1 (2,041.15) and S2 (2,021.66). A break below the 50% Fibonacci retracement at 2,089.15 would confirm further downside. The developing narrative around Ethereum's Layer 2 solutions and potential regulatory shifts will be important factors.
The S&P 500 shows a divergence in technical signals, with a bullish 1H and 4H sentiment (Buy) but a bearish daily sentiment (Sell). The daily RSI(14) at 45.4 indicates bearish momentum, and Stochastics are mixed (%K at 43.0 daily, 17.0 weekly), suggesting a potential for further downside on longer timeframes. The price is trading below its 20-day SMA (6,621) and 50-day SMA (6,788), reinforcing the short-term bearish outlook. The MACD histogram on the daily chart is negative (-6.48). Key support is identified at S1 (6,377) and S2 (6,231). The 50% Fibonacci retracement at 6,661 will be a critical level to watch. Upcoming U.S. economic data will be crucial for risk appetite.
The Nasdaq 100 exhibits a similar divergence as the S&P 500, with bullish signals on the 1H and 4H (Buy) but a bearish daily and weekly sentiment (Sell). The daily RSI(14) at 45.5 indicates bearish momentum, and Stochastics are mixed (%K at 72.1 daily, 16.1 weekly), suggesting a potential for further downward pressure on longer timeframes. The price is trading below its 20-day SMA (24,191) and 50-day SMA (24,738), reinforcing the bearish short-term outlook. The MACD histogram on the daily chart is positive (+10.00), but the weekly MACD is heavily negative (-302.66). Key support is found at S1 (23,662) and S2 (23,281). The 38.2% Fibonacci retracement at 24,094 will be a crucial level to monitor.
The Dow Jones Industrial Average presents a mixed technical picture, with a bearish daily sentiment (Sell) conflicting with bullish signals on the 4H (Buy). The daily RSI(14) at 44.2 indicates bearish momentum, and Stochastics are mixed (%K at 81.7 daily, 12.4 weekly), suggesting potential for further downside. The price is trading below its 20-day SMA (46,449) but above its 50-day SMA (48,099), indicating a complex short-to-medium term outlook. The MACD histogram on the daily chart is positive (+121.06), but the weekly MACD is heavily negative (-561.36). Key support is at S1 (45,988) and S2 (45,462). The 23.6% Fibonacci retracement at 46,153 will be a significant level to watch.
Resistance
Price
R3
47,806
R2
47,280
R1
46,897
Pivot
46,371
Support
Price
S1
45,988
S2
45,462
S3
45,079
Fib 23.6%
46,153
Economic Calendar Preview
U.S. ISM Non-Manufacturing Prices - Mon, April 6 14:00 UTC
Forecast: - | Previous: 63
Scenario
Condition
Expected Impact
Higher than previous
Actual > 63
USD strengthens as inflationary pressures are seen as persistent, potentially delaying Fed rate cuts.
In line with previous
Actual ≈ 63
Neutral reaction, focus shifts to other data points.
Lower than previous
Actual < 63
USD weakens on signs of easing inflation, increasing expectations for Fed easing.
U.S. ISM Non-Manufacturing Purchasing Manager - Mon, April 6 14:00 UTC
Forecast: - | Previous: 56.1
Scenario
Condition
Expected Impact
Higher than previous
Actual > 56.1
USD strengthens on signs of robust economic activity in the services sector.
In line with previous
Actual ≈ 56.1
Neutral reaction, market awaits more significant data.
Lower than previous
Actual < 56.1
USD weakens on concerns about slowing economic growth.
U.S. Core PCE Price Index MoM - Thu, April 9 12:30 UTC
Forecast: 0.4% | Previous: 0.4%
Scenario
Condition
Expected Impact
Better than expected
Actual > 0.4%
USD strengthens, potentially leading to a hawkish repricing of Fed policy expectations.
In line with forecast
Actual ≈ 0.4%
Neutral reaction, reinforcing current market expectations for Fed policy.
Worse than expected
Actual < 0.4%
USD weakens, increasing expectations for a sooner Fed rate cut.
U.S. Core PCE Price Index YoY - Thu, April 9 12:30 UTC
Forecast: 3.1% | Previous: 3.1%
Scenario
Condition
Expected Impact
Better than expected
Actual > 3.1%
USD strengthens, signaling persistent inflation and potentially a more hawkish Fed stance.
In line with forecast
Actual ≈ 3.1%
Neutral reaction, maintaining current market sentiment around Fed policy.
Worse than expected
Actual < 3.1%
USD weakens, suggesting inflation is cooling and potentially paving the way for earlier Fed rate cuts.
U.S. Gross Domestic Product (GDP) QoQ - Thu, April 9 12:30 UTC
Forecast: 0.7% | Previous: 0.7%
Scenario
Condition
Expected Impact
Better than expected
Actual > 0.7%
USD strengthens on confirmation of robust economic growth, potentially supporting a less accommodative Fed.
In line with forecast
Actual ≈ 0.7%
Neutral reaction, aligning with existing economic growth expectations.
Worse than expected
Actual < 0.7%
USD weakens on signs of economic slowdown, potentially increasing dovish sentiment from the Fed.
Weekly Trading Bias
The upcoming week is dominated by U.S. inflation data, making the U.S. Dollar the primary focus. A 'risk-off' sentiment may prevail if inflation surprises to the upside, benefiting the USD against most majors (EUR, GBP, AUD, NZD) and potentially weighing on riskier assets like cryptocurrencies and even stock indices. Energy markets are expected to remain strong due to ongoing geopolitical tensions and supply concerns. Gold and Silver will be sensitive to USD movements and bond yields, with key Fibonacci levels acting as critical support/resistance zones. The overall risk appetite will be closely tied to the outcome of the U.S. PCE data.
Disclaimer: This content is for informational and educational purposes only and does not constitute investment advice, financial recommendation, or an offer to buy or sell any financial instrument. Past performance does not guarantee future results. Always do your own research and consult a licensed financial advisor before making investment decisions.
Track markets in real-time
AI-powered analysis, technical indicators and real-time price data.
We are looking for writers who produce market analysis, macro commentary, and data-driven content. Reach readers in 10 languages through our multilingual publishing platform.