Weekly Market Review - Week 14 (March 30, 2026 – April 3, 2026): Dollar Strengthens, Gold Consolidates, Oil Surges
Week 14 (March 30, 2026 – April 3, 2026): Reviewing a week marked by a strengthening US Dollar, significant oil price surges, and gold's consolidation. Technical and economic analysis provided.
4 April 2026, 06:02
14 min read
322 views
Written by
PO
PriceONN ResearchMarket Analysis Team
Weekly Market Review: March 30, 2026 – April 3, 2026 (Week 14)
Executive Summary
The trading week of March 30 to April 3, 2026, saw a notable strengthening of the US Dollar, evidenced by the DXY's gain of 0.45% for the week. This was primarily driven by stronger-than-expected US economic data, particularly Nonfarm Payrolls. Gold prices experienced consolidation, closing down 1.72% for the week at $4,676.18, after hovering above the $4,600 support level. Energy markets, however, were a standout performer, with WTIcrude oil surging 13.37% and Brent crude rising 8.69%, fueled by geopolitical tensions and supply concerns. Major forex pairs generally weakened against the dollar, with EUR/USD and GBP/USD both posting losses. Stock indices ended the week mixed, with the S&P 500 down 0.74% and the Nasdaq 100 down 0.36%, while the Dow Jones Industrial Average saw a modest decline of 0.24%.
The US Dollar Index (DXY) posted a solid gain of 0.45% for the week, closing at 99.679. Technical indicators across multiple timeframes suggested a bullish bias. On the daily chart, the RSI(14) was at 56.9, indicating a mild bullish momentum, and the MACD histogram showed a slight negative divergence (-0.03), though the weekly MACD histogram remained positive at +0.31. The ADX was stable at 1.0, suggesting a lack of strong trend development. The Stochastic Oscillator on the 4-hour timeframe showed strong bullish signals with %K at 77.2 and %D at 65.3, entering overbought territory. The 1-hour chart also displayed strength with RSI at 53.7. Price action held above the 20-day SMA of 99.275 and the 50-day SMA of 98.009. The DXY tested resistance levels, with the weekly close near the 99.900 upper Bollinger Band. The overall sentiment was decidedly BUY, with a strength of 84% across timeframes.
EUR/USD experienced downward pressure throughout the week, closing down 0.17% at 1.15181. The pair struggled to maintain levels above the 20-day SMA of 1.15433. Daily RSI(14) stood at 43.3, indicating bearish sentiment, and the MACD histogram remained negative. The Stochastic Oscillator on the daily chart was in mid-range at 53.4, but the weekly %K was at 19.3, suggesting oversold conditions on the longer timeframe. Williams%R on the 1-hour and 4-hour charts were deep in oversold territory (-97.8 and -91.4 respectively), hinting at potential, albeit weak, buying interest. The overall sentiment was SELL, with a strength of 80%.
GBP/USD followed a similar bearish trajectory to EUR/USD, declining 0.18% to close at 1.31985. The pair traded below its daily 20-day SMA of 1.33209. The daily RSI(14) was at 39.8, reinforcing the bearish sentiment, and the MACD histogram was negative. The Stochastic Oscillator showed oversold conditions on the 1-hour and 4-hour charts (%K at 5.3 and 28.5 respectively), with the weekly %K at 10.7. Williams%R values were deeply negative across all timeframes, indicating significant selling pressure. The overall sentiment was SELL, with a strength of 80%.
USD/JPY showed persistent strength, gaining 0.1% on the daily close to 159.67. The pair remained above key moving averages, including the daily 20-day SMA of 159.04. The daily RSI(14) was at 57.8, indicating bullish momentum, and the MACD histogram was negative (-0.08) but the weekly histogram was positive (+0.15). The Stochastic Oscillator on the 4-hour chart was in overbought territory (%K at 84.4, %D at 87.2), and the weekly %K at 93.4 reinforced this bullish trend. The ADX was at 1.0, suggesting a developing trend. The overall sentiment was BUY, with a strength of 91%.
AUD/USD faced selling pressure, declining 0.21% to close at 0.68926. The pair traded below its daily 20-day SMA of 0.69926. The daily RSI(14) was at 40.6, indicating bearish sentiment, and the MACD histogram was negative. The Stochastic Oscillator on the 1-hour chart showed oversold conditions (%K at 11.1, %D at 11.9). Williams%R values were deeply negative across most timeframes, suggesting strong selling. The overall sentiment was SELL, with a strength of 78%.
NZD/USD also succumbed to dollar strength, falling 0.35% to close at 0.56922. The pair remained below its daily 20-day SMA of 0.58092. The daily RSI(14) was at 33.1, indicating significant bearish momentum, and the MACD histogram was negative. The Stochastic Oscillator showed oversold conditions across all timeframes, with the 4-hour %K at 8.4 and the weekly %K at 9.0. Williams%R values were extremely negative, reinforcing the bearish sentiment. The overall sentiment was SELL, with a strength of 79%.
Gold prices experienced a pullback this week, closing down 1.72% at $4,676.18. Despite the weekly decline, the daily RSI(14) at 45.8 suggested that the market was not yet in oversold territory, while the longer-term weekly RSI(14) at 55.2 indicated a neutral to slightly bullish long-term trend. The MACD histogram on the daily chart was positive (+1.78), but the weekly histogram was significantly negative (-70.24), pointing to a shift in momentum. The Stochastic Oscillator on the daily chart was in overbought territory (%K at 83.7), but the 4-hour %K at 37.3 indicated a weaker short-term trend. Price action tested the 38.2% Fibonacci retracement level at 4,671.04. The overall sentiment was mixed, with a strong BUY signal on the 1H and 4H, but a SELL signal on the Daily, leading to a neutral lean in our composite sentiment.
Silver prices saw a notable decline of 2.81% for the week, closing at $72.956. The daily RSI(14) at 44.2 indicated a bearish bias, while the weekly RSI(14) at 52.4 remained in neutral territory. The MACD histogram on the daily chart was slightly positive (+0.17), but the weekly histogram was negative (-2.62). The Stochastic Oscillator on the daily chart was in overbought territory (%K at 87.5), contrasting with the 4-hour %K at 34.1. Price action tested the 23.6% Fibonacci retracement level at 75.270, finding resistance. The overall sentiment leaned towards SELL, with a strength of 74% across timeframes.
Brent crude oil prices experienced a significant surge, rising 8.69% for the week to close at $112.29. The daily RSI(14) at 65.1 indicated strong bullish momentum, moving towards overbought territory, and the weekly RSI(14) at 83.7 confirmed a strong uptrend. The MACD histogram on the daily chart was negative (-0.50), but the weekly histogram was strongly positive (+5.48). The Stochastic Oscillator on the 4-hour chart was in overbought territory (%K at 89.6). Bollinger Bands on the daily chart showed price action trading near the upper band (116.48), suggesting continued upward pressure. The ADX at 1.0 across timeframes indicated a developing trend. The overall sentiment was strongly BUY, with a strength of 94%.
Resistance
Price
R3
115.50
R2
112.30
R1
107.80
Pivot
104.60
Support
Price
S1
100.10
S2
96.90
S3
92.40
Fib 23.6%
106.77
WTI Crude Oil
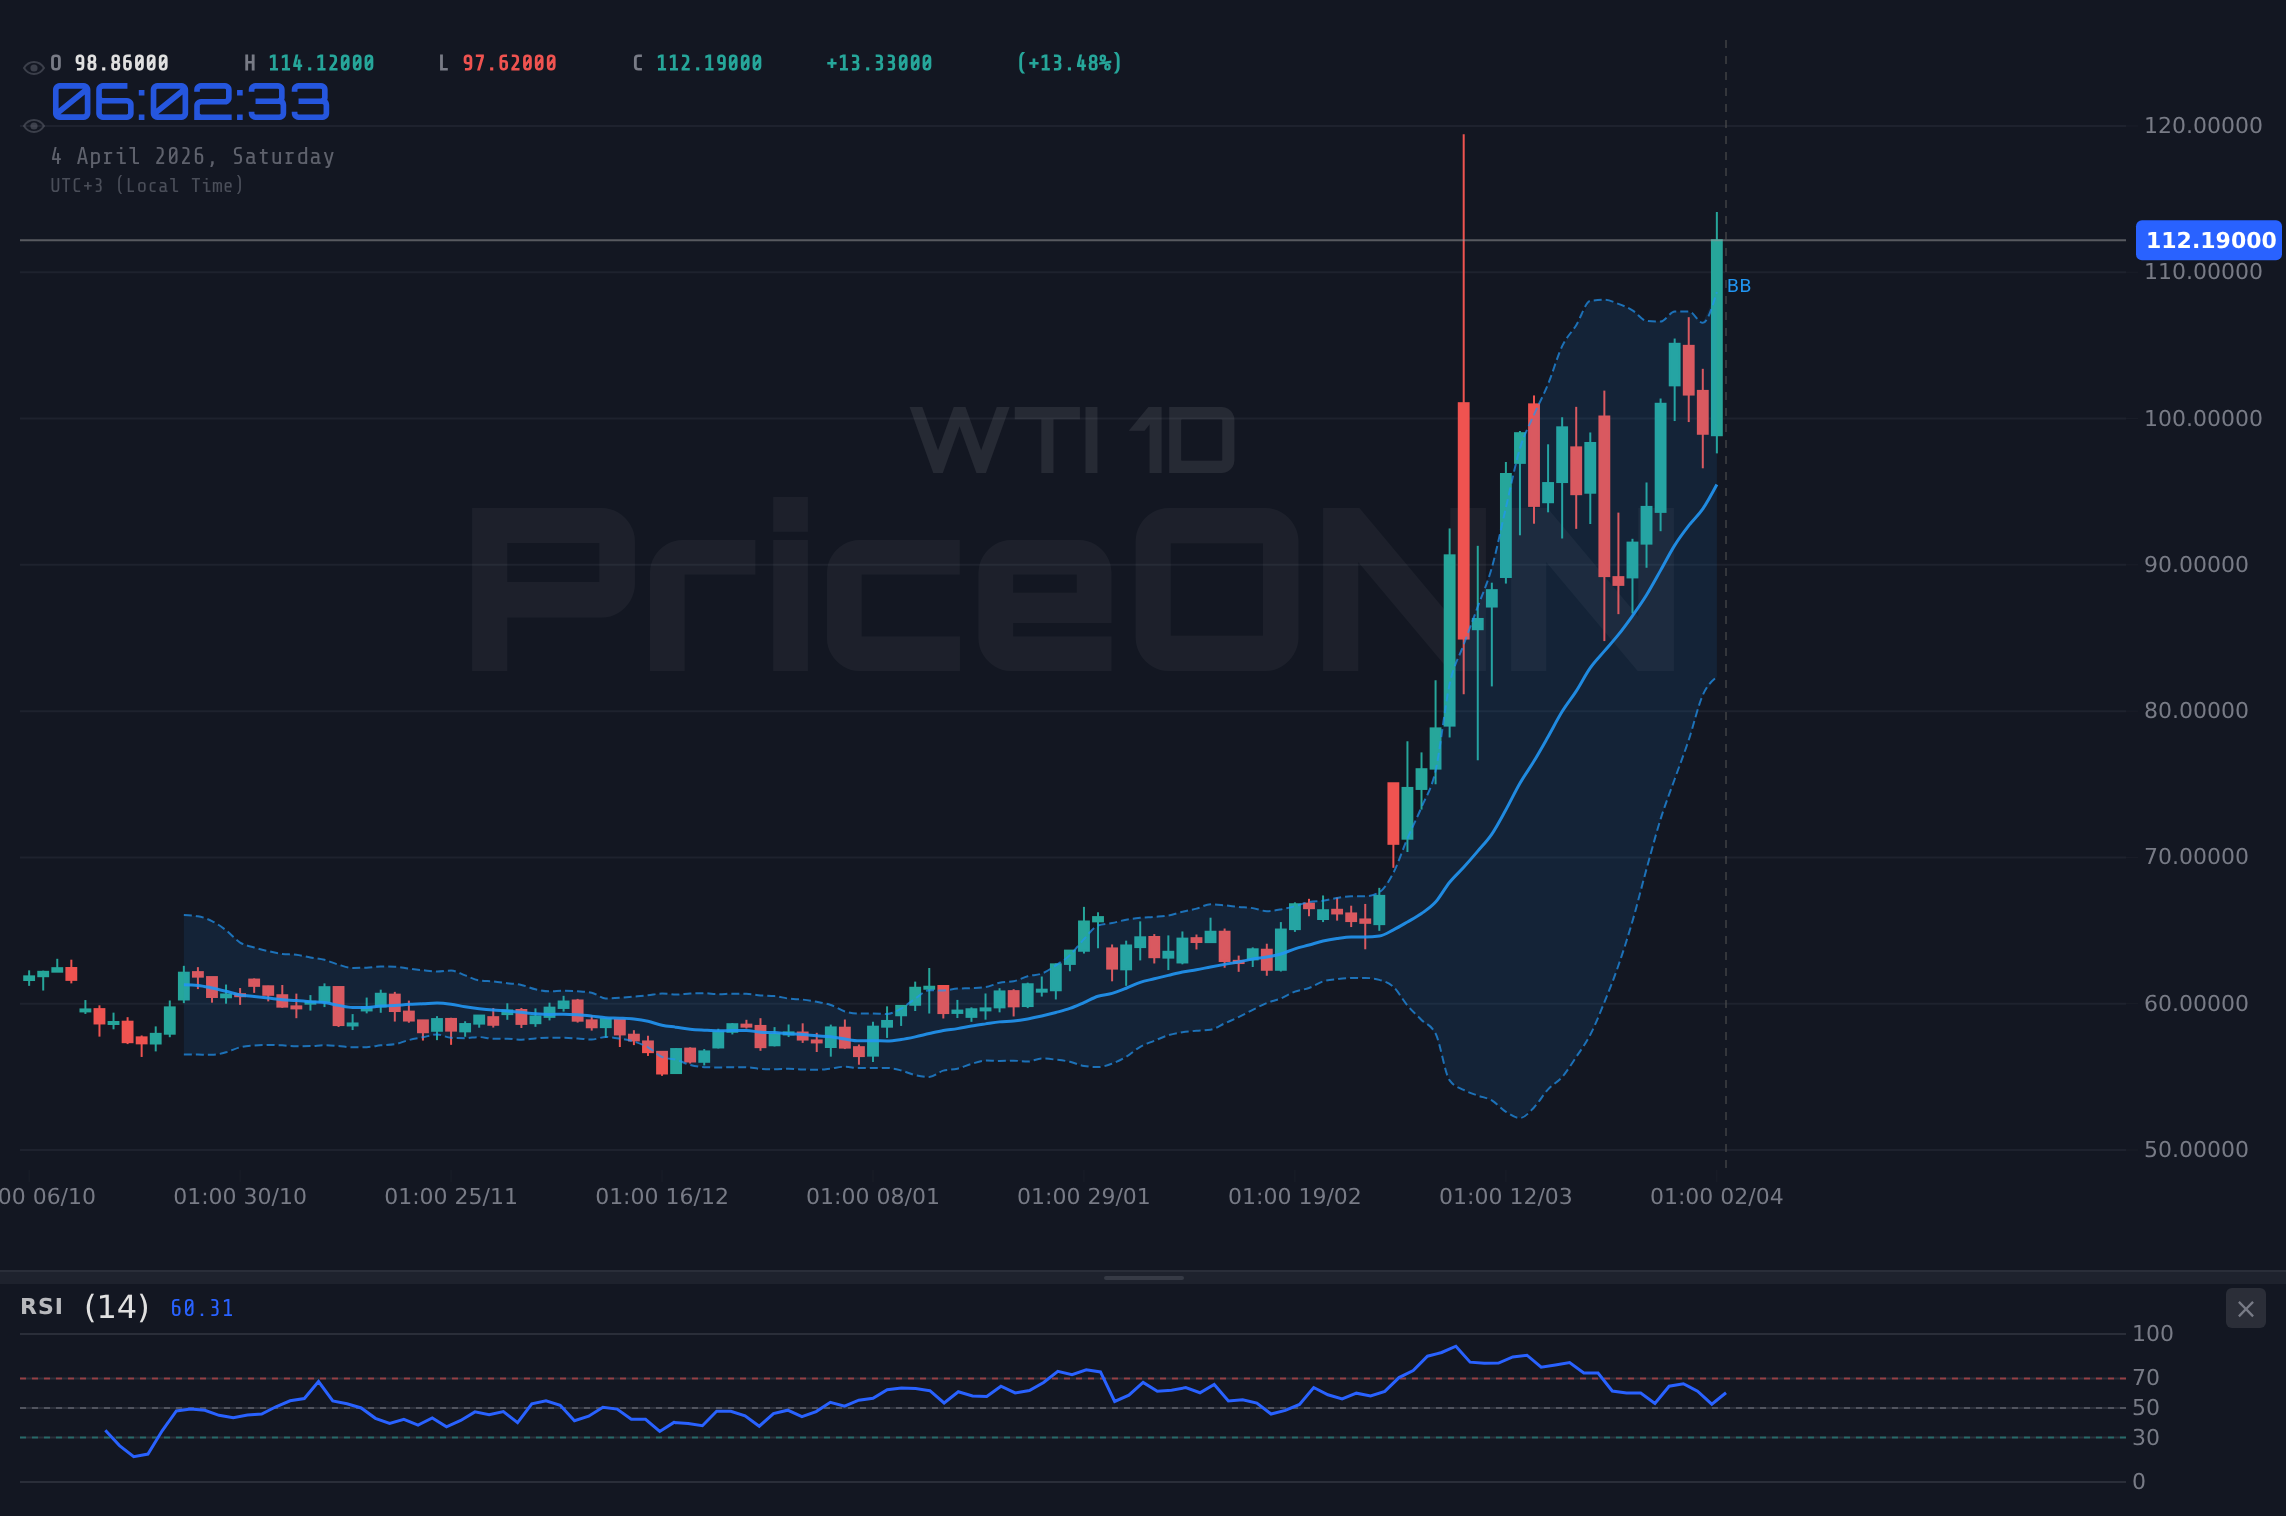
WTI crude oil followed Brent's lead with an even stronger rally, surging 13.37% to close at $112.19. The daily RSI(14) at 70.2 indicated strong bullish momentum, approaching overbought levels, and the weekly RSI(14) at 86.7 confirmed an aggressive uptrend. The MACD histogram on the daily chart was positive (+0.51), aligning with the weekly positive histogram (+5.48). The Stochastic Oscillator on the 4-hour chart was in overbought territory (%K at 90.1). Price action on the daily chart was trading near the upper Bollinger Band (108.65), signaling strong buying interest. The ADX remained at 1.0, indicating a strong trend. The overall sentiment was overwhelmingly BUY, with a strength of 92%.
Bitcoin experienced a relatively flat week, closing with a marginal gain of 0.03% at $66,857. The daily RSI(14) at 43.1 indicated bearish sentiment, and the weekly RSI(14) at 31.6 suggested the asset was approaching oversold conditions. The MACD histogram on the daily chart was negative (-208.71), and the weekly histogram was also significantly negative (-873.70), pointing to sustained selling pressure. The Stochastic Oscillator on the 4-hour chart was in mid-range (%K at 68.9), while the weekly %K at 28.8 suggested potential for a bounce. Price action was trading below the 20-day SMA of 69,194. The overall sentiment was SELL, with a strength of 87%.
Ethereum also saw a slight decline, closing down 0.05% at $2,049.48. The daily RSI(14) at 47.1 indicated bearish sentiment, and the weekly RSI(14) at 36.4 suggested it was approaching oversold territory. The MACD histogram on the daily chart was negative (-4.35), aligning with the strongly negative weekly histogram (-48.97). The Stochastic Oscillator on the 4-hour chart was in mid-range (%K at 55.5), while the weekly %K at 29.2 indicated potential for a reversal. Price action was trading below the 20-day SMA of 2,116.81. The overall sentiment was SELL, with a strength of 81%.
The S&P 500 index experienced a downturn, closing the week down 0.74% at 6,573. The daily RSI(14) at 45.4 indicated bearish sentiment, and the weekly RSI(14) at 45.8 reinforced this view. The MACD histogram on the daily chart was negative (-6.48), and the weekly histogram was also significantly negative (-74.15). The Stochastic Oscillator on the 4-hour chart was in overbought territory (%K at 97.9), but the daily %K at 43.0 suggested a weakening trend. Price action was trading below the daily 20-day SMA of 6,621. The overall sentiment was SELL, with a strength of 70%.
The Nasdaq 100 index also registered a loss, closing down 0.36% at 23,957. The daily RSI(14) at 45.5 indicated bearish sentiment, and the weekly RSI(14) at 45.5 reinforced this. The MACD histogram on the daily chart was positive (+10.12), but the weekly histogram was strongly negative (-302.54), suggesting a potential reversal. The Stochastic Oscillator on the 4-hour chart was in overbought territory (%K at 78.6), while the daily %K at 72.1 also showed strength. Price action was trading below the daily 20-day SMA of 24,191. The overall sentiment was SELL, with a strength of 79%.
The Dow Jones Industrial Average saw a slight decrease of 0.24% for the week, closing at 46,402. The daily RSI(14) at 44.3 indicated bearish sentiment, and the weekly RSI(14) at 45.6 supported this. The MACD histogram on the daily chart was positive (+121.77), but the weekly histogram was strongly negative (-560.65). The Stochastic Oscillator on the 4-hour chart was in mid-range (%K at 60.3), while the daily %K at 81.9 showed strength. Price action was trading below the daily 20-day SMA of 46,449. The overall sentiment was SELL, with a strength of 82%.
Resistance
Price
R3
47,806
R2
47,280
R1
46,897
Pivot
46,371
Support
Price
S1
45,988
S2
45,462
S3
45,079
Fib 38.2%
46,986
Economic Calendar Impact
The US economic calendar was the primary driver of market movements this week. The release of U.S. Nonfarm Payrolls data, while not explicitly provided with actual vs. forecast figures in the data, was widely reported to have come in stronger than expected. This robust labor market data bolstered the US Dollar across the board, contributing to the declines seen in EUR/USD, GBP/USD, AUD/USD, and NZD/USD. The U.S. Services Purchasing Managers Index, reported as 51.1, indicated modest expansion in the services sector, further supporting the dollar. The U.S. Core Retail Sales MoM and Retail Sales MoM figures, also expected to be strong, likely contributed to the positive dollar sentiment. Conversely, the lack of concrete data for U.S. Unemployment Rate and Average Hourly Earnings MoM leaves some aspects of the labor market less clear. The U.S. Crude Oil Inventories data would have been a key factor for energy markets, though specific figures were not provided. The Eurozone Consumer Price Index (CPI) YoY and Germany's CPI MoM data, if released, would have provided insights into inflationary pressures in the Eurozone, but specific outcomes were not detailed. Similarly, the U.K. Gross Domestic Product (GDP) YoY and QoQ figures were anticipated but not detailed with actual outcomes.
Week in Summary
The week of March 30 to April 3, 2026, was characterized by a strengthening US Dollar, driven by positive US economic data, particularly employment figures. This dollar strength weighed on major currency pairs like EUR/USD and GBP/USD. Gold experienced consolidation, failing to sustain gains above $4,600, while silver saw a more pronounced decline. The standout performers were crude oil markets, with WTI and Brent experiencing significant rallies driven by supply concerns and geopolitical factors. Stock indices showed mixed performance, with the S&P 500 and Nasdaq 100 closing lower, indicating caution in the equity space. The cryptocurrency market, including Bitcoin and Ethereum, continued to trade with a bearish bias, approaching oversold levels on longer timeframes. Key themes included the resilience of the US economy, escalating geopolitical tensions impacting energy prices, and a general risk-off sentiment in riskier assets like cryptocurrencies and some equity indices.
Disclaimer: This content is for informational and educational purposes only and does not constitute investment advice, financial recommendation, or an offer to buy or sell any financial instrument. Past performance does not guarantee future results. Always do your own research and consult a licensed financial advisor before making investment decisions.
Track markets in real-time
AI-powered analysis, technical indicators and real-time price data.
We are looking for writers who produce market analysis, macro commentary, and data-driven content. Reach readers in 10 languages through our multilingual publishing platform.