XAGUSD в настоящее время торгуется по цене $80.60, отражая снижение на 3.2% на рынке. Это падение примечательно, поскольку мы анализируем технические индикаторы и ключевые уровни, которые могут повлиять на торговые стратегии.
Текущие ценовые движения указывают на критический момент для серебра, с значительными уровнями поддержки и сопротивления, за которыми стоит внимательно наблюдать.
Технический анализ XAGUSD
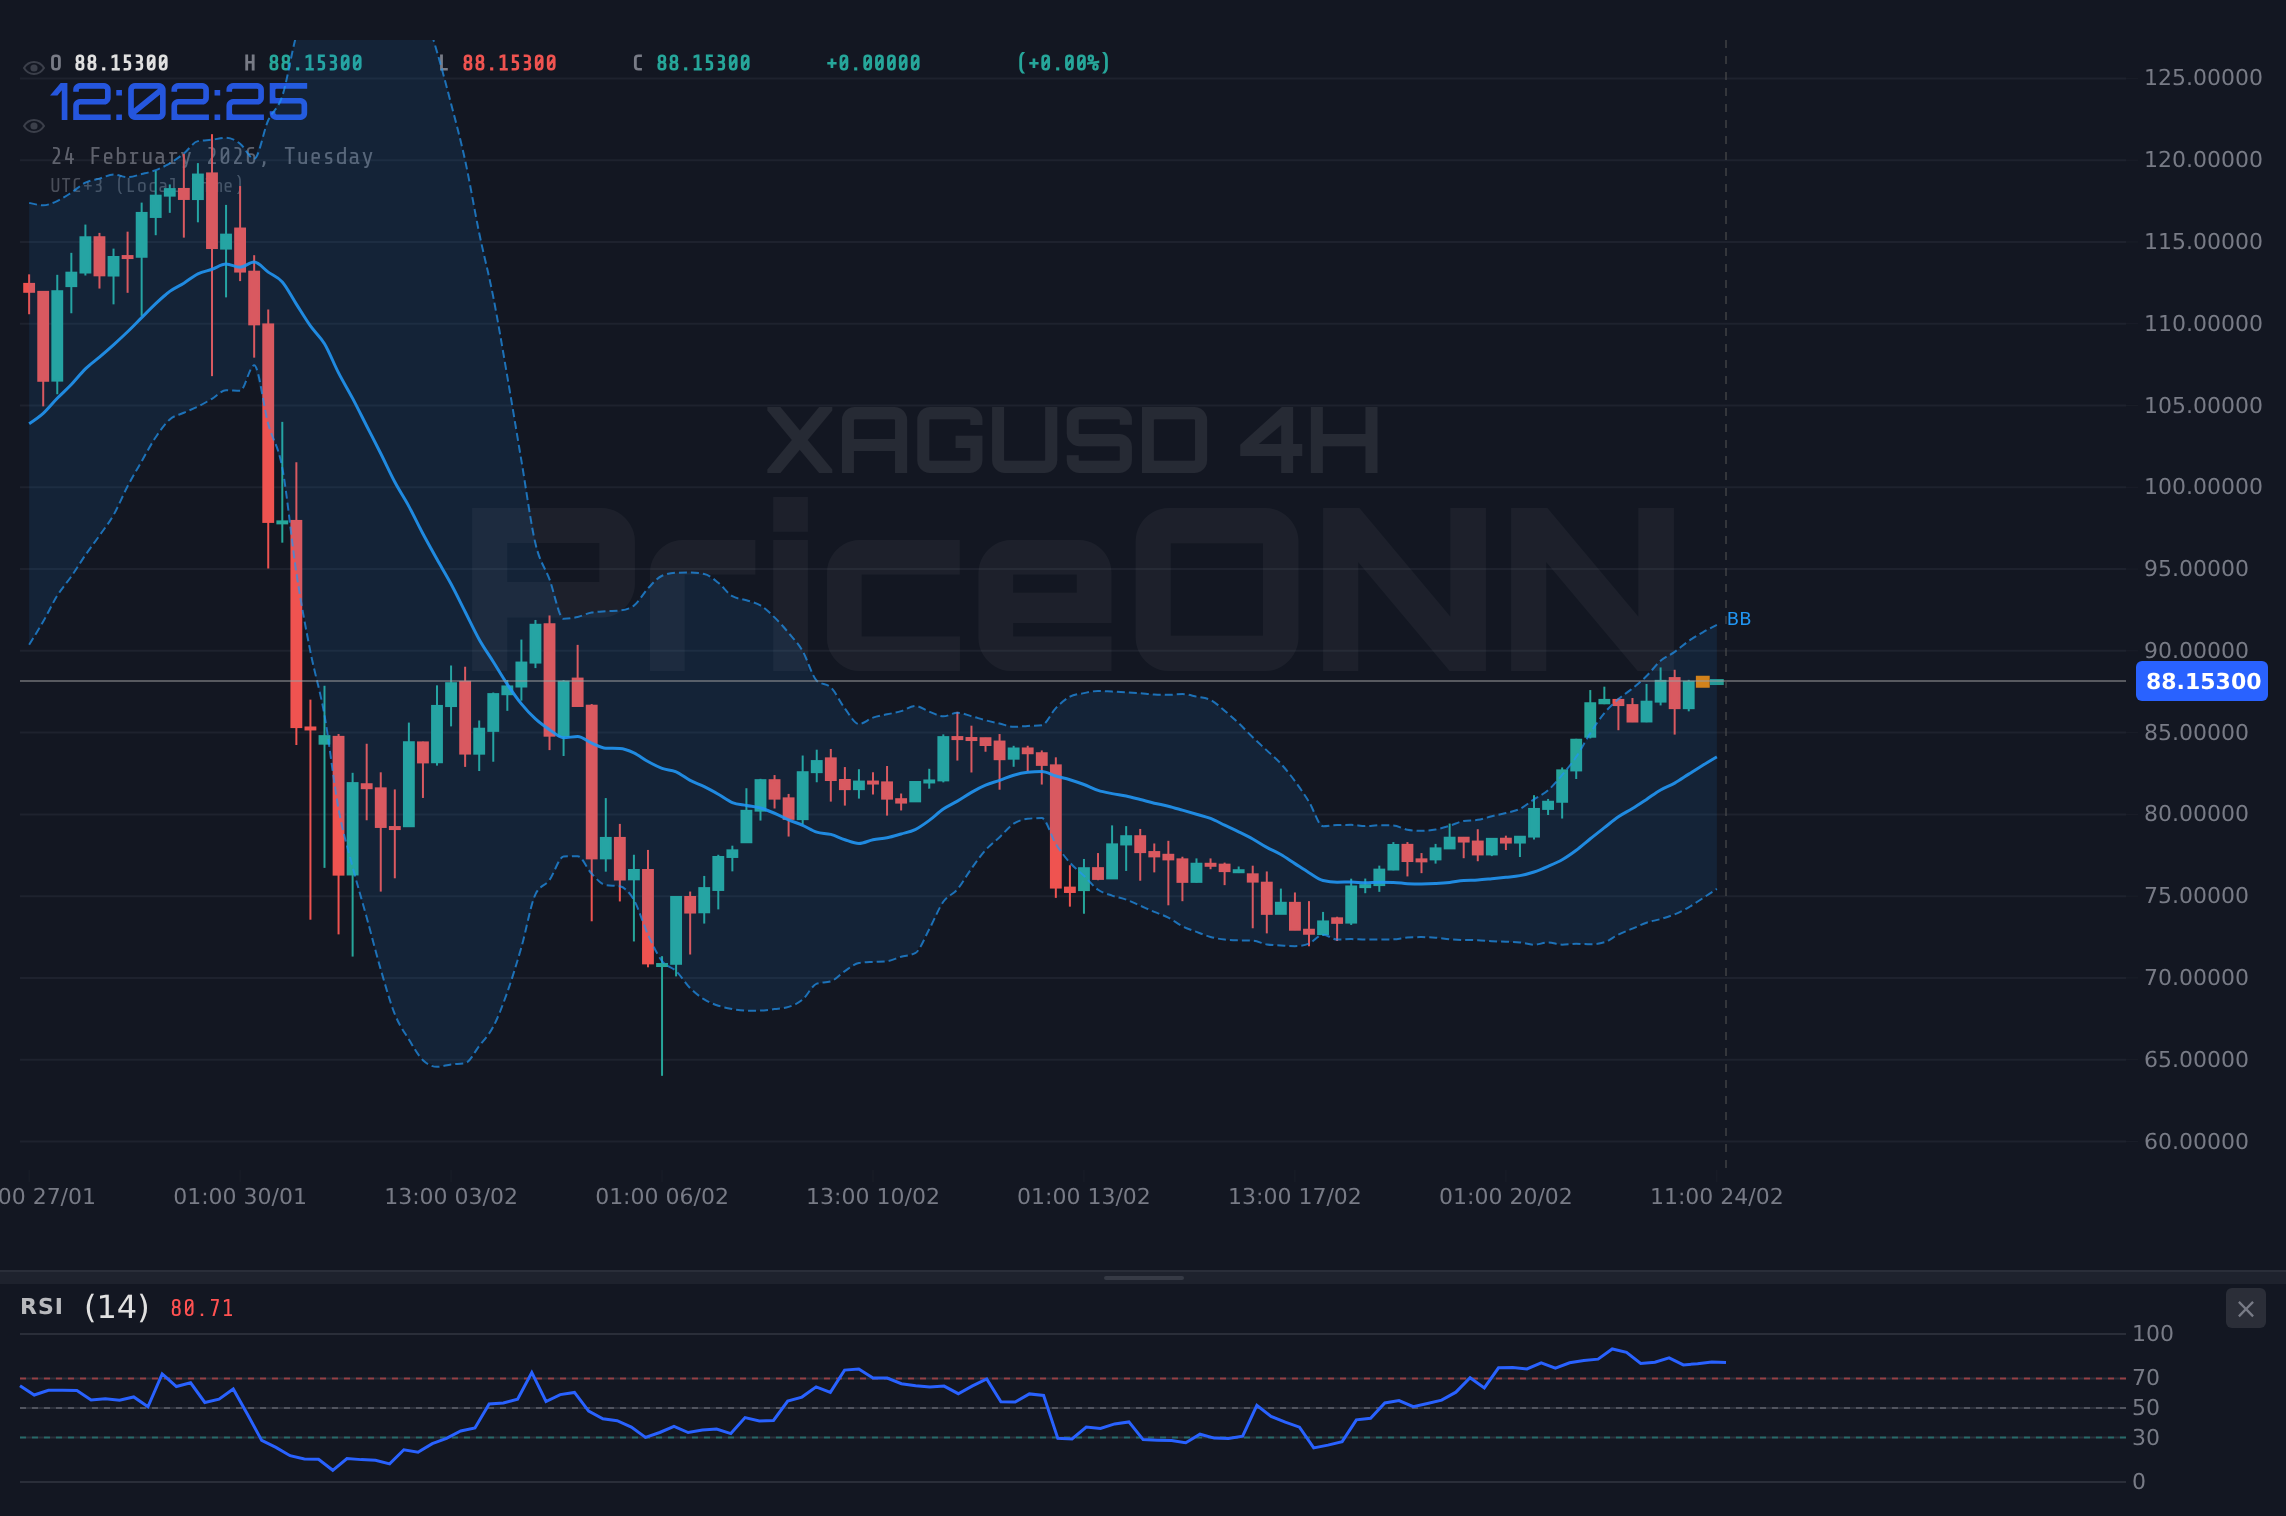
Недавняя динамика XAGUSD показывает нисходящий тренд, в настоящее время торгуется по цене $80.60. Дневной диапазон торгов составлял от $79.93 до $84.00. Это значительное падение можно отнести к различным рыночным факторам, включая колебания DXY и изменения в настроениях инвесторов.
Рыночные влияния
DXY рос, негативно влияя на цены серебра. Когда DXY увеличивается, это оказывает давление на драгметаллы, включая серебро. Кроме того, геополитические напряженности и опасения по поводу инфляции продолжают формировать рыночный ландшафт.
Будьте осторожны с потенциальными ложными пробоями, так как серебро приближается к критическим уровням поддержки.
Советы для инвесторов
Рассмотрите возможность постепенного увеличения позиций, когда XAGUSD приближается к поддержке, следя за потенциальными бычьими разворотами.
Длинные позиции могут быть привлекательными, если цены стабилизируются выше $80.43, первого уровня поддержки.
Карты торговых сценариев
Торговый план
Сценарий A: Продолжение нисходящего тренда
- Направление: Шорт
- Триггер: Закрытие ниже $80.43 на H4 графике
- Цель 1: $79.90 (~70 пунктов)
- Цель 2: $79.50 (~110 пунктов)
- Стоп/Аннулирование: Закрытие выше $81.53
Сценарий B: Бычий разворот
- Условие: Поддержка на $80.43 держится + дивергенция RSI
- Триггер: Закрытие выше $81.53 на H4 графике + увеличение объема
- Цель: $82.00
- Аннулирование: Закрытие ниже $80.00
Техническое резюме
| Индикатор | Значение | Сигнал | Интерпретация |
|---|---|---|---|
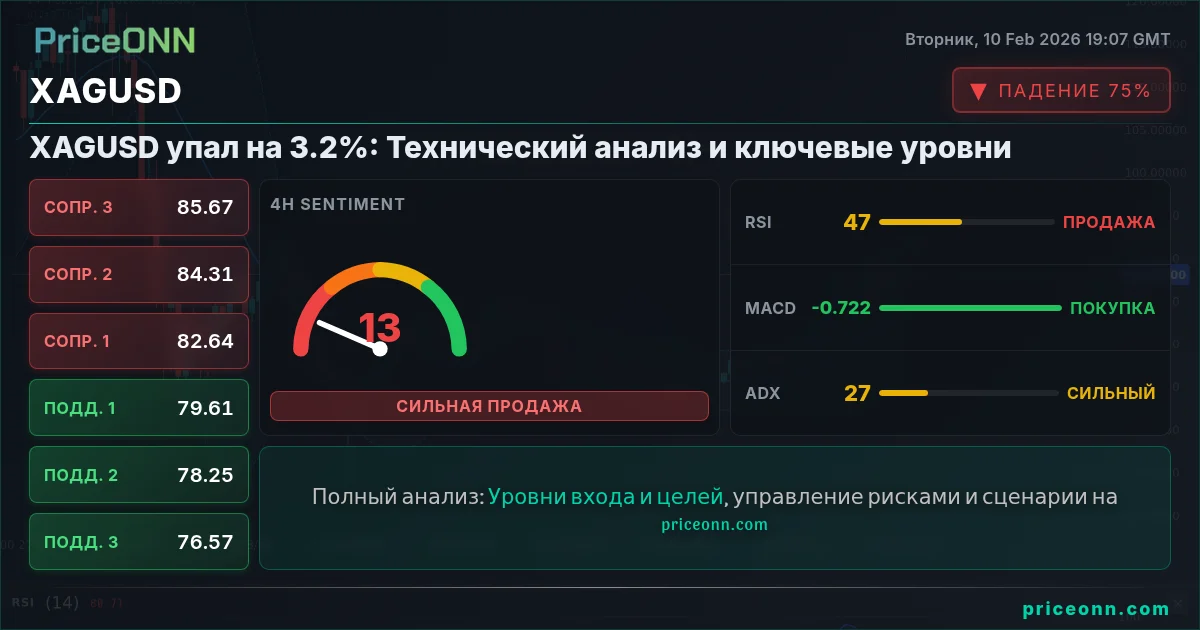
| RSI (14) | 44.5 | Нейтральный | Указывает на потенциальный разворот |
| MACD | -0.12 | Медвежий | Ниже сигнальной линии |
| ADX | 10.61 | Слабый тренд | Указывает на отсутствие силы тренда |
Уровни поддержки и сопротивления
В заключение, текущая торговая модель XAGUSD указывает на то, что трейдерам следует внимательно следить за уровнями поддержки и сопротивления, изложенными выше. С правильной стратегией и управлением рисками даже в сложных рыночных условиях могут возникнуть возможности.
Отслеживайте рынки в реальном времени
ИИ-анализ и данные в реальном времени.