

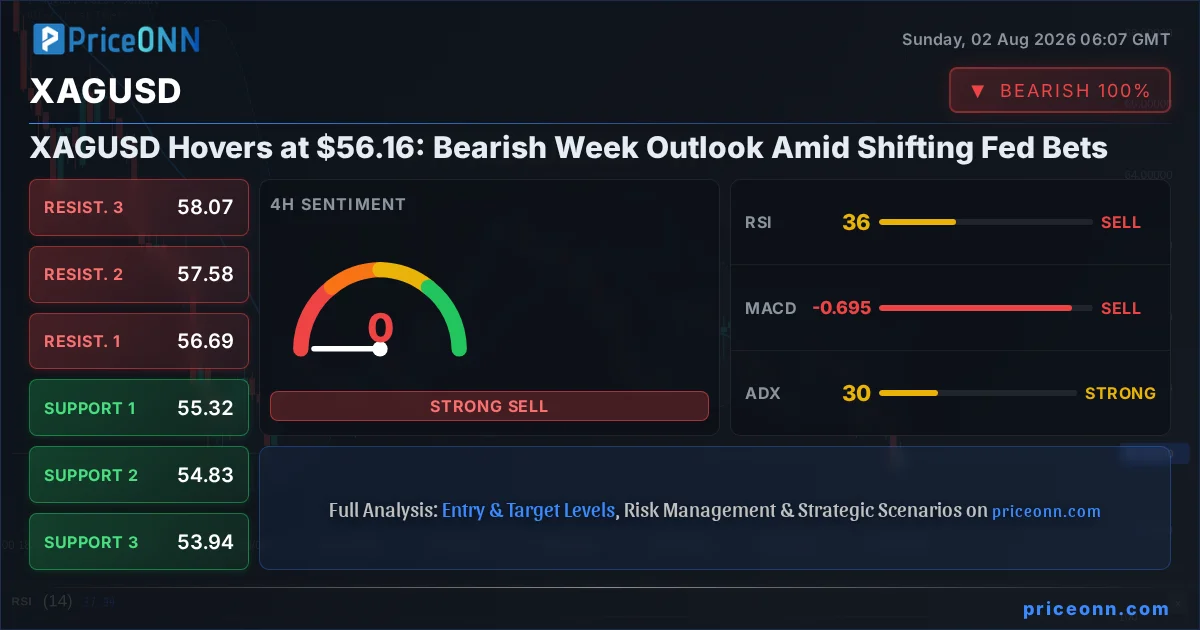
The narrative surrounding silver (XAGUSD) has taken a distinctly bearish turn as the week unfolds, with the precious metal consolidating around the critical $56.16 mark. While a weaker U.S. Dollar typically provides a tailwind for silver, the current market dynamics suggest a more complex interplay of factors. The fading expectations of aggressive Federal Reserve rate hikes, coupled with a surprising resilience in the dollar index (DXY) itself, are creating a challenging environment for bulls. This analysis delves into the technical underpinnings and macroeconomic signals shaping XAGUSD's immediate future, exploring whether the current price action represents a pause before further declines or a consolidation phase before a potential recovery.
- RSI at 37.11 on the 1H chart signals bearish momentum, indicating potential for further downside pressure.
- Key support sits at $55.32 on the 4H timeframe, a level that, if broken, could trigger significant selling.
- MACD histogram on multiple timeframes shows negative momentum, suggesting bears are currently in control of XAGUSD.
- The correlation with DXY at 100.7 is crucial; a strengthening dollar typically weighs on silver prices.
Navigating the Crosscurrents: Dollar Strength and Fading Fed Hopes
The past week has presented a mixed bag for financial markets, but for silver (XAGUSD), the dominant theme has been bearish pressure, leaving the metal teetering around $56.16. This price point is more than just a number; it represents a crucial juncture where the interplay of global economic forces is being tested. The U.S. Dollar Index (DXY), currently observing levels around 100.7, has shown remarkable resilience, acting as a significant headwind for commodities priced in dollars, including silver. Typically, a weakening dollar acts as a catalyst for precious metals, as it reduces their cost for holders of other currencies and can signal a shift towards safer assets. However, this week's narrative has been different. Recent economic data and forward guidance from Federal Reserve officials have tempered expectations for aggressive future rate hikes. This shift, while seemingly dollar-negative, has not translated into a sustained sell-off for the greenback, suggesting that other currencies are also facing their own set of challenges, or that the market is reassessing the Fed's trajectory in a more nuanced way.
The implications for silver are profound. As Fed hike bets diminish, the opportunity cost of holding non-yielding assets like silver decreases, which should theoretically be supportive. Yet, the persistent strength of the DXY, which has seen its 1H trend shift to neutral with a strong ADX of 27.71, indicates underlying demand for the dollar. This divergence is a key area of focus for traders. The technical indicators on various timeframes for XAGUSD paint a predominantly bearish picture. On the 1-hour chart, the RSI at 37.11 is firmly in neutral territory but trending downwards, reflecting a lack of buying conviction. The MACD is showing negative momentum, and the price is trading below the middle Bollinger Band, reinforcing the bearish sentiment. While the 1H Stochastic oscillator is showing a bullish signal (%K > %D), its value (K=43.73, D=25.17) is not yet in extreme territory, making this signal less convincing against the backdrop of broader negative momentum. The ADX at 35.29 on the 4H chart confirms a strong downtrend, suggesting that the prevailing market sentiment is one of selling pressure rather than accumulation.
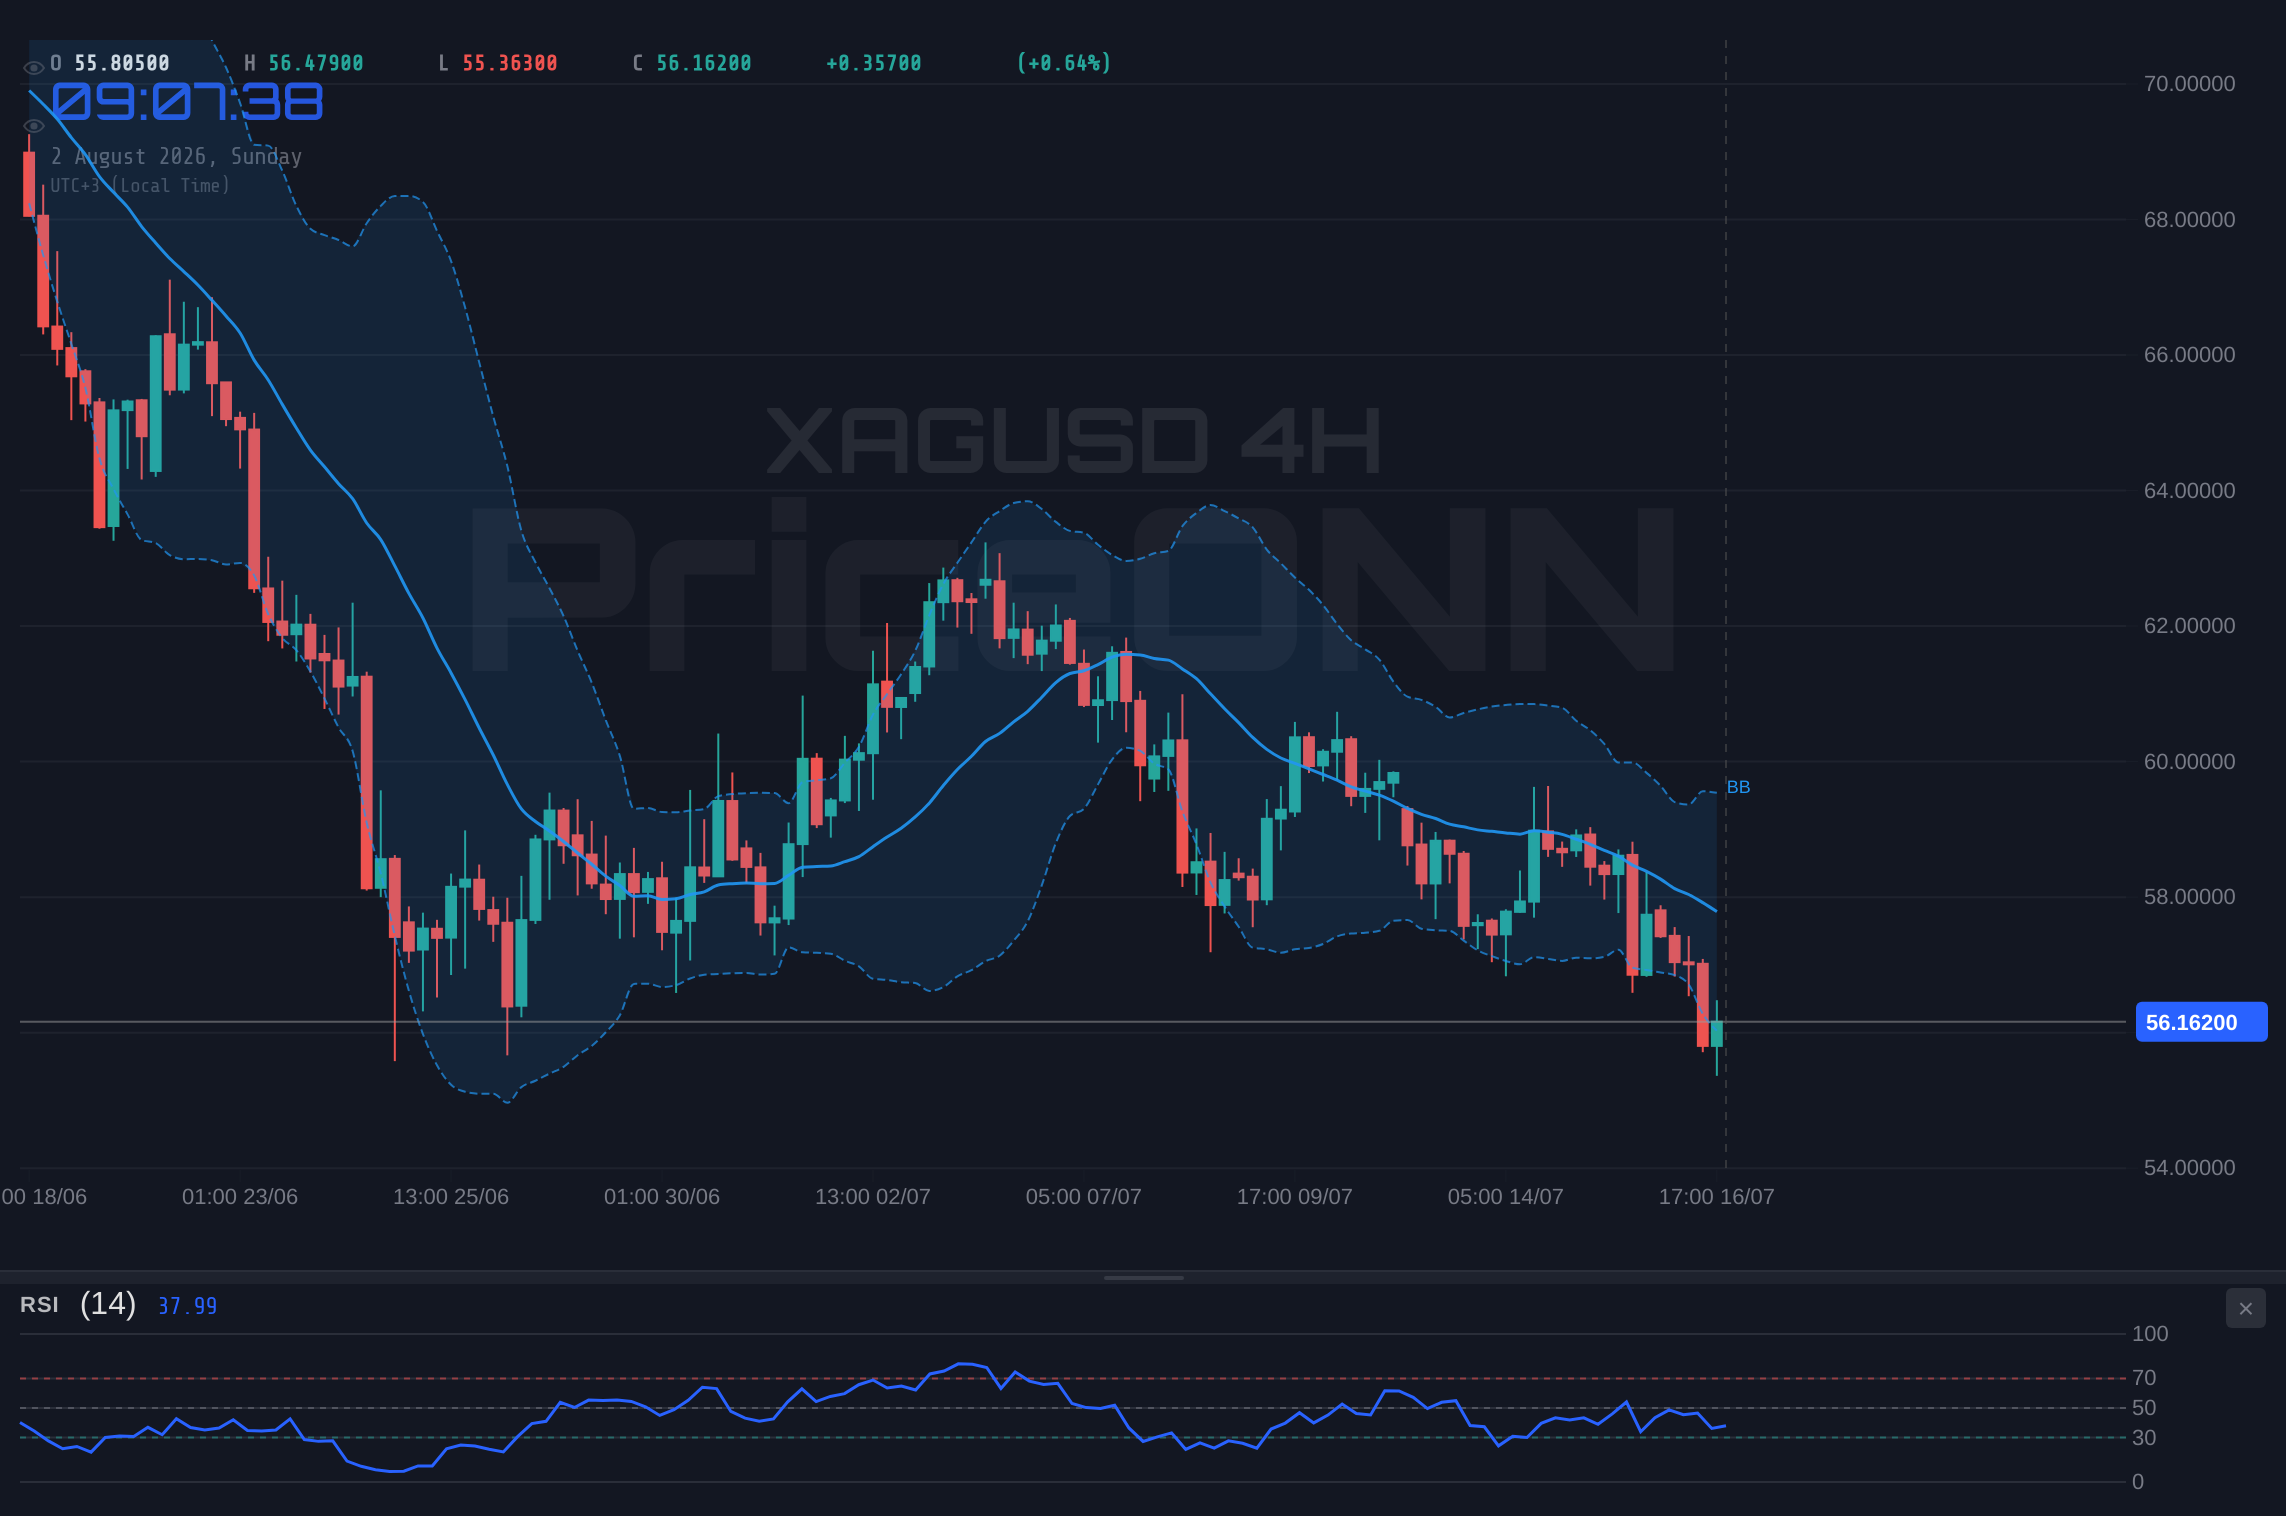
The interplay between the dollar's performance and the market's interpretation of Fed policy is critical. If the Fed indeed signals a pause or a slower pace of tightening, it could eventually lead to a weaker dollar. However, the immediate reaction seems to be one of cautious consolidation, with the dollar finding support perhaps due to its safe-haven status amidst broader market uncertainty or simply due to the lack of a compelling alternative for global capital. This environment makes it challenging for silver to find strong upward momentum. The news that gold prices have tumbled amid diminishing signs of a near-term U.S.-Iran truce, along with profit-taking, also casts a shadow over the broader precious metals complex, including silver. While silver often exhibits its own unique drivers, it rarely moves in complete isolation from gold, especially when broader risk sentiment is a factor. The market is clearly at a crossroads, and the $56.16 level for XAGUSD will be a key battleground in the coming days.
Technical Landscape: A Bearish Tilt Across Timeframes
A deep dive into the technical indicators for XAGUSD reveals a consistent bearish bias across multiple timeframes, reinforcing the narrative of caution and potential downside risk. On the 1-hour chart, the trend is decidedly bearish with a strength of 93%, supported by an ADX of 35.29. The RSI at 37.11, while technically in neutral territory, clearly shows a downward trajectory, indicating that sellers are more active than buyers in the short term. The MACD aligns with this, displaying negative momentum and trading below its signal line. Price action below the middle Bollinger Band further confirms this bearish inclination. Although the 1H Stochastic oscillator (%K at 43.73, %D at 25.17) is flashing a bullish crossover, its current position does not override the prevailing negative momentum, suggesting this could be a brief technical bounce rather than a sustained reversal signal.
Stepping back to the 4-hour timeframe, the bearish trend strengthens, boasting a 100% trend strength and an ADX of 29.63, which denotes a solid trend. Here, the RSI stands at 35.87, further into oversold territory territory and maintaining its downward slope. The MACD remains bearish, with negative momentum and the histogram firmly below the zero line. Price action is consistently below the middle Bollinger Band, a classic sign of bearish control. The Stochastic oscillator on this timeframe (K=14.97, D=23.19) is also signaling a bearish crossover, reinforcing the downside bias. The supporting levels on this chart are particularly noteworthy: $55.32, $54.83, and $53.94. A decisive break below the $55.32 level, which is the first significant support, could accelerate selling pressure.
The daily chart, the longest timeframe under consideration, also paints a predominantly bearish picture, despite some conflicting signals from the MACD. The trend strength is rated at 100% with a powerful ADX of 42.27, indicating a strong prevailing downtrend. The RSI at 34.24 is deeply in the neutral zone, trending downwards, and suggesting ample room for further price depreciation before reaching oversold conditions. The Stochastic oscillator (K=18.69, D=32.03) confirms a bearish outlook with a clear crossover below the signal line. However, the MACD on the daily chart is showing positive momentum, with the MACD line above the signal line. This divergence is important; it suggests that while the overall trend remains bearish, the intensity of selling pressure might be easing on the longest timeframe. Nevertheless, the overwhelming signals from the shorter timeframes, combined with the strong daily ADX, point towards caution. The immediate resistance levels to watch on the daily chart are $58.99, $60.23, and $61.43. For silver to regain any bullish footing, it would need to decisively break and hold above the $58.99 level, which currently seems a distant prospect given the current technical setup.
The general signal across all three timeframes leans heavily towards 'SELL'. The 1H and 4H charts offer the clearest bearish confluence, while the daily chart, despite a slightly conflicting MACD, still shows a strong downtrend confirmed by ADX and RSI. The fact that the "General Signal" on both the 1H and 4H is a strong "SAT" (Sell) underscores the immediate bearish sentiment. The 1H chart shows 1 Buy, 7 Sell signals, and the 4H shows 0 Buy, 8 Sell signals. The daily chart, while having a slightly more mixed overall signal count (1 Buy, 7 Sell), still leans heavily bearish. This technical consensus suggests that traders should be looking for opportunities to short silver, or at least remain on the sidelines, until clearer signs of a bottoming process emerge. The key is to respect the established downtrend and wait for confirmation before considering any long positions.
Macroeconomic Undercurrents: Inflation, Fed, and the Dollar's Dance
Beyond the charts, the macroeconomic landscape is providing a complex backdrop for silver's performance. The recent acceleration in Eurozone core inflation to 2.5% in July, exceeding expectations, has reinforced the European Central Bank's (ECB) hawkish stance. While this might typically support a currency like the Euro (EUR) against the dollar, the broader market's reaction has been muted, highlighting the dominant influence of U.S. monetary policy expectations. The U.S. market is keenly focused on the upcoming Non-Farm Payrolls (NFP) report, scheduled for release next Friday. This crucial employment data will provide further clues about the Federal Reserve's potential path forward regarding interest rates. Currently, market participants are digesting the idea that the Fed might be nearing the end of its tightening cycle, or at least slowing its pace. This recalibration of expectations has been a significant driver of currency and commodity markets.
The news that "The Weekly Bottom Line: Markets Issue a Yellow Card to the Fed" suggests that traders are becoming more skeptical of the Fed's ability to continue aggressive rate hikes without causing significant economic disruption. This sentiment can lead to a reduction in demand for the dollar, which, as previously mentioned, should theoretically benefit silver. However, the correlation between XAGUSD and DXY remains a critical factor. With DXY hovering around 100.7, its strength continues to exert downward pressure. If the upcoming NFP report comes in weaker than expected, it could indeed lead to a dollar sell-off and provide a much-needed boost to silver. Conversely, a strong jobs report might reignite fears of persistent inflation and prompt a hawkish reassessment from the Fed, further strengthening the dollar and weighing on precious metals.
Furthermore, the geopolitical context, while not directly tied to a specific silver catalyst in the provided news, cannot be ignored. The mention of "Gold Slumps Amid Diminishing Signs Of Near-Term U.S.-Iran Truce, Profit Taking" indicates that broader geopolitical tensions can influence precious metals. While silver is less of a direct safe-haven than gold, it often benefits from general risk aversion. The current geopolitical climate, characterized by ongoing disputes and potential flare-ups, could provide underlying support for precious metals if risk sentiment deteriorates significantly. However, for now, the immediate focus remains on U.S. economic data and Fed policy expectations. The market's current interpretation is that the Fed's potential pivot is not yet strong enough to overcome the dollar's current momentum and the prevailing bearish technical setup for XAGUSD. The price action around $56.16 will be pivotal in determining whether this cautious bearish stance continues or if a shift in macro sentiment can provide a reprieve.
Key Levels and Trade Scenarios for XAGUSD
Given the prevailing bearish sentiment and the critical technical levels at play, understanding the potential price scenarios for XAGUSD is paramount for traders looking to navigate this market. The current price of $56.16 sits precariously close to significant support, making the short-term outlook highly dependent on the integrity of these levels.
Bearish Scenario: Breakdown Below Key Support
65% ProbabilityConsolidation Scenario: Range-Bound Trading
25% ProbabilityBullish Scenario: Reversal Above Resistance
10% ProbabilityThe technical indicators, particularly on the 1H and 4H charts, strongly favor the bearish scenario. The ADX readings of 35.29 (1H) and 29.63 (4H) indicate a strong trend is in play, and with the RSI below 40 and MACD showing negative momentum, the path of least resistance appears to be downwards. The confirmation of this bearish outlook would come from a decisive break below the $55.32 support level. Such a move would likely trigger stop-loss orders and attract further selling, potentially leading to rapid price depreciation towards the lower targets.
Conversely, the neutral scenario anticipates a period of range-bound trading. This would likely occur if the upcoming economic data fails to provide a clear direction or if conflicting signals emerge. In such a case, XAGUSD might oscillate between the immediate 1H support at $55.97 and resistance at $57.06. This would be a period of indecision, where traders might look for scalping opportunities within the range or await a clearer breakout signal. The probability assigned to this scenario is moderate, reflecting the current technical setup which, while bearish, isn't yet showing signs of an immediate, sharp reversal.
The bullish scenario, though assigned the lowest probability (10%), cannot be entirely dismissed. For silver to embark on a sustained upward journey, it would require a significant shift in market sentiment, potentially driven by weaker-than-expected U.S. employment data, a dovish surprise from the Fed, or a significant geopolitical event that boosts safe-haven demand. Technically, this would necessitate breaking decisively above the daily resistance at $58.99. Until such a catalyst emerges and is confirmed by technical indicators, any rallies are likely to be met with selling pressure, particularly around the $57.06 to $58.99 resistance zone. Traders should remain vigilant for signs of capitulation selling or a clear technical reversal pattern before considering long positions.
The Week Ahead: Data, Fed Watch, and Silver's Fate
As we look towards the next trading week, the focus remains squarely on key economic data releases and the evolving narrative surrounding Federal Reserve policy. The upcoming U.S. Non-Farm Payrolls (NFP) report stands out as the most significant event, carrying the potential to significantly influence market sentiment and, consequently, the trajectory of silver prices. A weaker-than-expected jobs report could solidify expectations that the Fed is nearing the end of its hiking cycle, potentially leading to a dollar pullback and providing a much-needed lift for XAGUSD. This aligns with the "Why Aren’t Gold and Silver Keeping Up With the Falling Dollar?" sentiment, suggesting that the market is primed for precious metals to react positively to dollar weakness.
Conversely, a robust jobs report could reignite concerns about inflation and prompt a reassessment of the Fed's stance, potentially leading to renewed dollar strength and further pressure on silver. This would play into the current bearish technical setup, where support levels like $55.32 and $54.83 become critical watch zones. The "Markets Issue a Yellow Card to the Fed" commentary further suggests that traders are becoming more sensitive to any hints of continued hawkishness, which could cap rallies in risk assets and commodities.
Beyond the NFP, other economic indicators from Canada and New Zealand, as mentioned in the "Week Ahead" preview, will also contribute to the global economic picture. While less directly impactful on XAGUSD than U.S. data, they can influence broader currency movements and risk appetite. Geopolitical developments, though currently showing diminishing signs of immediate U.S.-Iran truce escalation, remain a background risk. Any resurgence in tensions could quickly shift market sentiment towards safe havens. For silver traders, the week ahead presents a delicate balancing act. The technicals suggest a bearish bias, but a significant macroeconomic catalyst, such as a weak NFP report, could trigger a sharp reversal. Patience and disciplined risk management will be key. Watching the $56.16 price point and the immediate support and resistance levels around it will be crucial in determining the next directional move.
| Indicator | Value | Signal | Interpretation |
|---|---|---|---|
| RSI (14) | 37.11 | Bearish | Downward momentum, neutral zone |
| MACD Histogram | -0.32 | Bearish | Negative momentum, below signal line |
| Stochastic Oscillator | K:43.73, D:25.17 | Neutral | Bullish crossover, but low momentum |
| ADX | 35.29 | Strong Trend | Confirms strong downtrend |
| Bollinger Bands | Bearish | Price below middle band |
Frequently Asked Questions: XAGUSD Analysis
What happens if XAGUSD breaks below $55.32 support this week?
A break below the $55.32 support level on the 4H chart would likely trigger further selling pressure, potentially accelerating the decline towards $54.83 and $53.94. This would confirm the bearish scenario with a probability of 65%.
Should I consider buying XAGUSD at current levels around $56.16 given the bearish signals?
Buying at current levels is not advised given the strong bearish technical setup and the 65% probability of a bearish scenario. Patience is recommended; wait for a clear break of resistance or a confirmed bottoming pattern before considering long positions.
Is the RSI at 37.11 a sell signal for XAGUSD right now?
An RSI of 37.11 on the 1H chart indicates bearish momentum but is not yet in oversold territory. While it contributes to the overall bearish outlook, it's not a standalone sell signal. Confirmation from price action and other indicators, like MACD showing negative momentum, strengthens the sell case.
How will the upcoming NFP report affect XAGUSD this week?
A weaker NFP report could lead to dollar depreciation and boost XAGUSD towards resistance levels like $57.06. Conversely, a strong report might strengthen the dollar and push XAGUSD towards support levels near $55.32, reinforcing the current bearish trend.
Track markets in real-time
AI-powered analysis, technical indicators and real-time price data.
Join Our Telegram Channel
Breaking market news, AI analysis and trading signals instantly.
Join Channel