

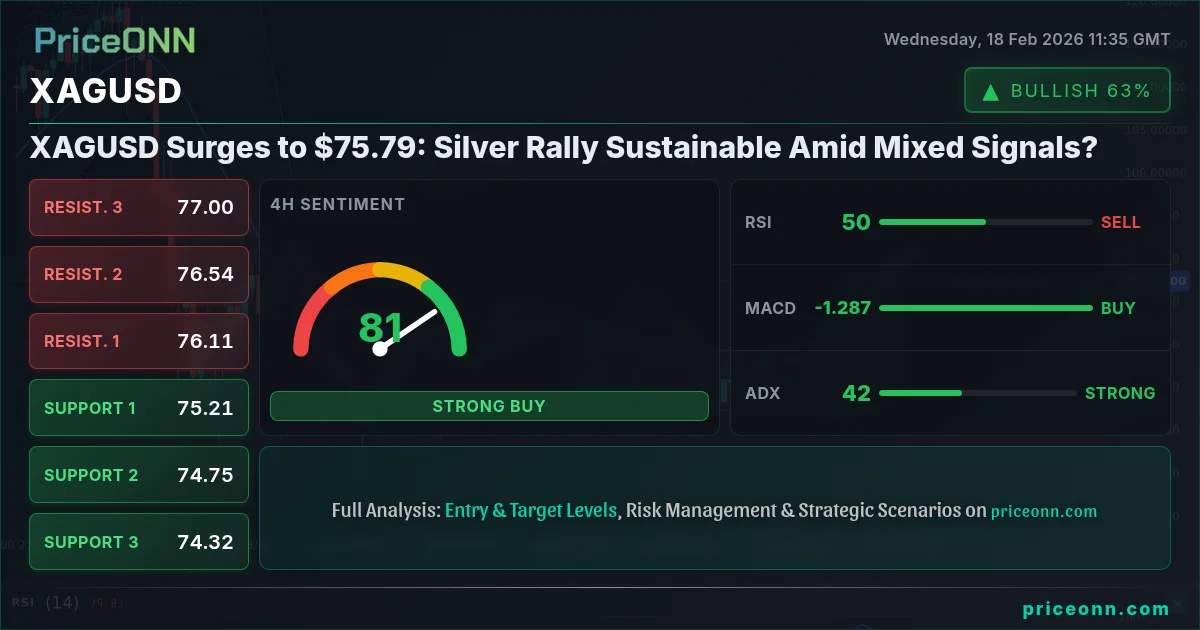
Silver (XAGUSD) is making headlines today, surging to $75.79 amid a complex interplay of technical signals. While the precious metal is exhibiting bullish momentum, a closer examination reveals a landscape riddled with contradictions. Can this rally sustain itself, or are we on the cusp of a pullback?
The silver rally is fueled by strong buying momentum, with the price currently at $75.79. However, conflicting signals from technical indicators suggest caution.
Technical Overview
On the 1-hour timeframe, XAGUSD displays a neutral trend, albeit with the RSI hovering in neutral territory at 59.12, indicating a slight upward bias. The MACD shows positive momentum, reinforcing the short-term bullish outlook. However, the Stochastic oscillator is flashing an overbought signal with K=89.25 and D=90.38, suggesting a potential pullback. The ADX at 30.43 points to a moderately strong trend. The overall signal is AL (Buy).
Shifting to the 4-hour timeframe, the trend turns bearish, with the trend strength at 96%. The RSI at 46.42 indicates a weakening bullish momentum. While the MACD still shows positive momentum, it's losing steam. The Stochastic oscillator is giving a buy signal (%K > %D), indicating a potential short-term bounce. The ADX, however, signals a strong downward trend at 42.65. The overall signal is SAT (Sell).
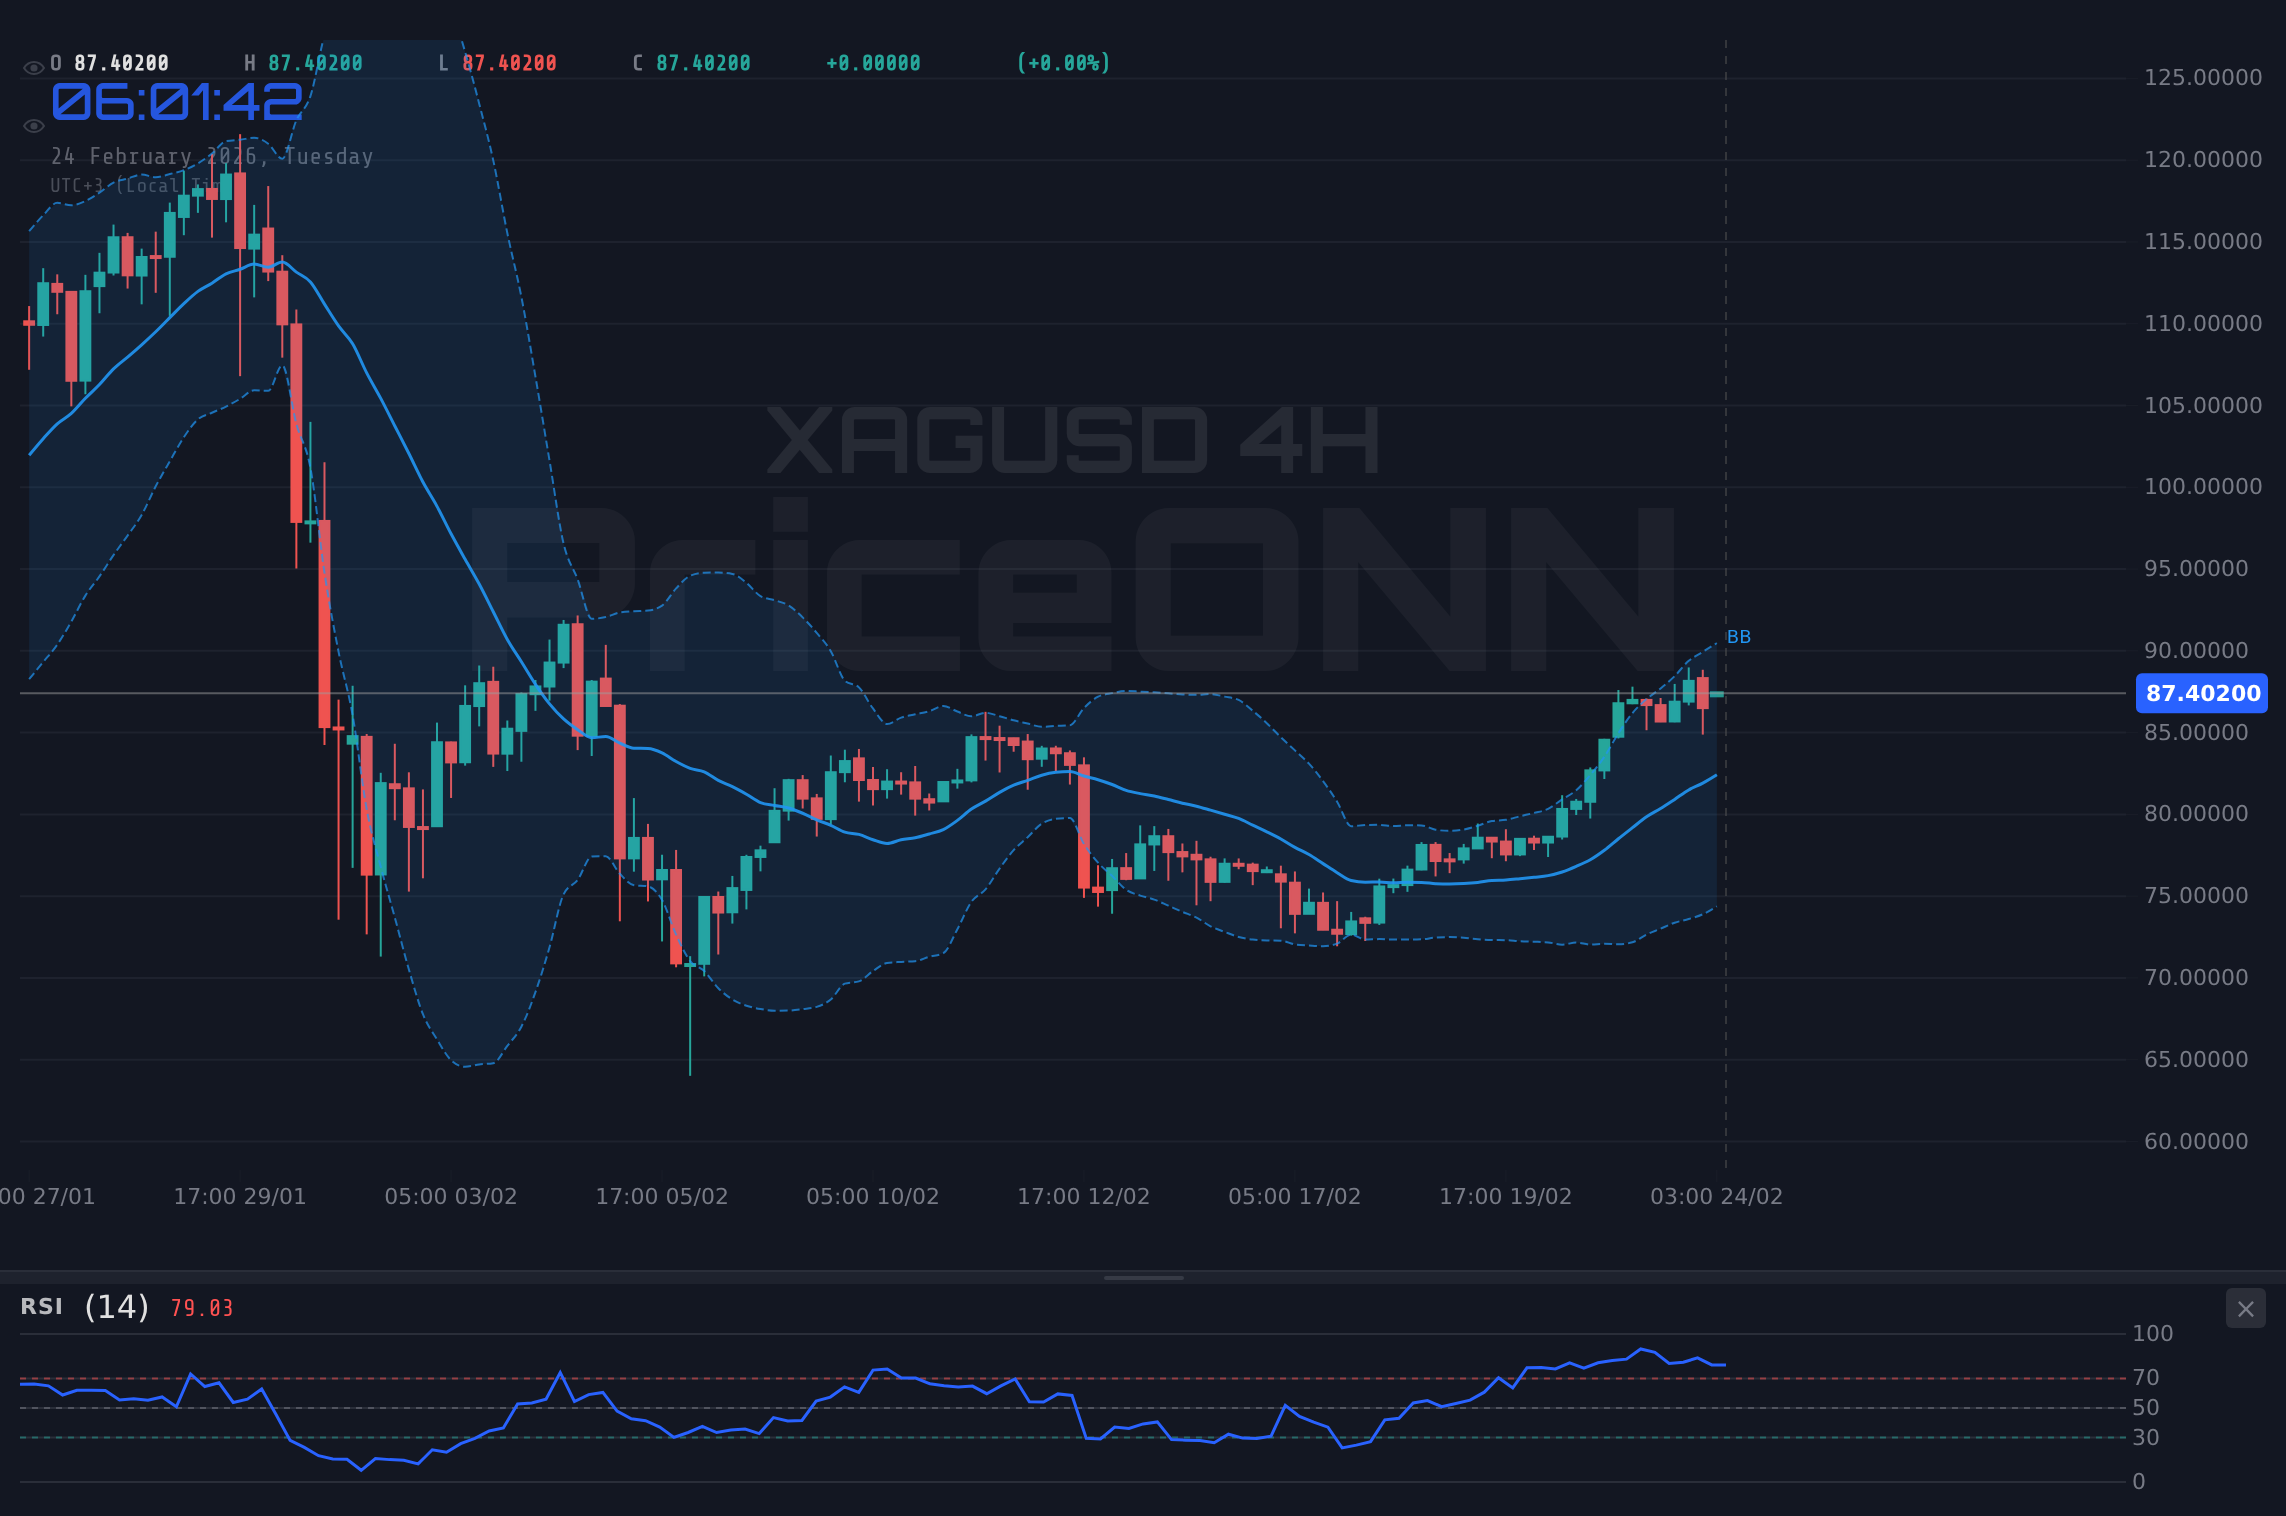
The daily timeframe presents a neutral picture. The RSI at 44.56 suggests neither overbought nor oversold conditions. The MACD displays negative momentum, while the Stochastic oscillator signals a buy. The ADX at 34.81 indicates a strong downward trend. The overall signal is SAT (Sell).
The conflicting signals across different timeframes make XAGUSD a tricky asset to trade. A long position based solely on the 1-hour chart could be quickly invalidated by the bearish signals on the 4-hour and daily charts.
Key Support and Resistance Levels
Identifying key support and resistance levels is crucial for navigating XAGUSD's choppy waters. Here's a breakdown:
- Immediate Support: $75.52 (1H), $73.87 (4H), $71.31 (1D)
- Immediate Resistance: $75.95 (1H), $76.69 (4H), $76.23 (1D)
A break below $75.52 could trigger a move towards $73.87, while a sustained move above $75.95 might open the door to $76.69.
Bullish Scenario
Despite the mixed signals, a bullish scenario remains plausible. Several factors could fuel further upside for XAGUSD:
- DXY Weakness: A weakening US Dollar Index (DXY) would provide a tailwind for silver. The DXY currently sits at 96.98, and a break below 96.92 could signal further dollar weakness.
- Risk Appetite: A rise in risk appetite, as indicated by a rising Nasdaq 100 (currently at 24840.49), could draw investors away from safe-haven assets like silver.
- Inflation Concerns: Persistent inflation concerns could bolster silver's appeal as an inflation hedge.
A sustained break above $76.23 on the daily chart, coupled with a weakening DXY, could signal a significant bullish breakout for XAGUSD.
Bearish Scenario
Alternatively, a bearish scenario could unfold if:
- DXY Strength: A strengthening DXY would put downward pressure on silver.
- Risk Aversion: A decline in risk appetite, as indicated by a falling Nasdaq 100, could increase demand for safe-haven assets like the US dollar, further weakening silver.
- Profit-Taking: Given the recent rally, profit-taking could trigger a significant pullback.
Monitor the DXY closely. A decisive break above 97.00 could signal further dollar strength and a potential reversal for XAGUSD.
Upcoming Catalysts
Several key events could influence XAGUSD in the coming days:
Indikatör Notu: Stochastic 1D yükseliş sinyali veriyor, ancak ADX 34.81 ile güçlü düşüş trendi gösteriyor. Stochastic uzun süre dip seviyelerde kalabilir. Yükseliş için Stochastic'in aşırı satım bölgesinden çıkması ve ADX'in zayıflaması beklenmeli.
Trade Plani
Senaryo A: Trend Devami (Ana)
- Yon: Satis
- Trigger: 75.52 altinda H4 kapanis
- Hedef 1: 73.87 (~165 pip)
- Hedef 2: 72.14 (~338 pip)
- Stop/Invalidasyon: 76.69 ustunde H4 kapanis
Senaryo B: Geri Cekilme/Tepki (Alternatif)
- Kosul: 75.52 desteginin tutmasi + RSI divergence
- Trigger: 75.95 uzerinde H4 kapanis + hacim artisi
- Hedef: 76.69 bolgesi
- Invalidasyon: 75.00 altinda kapanis
Haber Riski: Gelecek günlerde açıklanacak ABD ekonomik verileri öncesi volatilite artabilir. Pozisyon boyutunu küçültmeyi düşünün.
| Indicator | Value | Signal | Interpretation |
|---|---|---|---|
| RSI (14) 1H | 59.12 | Neutral | Neutral |
| MACD 4H | Positive | Bullish | Positive Momentum |
| Stochastic 1D | 44.47 | Bullish | Buy |
| ADX 4H | 42.65 | Bearish | Strong Down Trend |
XAGUSD's current rally presents both opportunities and risks. A cautious approach, coupled with close monitoring of key technical indicators and economic data, is essential for navigating this complex market landscape.
Track markets in real-time
AI-powered analysis, technical indicators and real-time price data.
Join Our Telegram Channel
Breaking market news, AI analysis and trading signals instantly.
Join Channel