

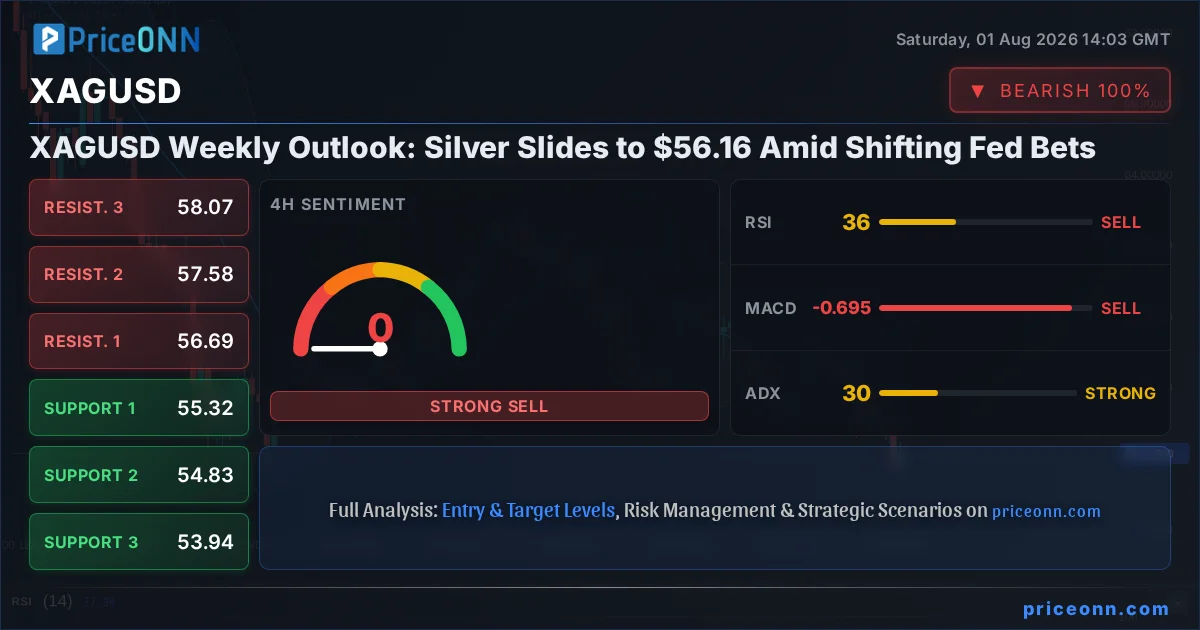
The silver market is in a precarious position, with the price hovering around the critical $56.16 mark as the week draws to a close. After a period of volatility, the precious metal has seen its bearish slide continue, a trend that demands close attention from traders and investors alike. This past week has been particularly revealing, showcasing how broader market forces, especially the strength of the US dollar and evolving expectations around Federal Reserve policy, can exert significant downward pressure on assets traditionally viewed as safe havens. The interplay between these macro factors and the specific technical readings on the XAGUSD chart paints a complex picture, suggesting that while the immediate outlook remains challenging, opportunities for tactical positioning may emerge for those who understand the underlying dynamics.
- The RSI at 37.11 on the 1H chart signals a neutral but leaning bearish momentum, indicating a lack of strong buying pressure.
- Critical support for XAGUSD is currently eyed at $55.97, a level that has shown some resilience but is under threat given the current trend.
- The ADX reading of 35.29 on the 1H timeframe confirms a strong downward trend is in play, suggesting further downside is possible.
- DXY's strength, currently at 100.7, is directly correlated with the pressure on XAGUSD, as a stronger dollar typically reduces the appeal of dollar-denominated commodities.
This past week has been a stark reminder of the delicate balance within financial markets. While a weaker dollar often serves as a tailwind for gold and silver, the narrative surrounding silver's recent performance is more nuanced. As highlighted by recent market commentary, the decline in silver isn't solely driven by a strengthening dollar but also by a recalcitrant inflation picture and shifting expectations regarding the Federal Reserve's monetary policy path. When the market begins to price out future interest rate hikes, or even contemplates potential cuts, it can reduce the attractiveness of yield-bearing assets and, by extension, impact the demand for non-yielding precious metals. The Eurozone's core inflation unexpectedly accelerating to 2.5% further complicates the global monetary policy landscape, reinforcing a hawkish stance from the ECB and adding another layer of complexity to currency and commodity markets.
On the technical front, the 1-hour chart for XAGUSD presents a predominantly bearish signal, with a strong ADX of 35.29 indicating a robust downward trend. The RSI at 37.11, while not deeply oversold, suggests considerable room for further downside before any significant buying interest might emerge. The MACD is firmly in negative territory, reinforcing the bearish momentum. Bollinger Bands are showing the price trading below the middle band, a classic sign of downward pressure. However, a glimmer of potential counter-trend movement can be observed in the Stochastic indicator, where the %K line (43.73) is above the %D line (25.17), hinting at a possible short-term upward correction. This divergence between the RSI/MACD and the Stochastic is a common feature in trending markets, often preceding minor pullbacks before the primary trend reasserts itself. The overall signal on this timeframe leans heavily towards selling, with a clear consensus among technical indicators.
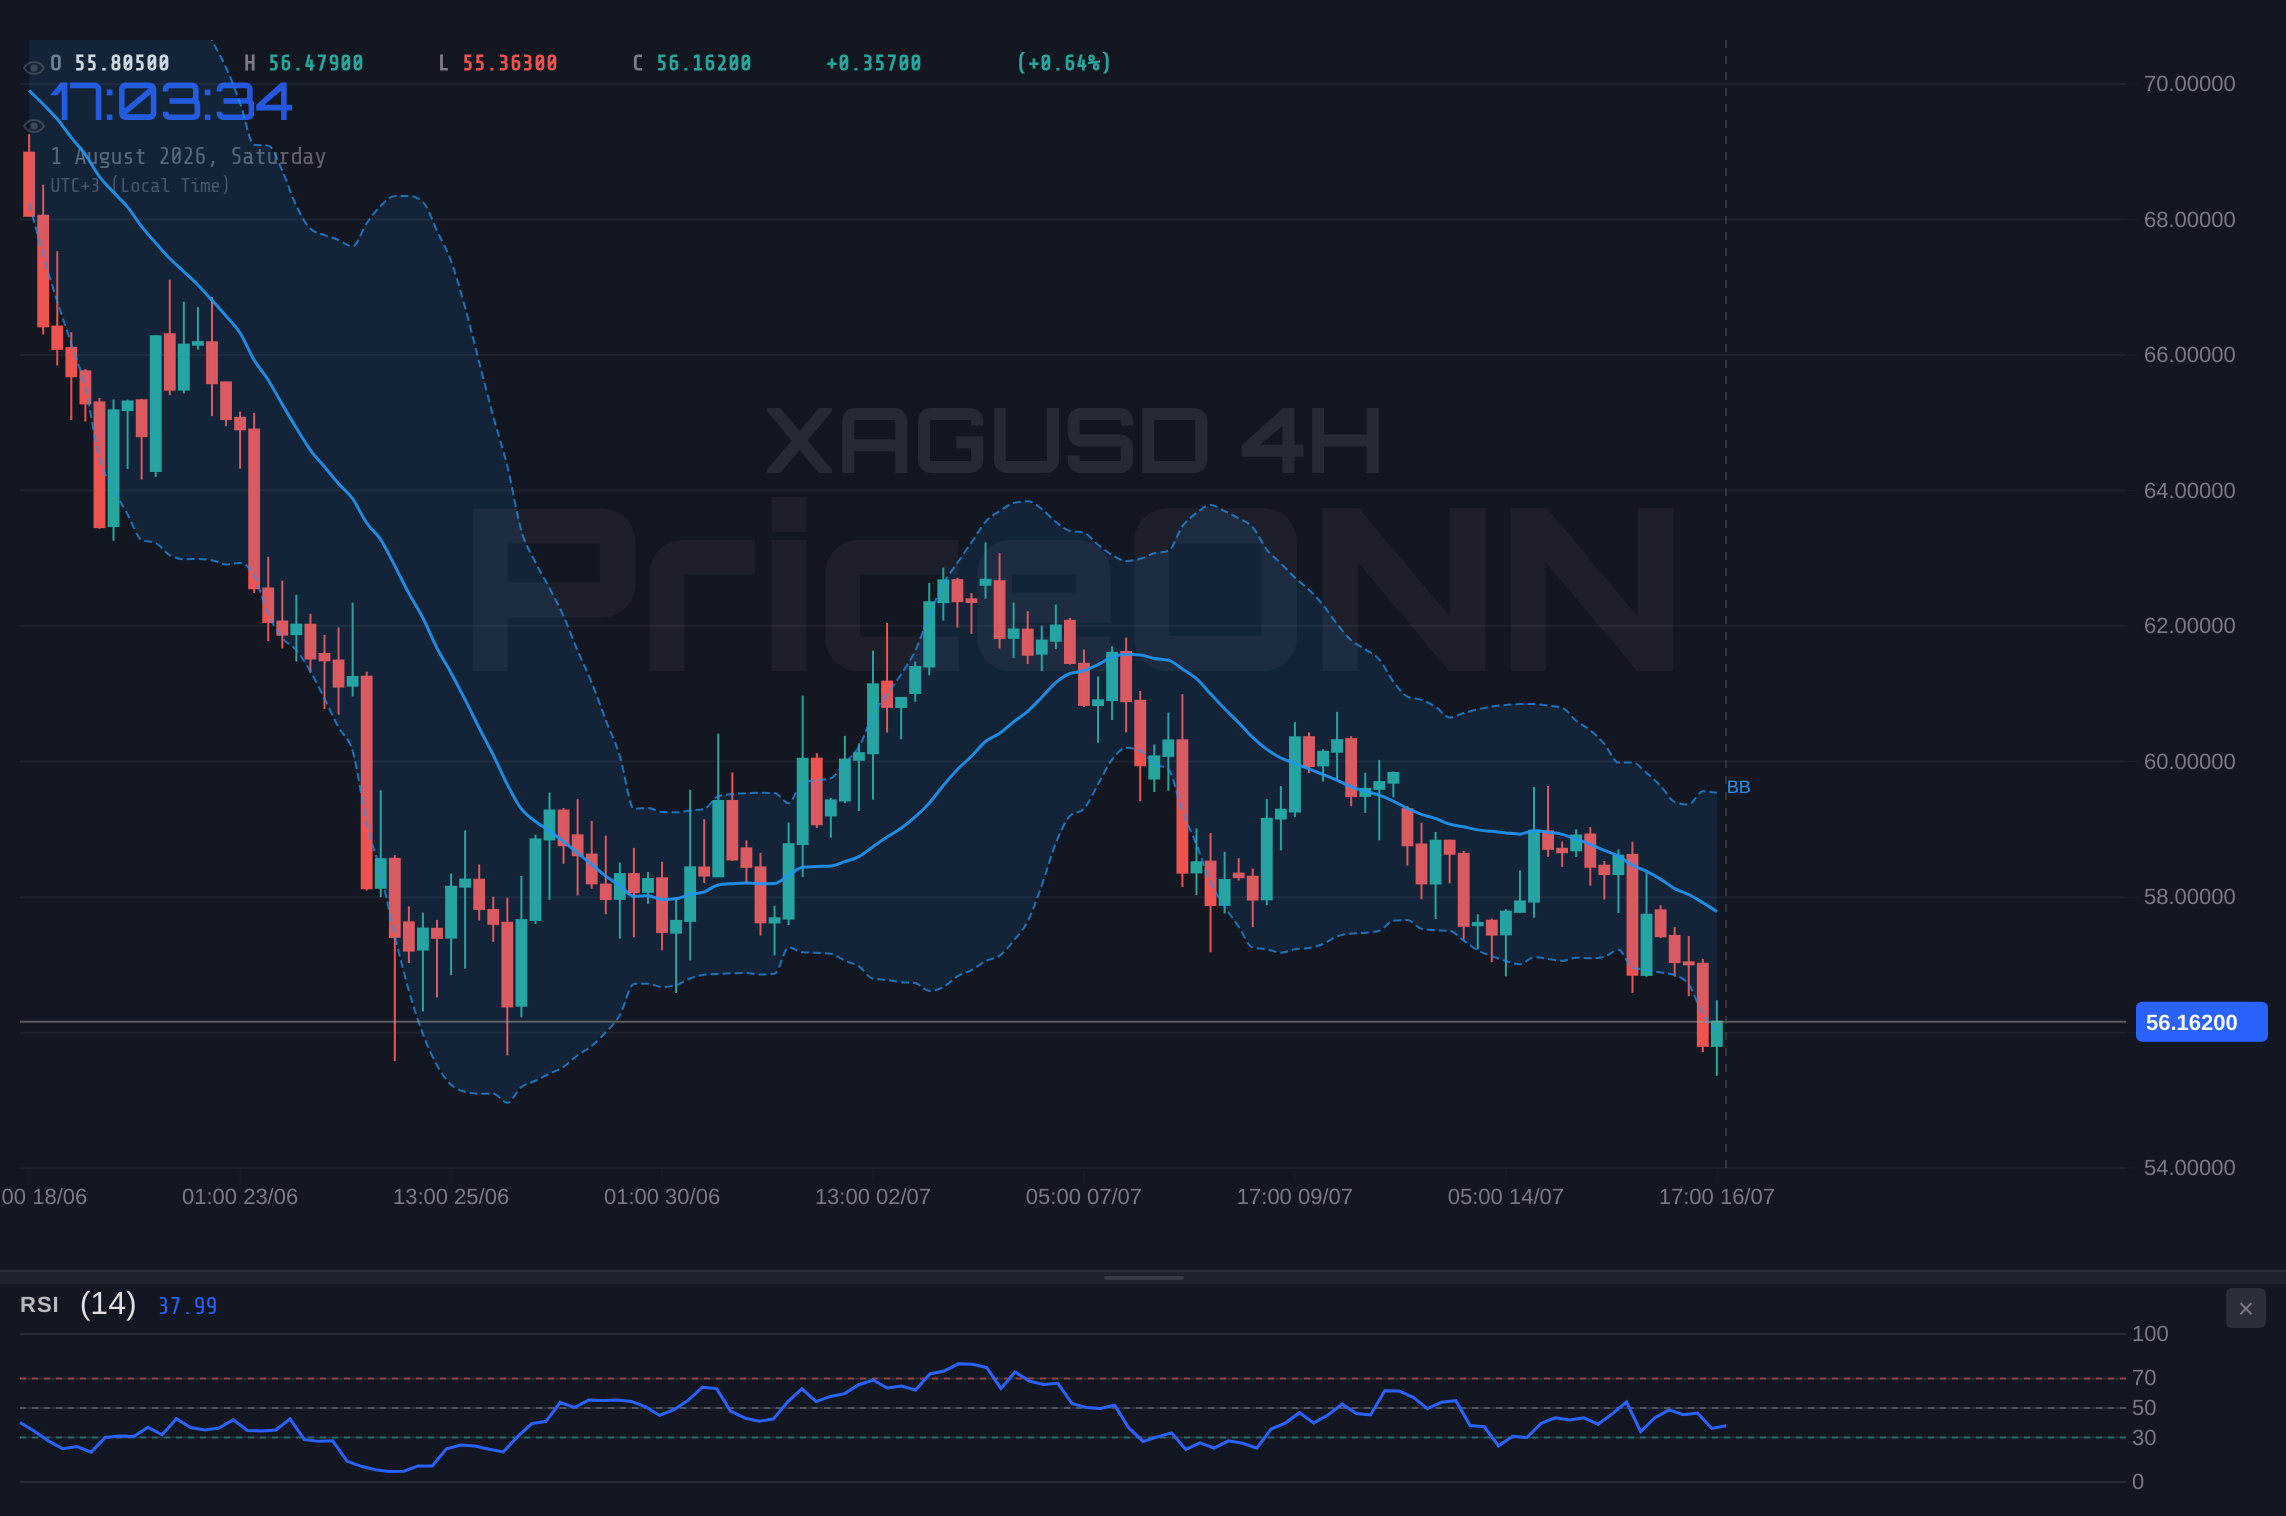
Zooming out to the 4-hour timeframe, the trend for XAGUSD solidifies its bearish disposition with a power rating of 100%. The ADX at 15.79 here suggests a weaker trend strength compared to the 1-hour chart, implying a more consolidated or range-bound environment within the broader downtrend. Despite this, the overall directional bias remains firmly downward. The RSI sits at 35.87, still in the neutral-to-bearish zone, and the MACD continues to signal negative momentum. The Stochastic indicator, with %K at 14.97 and %D at 23.19, clearly indicates a bearish signal, reinforcing the downward trajectory. The Bollinger Bands are also signaling bearish pressure, with the price hugging the lower band or trading below the middle band. This multi-timeframe confluence of bearish signals underscores the prevailing sentiment in the silver market, suggesting that any rallies are likely to be met with selling pressure.
The daily timeframe further cements the bearish narrative for XAGUSD. The trend is unequivocally downward, with a power rating of 100%. The ADX at 42.27 signifies a strong trend, much stronger than observed on the shorter timeframes, indicating that the current move has significant conviction behind it. The RSI at 34.24 is deep in the neutral-to-oversold territory, suggesting that the market is becoming increasingly bearish. The MACD, however, presents a slight divergence here, showing positive momentum and trading above its signal line, which could hint at a potential reversal or at least a period of consolidation. Yet, the Stochastic indicator, with %K at 18.69 and %D at 32.03, provides a clear bearish signal, aligning with the overall trend. Bollinger Bands are again indicating bearishness, with the price trading below the middle band. This mixed signal from the MACD on the daily chart warrants caution, suggesting that while the trend is strongly down, the sharpest part of the sell-off might be nearing exhaustion, or at least a pause.
The correlation with broader market indices and the US Dollar Index (DXY) is crucial for understanding the external pressures on XAGUSD. The DXY itself is showing strength, currently trading at 100.7. Historically, a rising DXY puts downward pressure on dollar-denominated commodities like silver. With the DXY at 100.7, this correlation is actively playing out, acting as a significant headwind for silver prices. Simultaneously, equity markets present a mixed picture. The SP500 is showing some upward momentum, trading at 6572.87, which might typically suggest a risk-on environment that could benefit silver. However, the Nasdaq 100 is experiencing a notable pullback, down 1.16% to 29164.86. This divergence in equity performance adds another layer of complexity, as it indicates shifting risk appetites within different market segments. A risk-off sentiment, often reflected in a falling Nasdaq, could indirectly support silver as a safe-haven asset, but this is currently being overshadowed by the dollar's strength and the specific bearish technicals.
The recent economic data also plays a pivotal role in shaping the outlook for silver. The US economy grew at a slower-than-expected pace of 1.5% in the second quarter, a figure that missed forecasts. While slower growth might typically be seen as a negative for risk assets, it can also influence central bank policy. A weaker economy could lead the Fed to adopt a more dovish stance, potentially pausing or even reversing interest rate hikes. This, in turn, could weaken the dollar and provide some relief to silver prices. However, the Eurozone's core inflation unexpectedly accelerating to 2.5% reinforces a hawkish stance from the ECB, creating divergent monetary policy paths globally and adding volatility to currency pairs like EURUSD, which is trading at 1.14436.
Furthermore, geopolitical tensions continue to be a background factor influencing precious metals. Reports indicate that Saudi Arabia's oil output has decreased while revenues have increased, a situation partly driven by ongoing global conflicts. While oil prices themselves are experiencing a slight pullback, with Brent at $83.79 and WTI at $79.59, the underlying geopolitical instability remains a potential catalyst for safe-haven demand. However, as noted in recent market analysis, the current drivers for silver's decline appear more rooted in monetary policy expectations and dollar strength than immediate geopolitical shocks. The narrative that a weaker dollar should lift gold and silver is currently being challenged, suggesting that the market is prioritizing other factors, such as the Fed's trajectory, over simple currency dynamics.
Looking at the specific technical levels, XAGUSD faces immediate resistance at $4019.21 on the 1-hour chart and $4026.74 on the 4-hour chart. These are the levels that bulls must reclaim to even consider a trend reversal. On the downside, immediate support lies at $3991.8 on the 1H chart and $3973.82 on the 4H chart. A decisive break below these levels would confirm the bearish trend and potentially open the door for further declines towards the daily support levels, which are significantly lower. The daily chart's resistance levels, starting from $4088.69, appear distant given the current momentum, while the daily support at $4024.67 is already being tested and could give way.
The confluence of indicators on the daily timeframe presents a somewhat mixed signal, which is often the case at potential turning points. While the ADX (39.16) and the overall trend remain strongly bearish, the MACD showing positive momentum and the Stochastic indicator (K=26.18, D=44.73) signaling a potential upward move, suggest that the aggressive selling might be facing headwinds. This could lead to a period of consolidation or a shallow retracement before the dominant downtrend resumes. However, the general signal across all timeframes is still predominantly 'SELL', indicating that the path of least resistance is downwards. The strength of the trend on the daily chart (95%) cannot be ignored, suggesting that any bullish divergence should be treated with extreme caution.
Considering the current market sentiment and technical readings, the outlook for XAGUSD remains bearish in the short to medium term. The prevailing downward trend, supported by a strong dollar and shifting rate expectations, points towards further potential downside. However, the presence of some bullish signals on shorter timeframes and the daily MACD divergence suggest that a sharp, sustained rally is unlikely without a significant shift in macro-economic drivers or a clear break above key resistance levels. Traders should remain vigilant, observing price action around the immediate support and resistance levels, and paying close attention to the DXY and any new central bank commentary that could alter the current narrative. The key will be whether the bearish momentum can overcome the technical divergences or if a short-covering rally will take hold.
The technical picture for XAGUSD strongly suggests a bearish bias, particularly when examining the confluence of indicators across multiple timeframes. The 1-hour chart shows a strong downward trend (ADX 35.29) with RSI at 37.11 and MACD signaling negative momentum. Similarly, the 4-hour chart reinforces this bearish outlook with a 100% trend strength and further negative signals from MACD and Stochastic. Even the daily chart, despite a slight MACD divergence, maintains a strong bearish trend (ADX 42.27) and predominantly negative indicator readings. The current price of $56.16 is well within this bearish context, with immediate resistance at $4019.21 (1H) and support at $3991.8 (1H). The broader macro environment, characterized by a strong DXY (100.7) and evolving Fed rate hike expectations, further supports the bearish case. While there are minor divergences hinting at potential pullbacks, the overall technical structure points to a continuation of the downtrend unless significant price action confirms a reversal.
The volatility observed in silver prices this week is a direct reflection of the broader market's uncertainty surrounding future monetary policy and economic growth. With the US economy showing signs of slowing, evidenced by the weaker-than-expected GDP figures, the Federal Reserve faces a complex decision. Should they maintain a hawkish stance to combat lingering inflation, or pivot towards a more accommodative policy to support growth? This dilemma creates a tug-of-war in financial markets, impacting currency valuations and commodity prices. The Eurozone's inflation data adds another layer of complexity, suggesting that central banks globally are grappling with similar challenges. For silver traders, this environment necessitates a cautious approach, focusing on clear technical levels and avoiding premature bets on a trend reversal without strong confirmatory signals.
The current price action around $56.16 for XAGUSD presents a challenging environment for bullish traders. The prevailing bearish trend, coupled with a strong US dollar, creates significant headwinds. Any rallies are likely to be met with profit-taking and renewed selling pressure, especially if they fail to decisively break key resistance levels. The immediate focus remains on the downside support levels. A break below $3991.8 on the 1-hour chart would be a strong bearish signal, potentially accelerating the decline towards the $3976.78 level. Conversely, a sustained move above $4019.21 would be required to challenge the bearish narrative, but this seems unlikely given the current technical and fundamental backdrop. Therefore, the strategy should lean towards identifying shorting opportunities on pullbacks or waiting for a clear break of support.
The ongoing divergence between the technical signals on different timeframes adds an interesting dynamic. While the longer-term daily and 4-hour charts show a clear bearish trend, the 1-hour Stochastic indicator is flashing a potential bullish signal. This often indicates a period of consolidation or a minor retracement within the larger downtrend. Traders looking to capitalize on this might consider short-term long positions targeting the immediate resistance levels, but with strict risk management and tight stop-losses. However, for swing or position traders, the overall bearish picture on higher timeframes suggests that such counter-trend trades carry a higher risk and should be approached with extreme caution. The ADX readings across the board, particularly the strong 42.27 on the daily, confirm that a well-established trend is in force, making counter-trend plays more speculative.
The interplay between gold and silver is also worth noting. While both are precious metals and often move in tandem, their individual performances can diverge based on specific market dynamics. Currently, gold (XAUUSD) is also experiencing a bearish slide, trading at $4001.21. Its technical indicators show a similar bearish lean, with RSI at 37.81 on the 1H chart and a strong daily ADX of 39.16. This parallel weakness suggests that the current downward pressure is affecting the precious metals complex broadly, likely driven by the same macro factors. The fact that both metals are falling despite a potentially weakening dollar narrative highlights the dominance of other forces, such as interest rate expectations and safe-haven flows being directed elsewhere, or simply a broad deleveraging across commodity markets.
The recent news regarding the acceleration of core inflation in the Eurozone to 2.5% is a significant development that reinforces the hawkish stance of the European Central Bank (ECB). This could lead to further divergence in monetary policy between the ECB and the Federal Reserve, potentially impacting the EURUSD pair. Currently trading at 1.14436, EURUSD shows mixed signals across timeframes, but the underlying inflationary pressures in the Eurozone suggest that the ECB may be forced to keep rates higher for longer, which could offer some support to the Euro against a dollar that might eventually weaken if the Fed pivots. However, for now, the dollar's strength, driven by Fed policy expectations, remains the dominant factor pressuring silver.
The energy markets, while not directly correlated with silver in the same way as the dollar, provide a broader context for inflation expectations and geopolitical risk. Brent crude is trading at $83.79 and WTI at $79.59, both showing slight declines. While oil prices have been sensitive to geopolitical events, such as the situation in Saudi Arabia, the current price action suggests that broader market sentiment and economic growth concerns are weighing more heavily. A sustained drop in oil prices could ease inflationary pressures, potentially influencing the Fed's policy decisions. However, the current geopolitical backdrop remains a wildcard, capable of quickly shifting the narrative and impacting commodity prices, including silver, through safe-haven demand.
The technical and fundamental landscape for XAGUSD points towards continued bearish pressure in the near term. The price at $56.16 is situated within a strong downtrend, with multiple indicators signaling further weakness. While minor divergences hint at potential for short-term corrections or consolidation, the overarching trend and macro-economic drivers, particularly the strong dollar and evolving Fed policy expectations, suggest that upside potential is limited. Traders should remain cautious, focusing on key support and resistance levels, and looking for confirmation before engaging in any trades that go against the dominant trend. The market is currently in a phase where risk management and adherence to technical signals are paramount.
Bearish Scenario: Downward Momentum Continues
65% ProbabilityNeutral Scenario: Consolidation Around $56.16
25% ProbabilityBullish Scenario: Short-Covering Rally
10% Probability| Indicator | Value | Signal | Interpretation |
|---|---|---|---|
| RSI (14) | 37.11 | Bearish | Neutral zone, leaning down |
| MACD Histogram | -0.25 | Bearish | Negative momentum |
| Stochastic %K | 43.73 | Bullish Divergence | Potential short-term bounce signal |
| ADX | 35.29 | Strong Trend | Confirms strong downward trend |
| Bollinger Bands | Below Middle Band | Bearish | Downward pressure evident |
Frequently Asked Questions: XAGUSD Analysis
What happens if XAGUSD breaks below the $55.97 support level this week?
A break below $55.97 would likely confirm the continuation of the bearish trend, potentially accelerating the decline towards the $55.68 support level. This would be a strong signal for short-sellers, especially if accompanied by increased volume.
Is the current RSI reading of 37.11 a sell signal for XAGUSD at $56.16?
While RSI at 37.11 is not yet oversold, it indicates bearish momentum is in play. Combined with other bearish indicators like the MACD and ADX, it supports a cautious approach, suggesting that rallies might be short-lived and selling pressure could persist.
How is the strong DXY at 100.7 impacting the XAGUSD price forecast?
The strong DXY acts as a significant headwind for XAGUSD. A higher dollar typically makes dollar-denominated commodities like silver more expensive for holders of other currencies, thus reducing demand and pressuring prices lower, as seen in the current bearish trend.
How will the Eurozone's 2.5% core inflation affect XAGUSD trading this week?
The elevated Eurozone inflation reinforces a hawkish ECB, potentially leading to monetary policy divergence with the Fed. This can create currency volatility and indirectly influence risk appetite, but for now, the dollar's strength remains the primary driver pressuring silver downwards.
Track markets in real-time
AI-powered analysis, technical indicators and real-time price data.
Join Our Telegram Channel
Breaking market news, AI analysis and trading signals instantly.
Join Channel