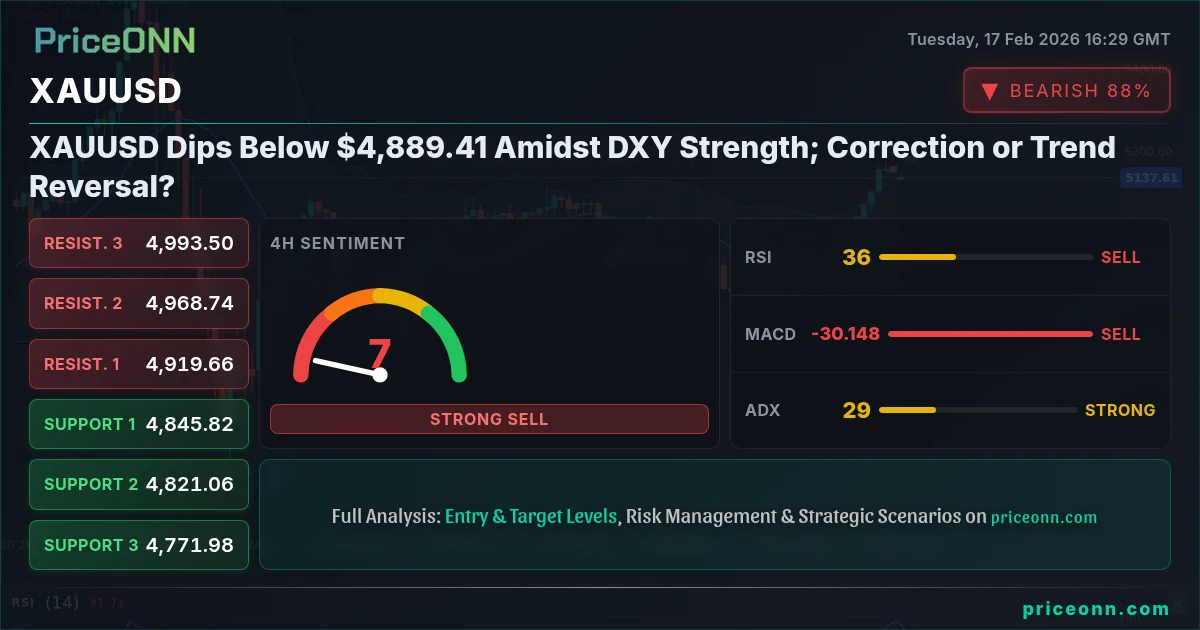
Gold has seen significant movement recently, with XAUUSD dipping below $4,889.41. As the DXY strengthens, the pressure on gold mounts, leading traders to wonder if this is a correction or a sign of a deeper trend reversal.
The current gold price at $4,889.41 reflects broader market dynamics, particularly influenced by the strength of the dollar index (DXY) at $97.04.
Market Overview
As of now, gold is trading at $4,889.41, down from its daily high of $4,900. The recent trend indicates a bearish sentiment in the market, primarily driven by the strength of the DXY, which has seen a climb to $97.04. This price movement raises critical questions about the future trajectory of XAUUSD.
Technical Analysis
Analyzing the technical indicators provides insight into the current market sentiment:
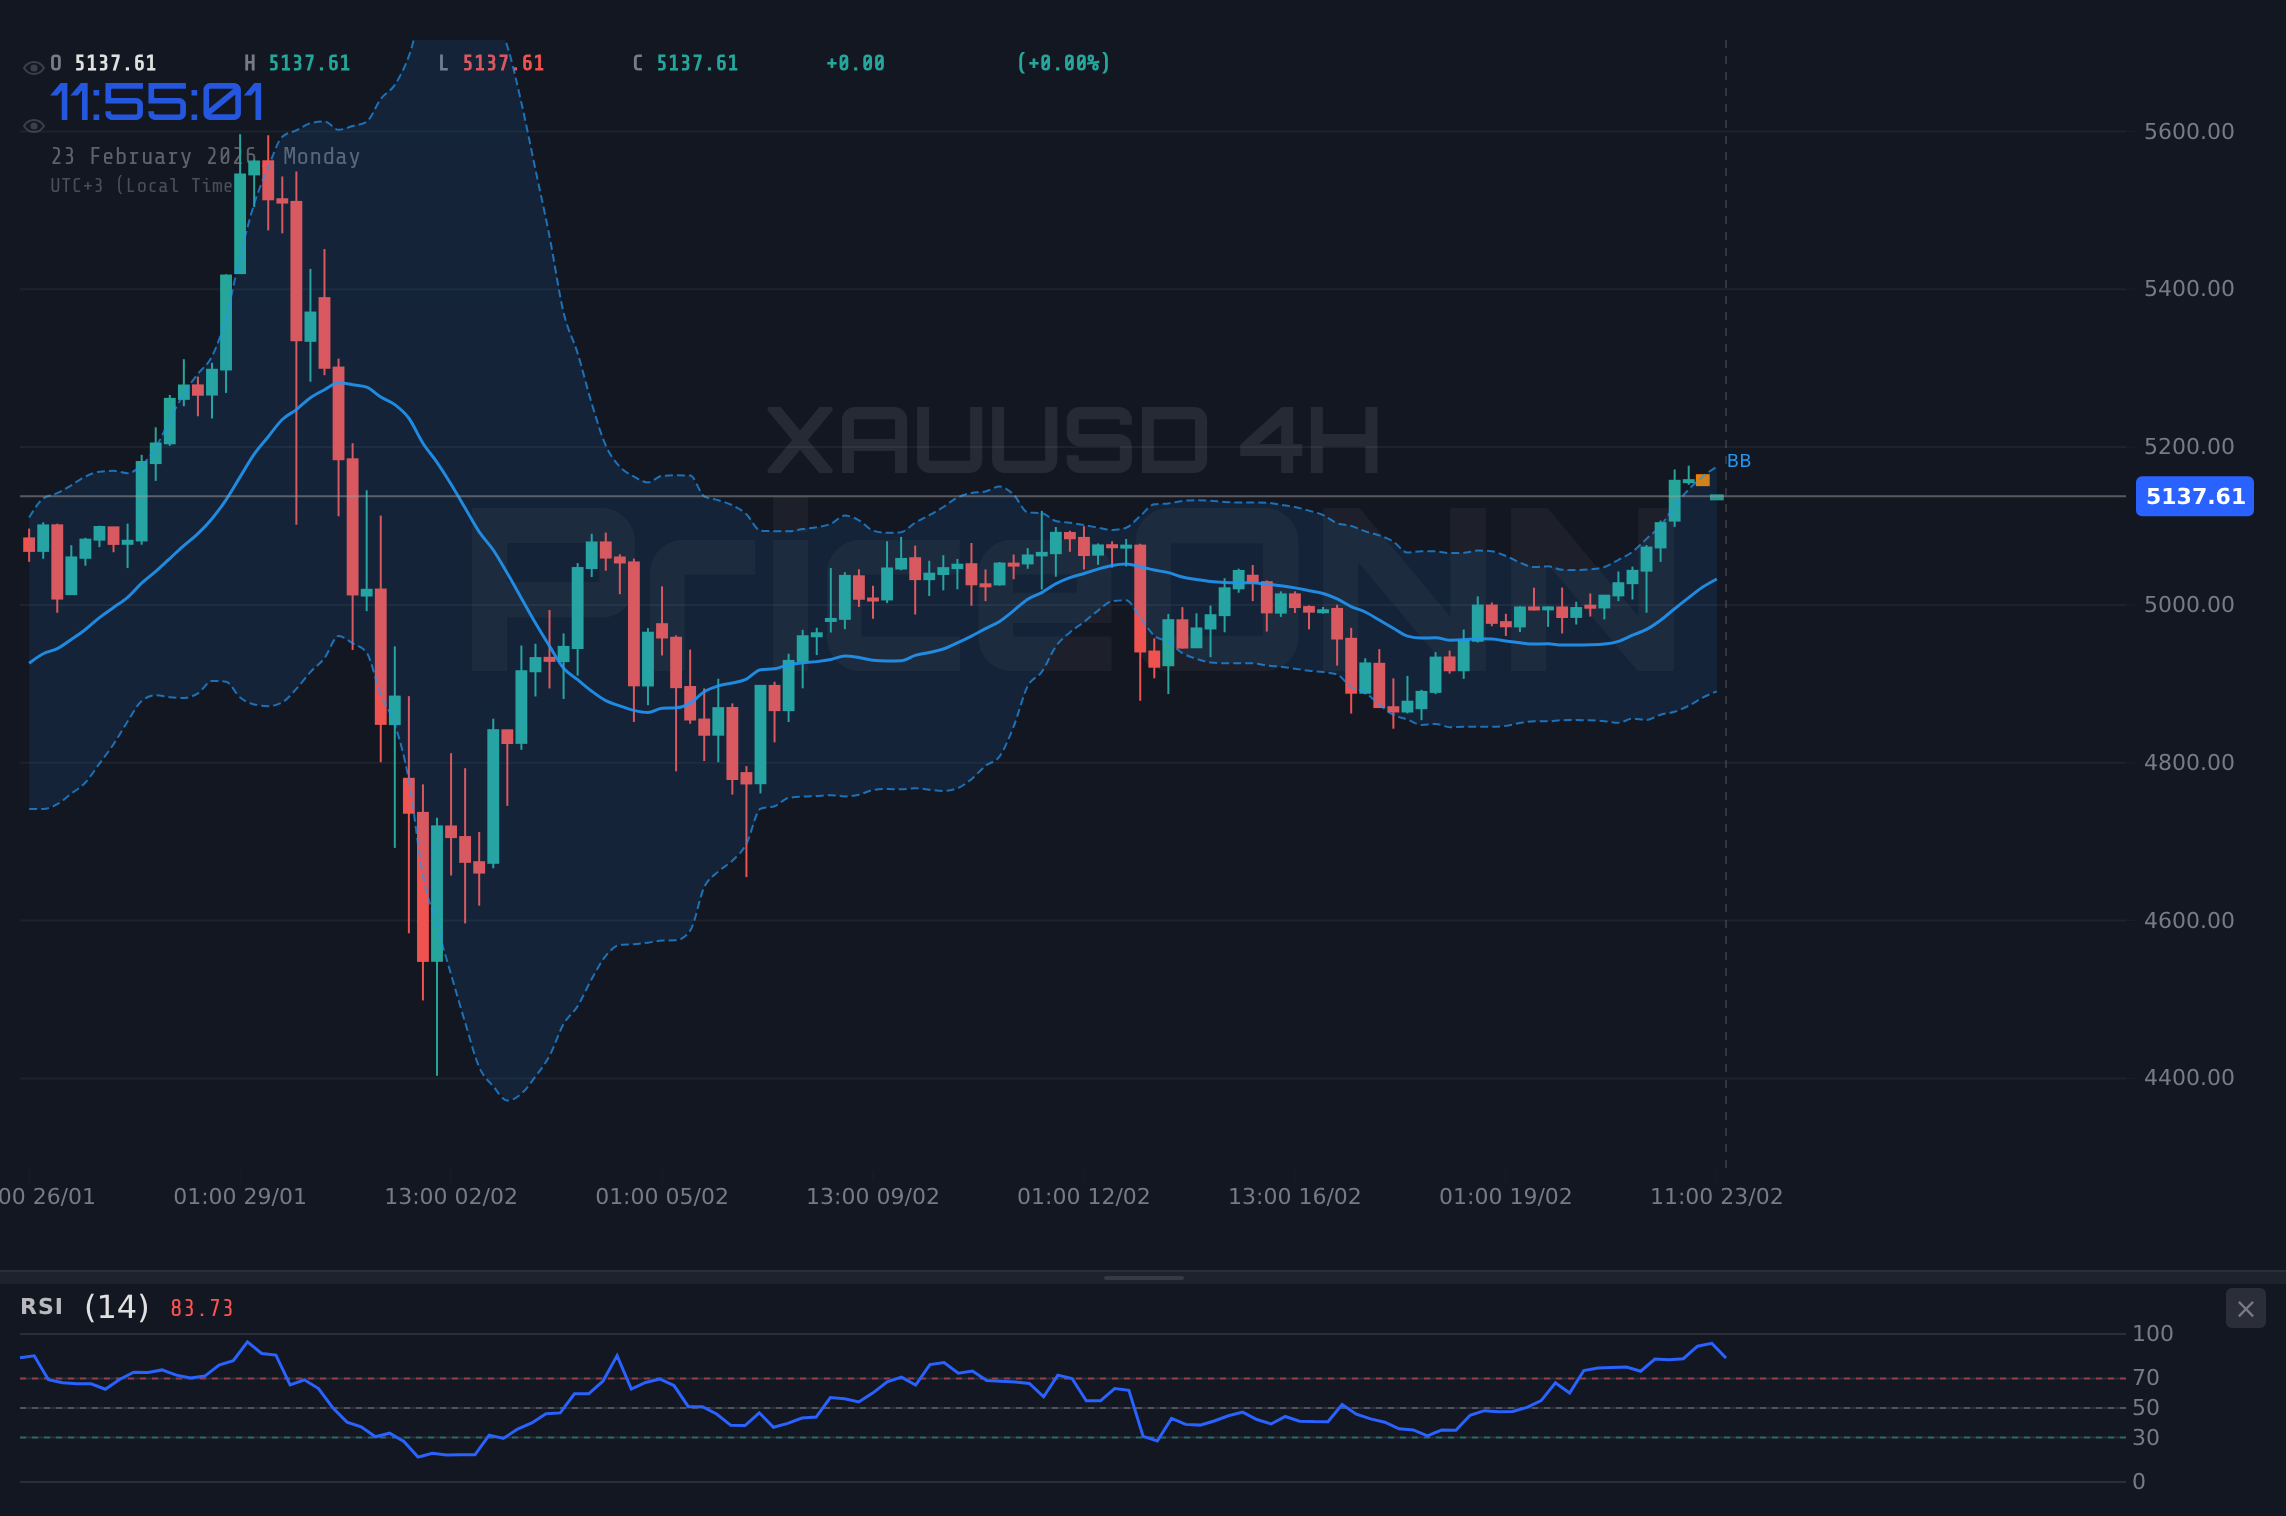
- RSI: 38.32 - indicates a neutral position, suggesting potential for further downturn.
- MACD: Negative momentum, confirmed by the MACD line sitting below the signal line.
- ADX: 41.77 - indicates a strong downward trend.
Support and Resistance Levels
Upcoming Economic Events
Trade Scenarios
Scenario A - Continuation of Downtrend
70% ProbabilityScenario B - Potential Reversal
40% ProbabilityTechnical Summary
| Indicator | Value | Signal | Interpretation |
|---|---|---|---|
| RSI (14) | 38.32 | Bearish | Downward trend |
| MACD | Negative | Bearish | Below signal line |
| ADX | 41.77 | Strong Trend | Strong bearish trend |
With careful observation, traders may find entry points that align with market conditions.
Track markets in real-time
AI-powered analysis, technical indicators and real-time price data.
Join Our Telegram Channel
Breaking market news, AI analysis and trading signals instantly.
Join Channel