

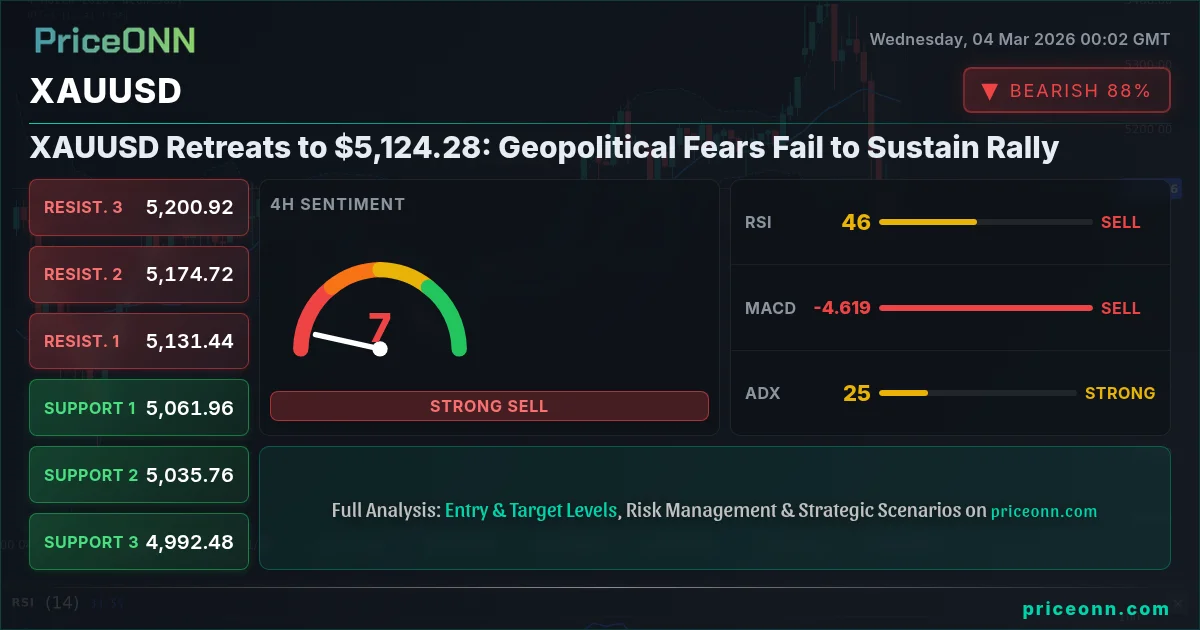
Geopolitical tensions have failed to sustain gold's rally as XAUUSD retreats to $5,124.28. Despite persistent concerns about global stability, the precious metal is facing downward pressure, prompting questions about its near-term outlook. Is this a temporary dip or the start of a more significant correction?
- RSI at 41.48 on the 1H chart suggests neutral momentum with a potential for further decline.
- Key support level at $5,077.66 needs to hold to prevent a deeper correction.
- The Stochastic oscillator showing K=51.77 and D=40.59 signals a potential bullish reversal on the 1H timeframe.
- DXY strength is negatively correlated with XAUUSD, putting downward pressure on gold.
The retreat in XAUUSD can be attributed to several factors, including a strengthening US Dollar Index (DXY) and profit-taking after a period of strong gains. The DXY, currently at 98.76, is exerting downward pressure on gold, as a stronger dollar typically makes gold less attractive to international buyers. According to Reuters, Fed officials continue to emphasize the need to remain data-dependent, contributing to dollar strength amid expectations of further policy tightening. This, in turn, is weighing on gold prices.
From a technical perspective, XAUUSD faces a mixed outlook across different timeframes. On the 1H chart, the trend is bearish with 97% strength, while the 4H chart shows a neutral trend. The daily chart, however, indicates an upward trend with 89% strength. This divergence suggests a period of consolidation or potential reversal in the near term. The 1H chart's RSI at 41.48 indicates neutral momentum, but the Stochastic oscillator showing K=51.77 and D=40.59 signals a potential bullish reversal. However, the ADX at 44.38 confirms a strong downtrend, suggesting that the bears are currently in control. Look, this level is absolutely critical.
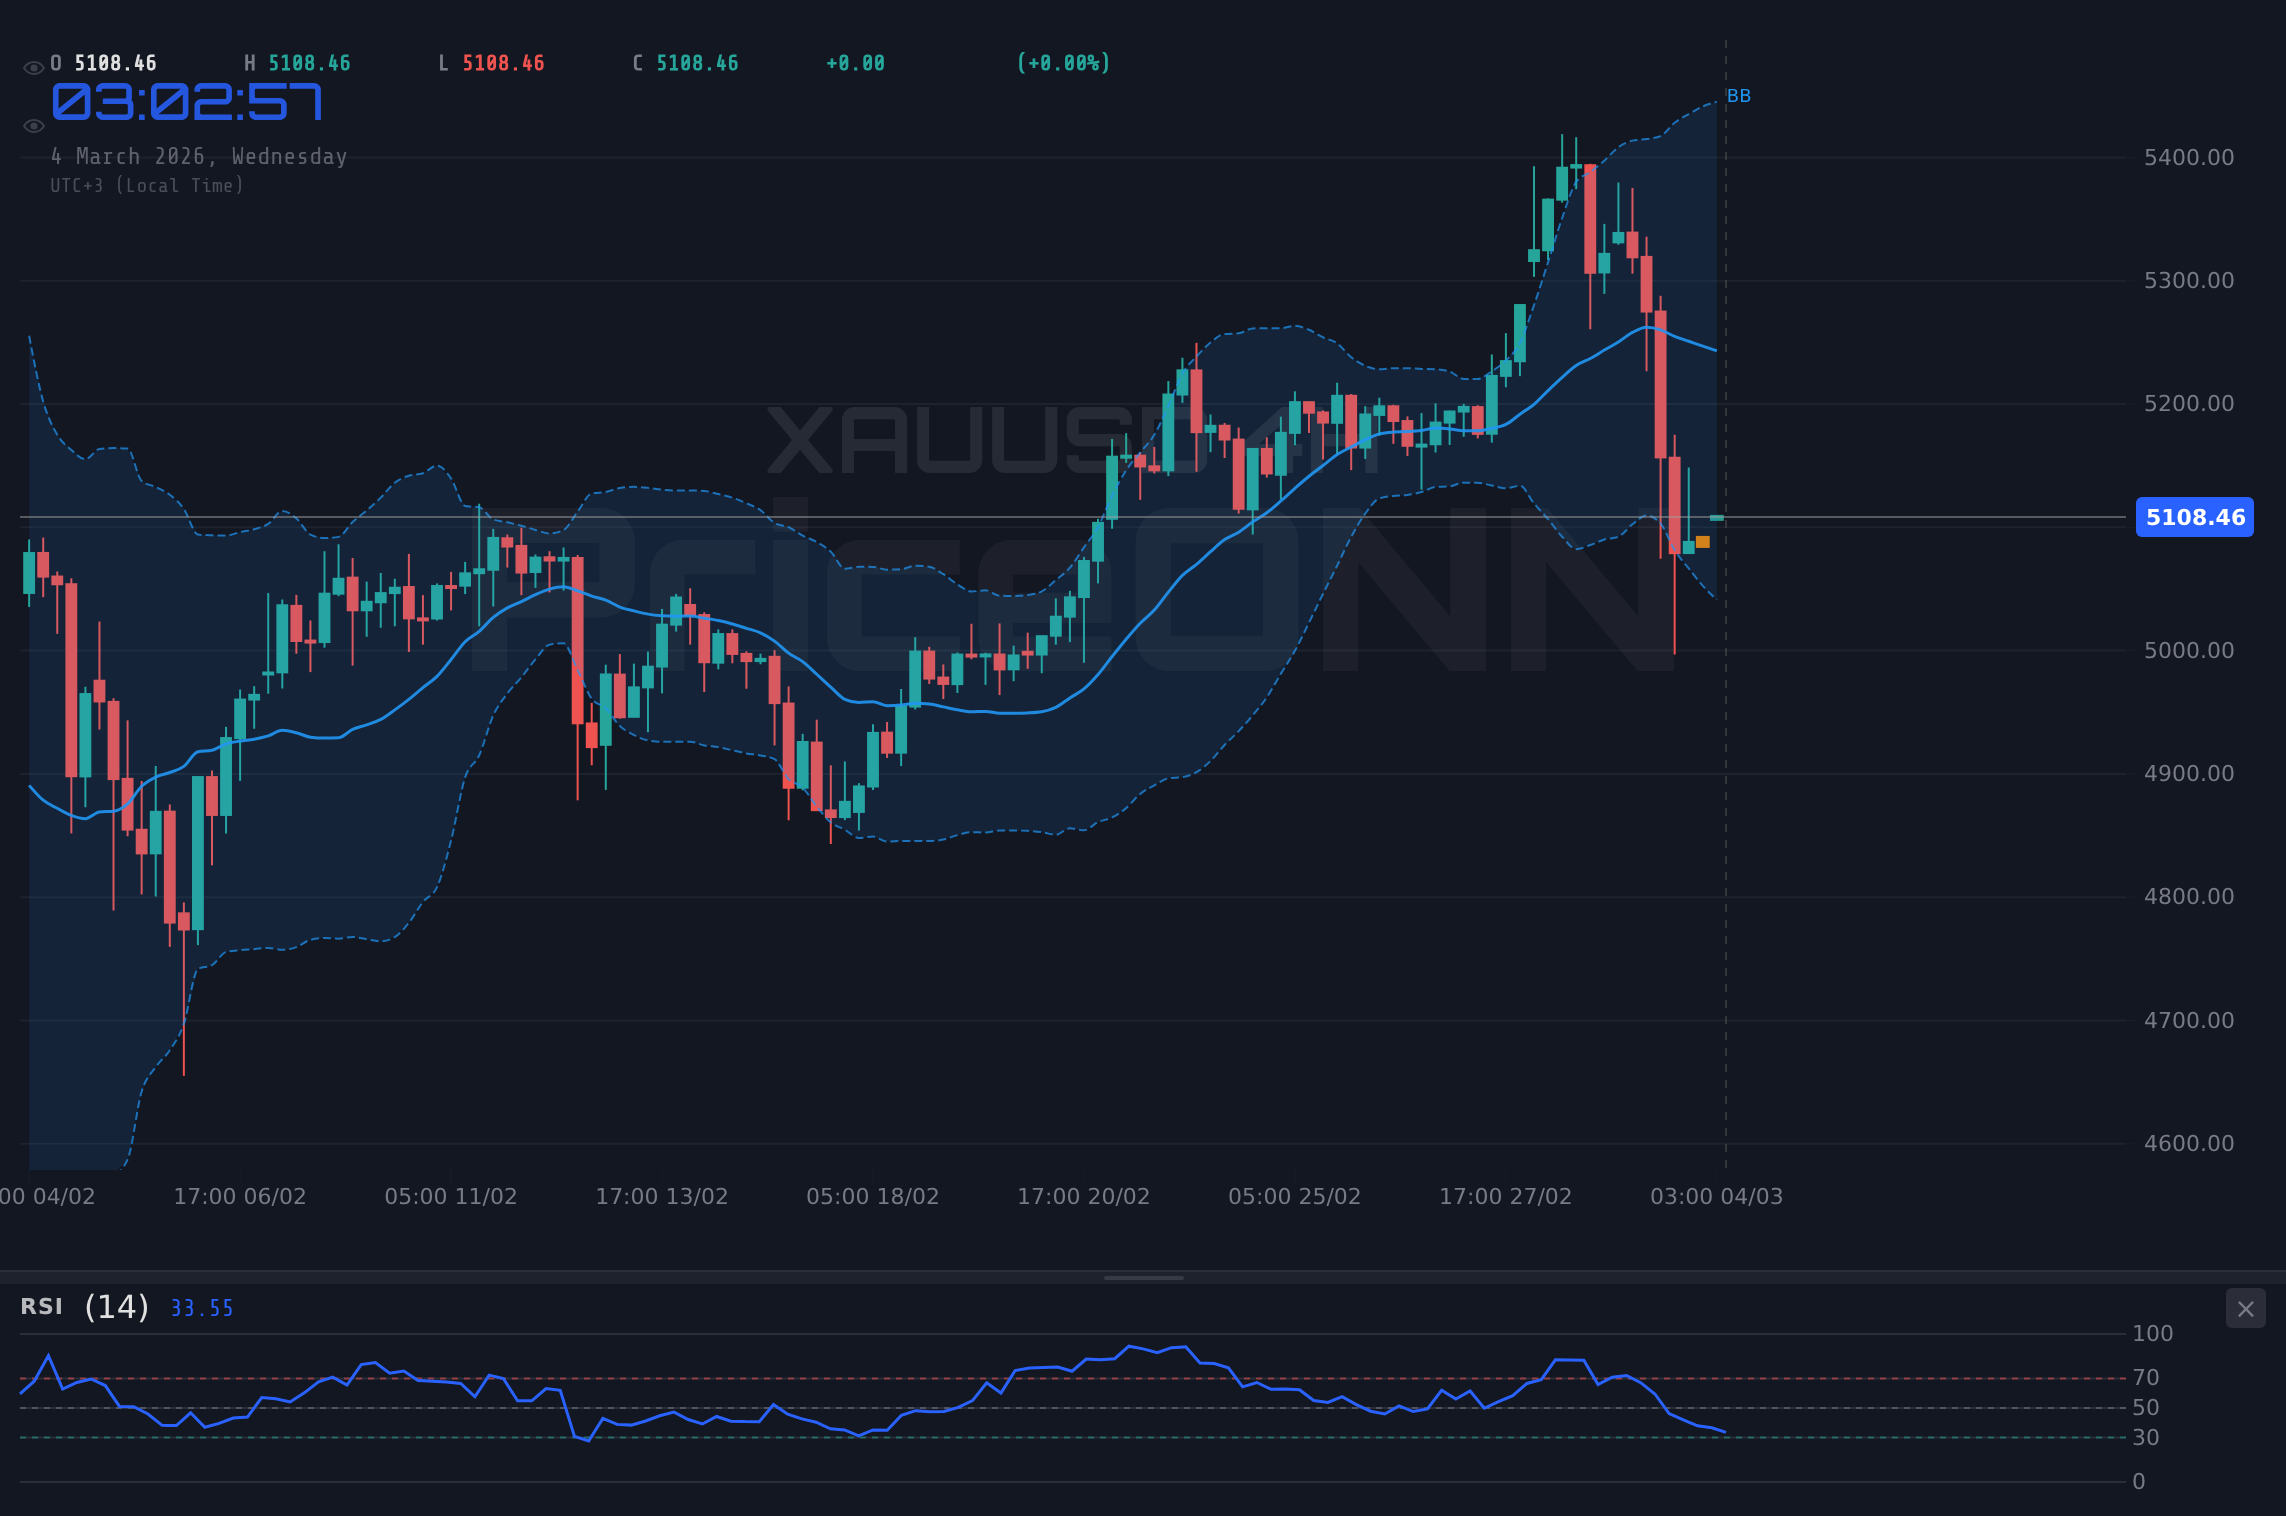
The 4H timeframe paints a more bearish picture. The RSI at 39.64 is in neutral territory, while the MACD histogram shows negative momentum. The Stochastic oscillator shows K=24.57 and D=40.23, indicating oversold conditions and a potential for a short-term bounce. However, the ADX at 24.82 confirms a moderate downtrend. Key support levels to watch are $4,992.22, $4,905.42, and $4,813.99. Until the NFP data resolves this, caution is warranted.
On the daily chart, XAUUSD remains in an uptrend, but there are signs of weakening momentum. The RSI at 53.93 is in neutral territory, but the Stochastic oscillator shows K=72.78 and D=83.42, indicating overbought conditions and a potential for a pullback. The ADX at 17.99 suggests a weak trend, meaning the breakout hasn't committed yet - it could go either way. Key resistance levels to watch are $5,406.93, $5,492.04 and $5,565.19. Now this is where it gets interesting!
The upcoming U.S. ADP Nonfarm Employment Change data on Wednesday (March 4th) will be closely watched for further clues about the strength of the U.S. economy. A stronger-than-expected reading could further strengthen the dollar and put additional downward pressure on gold. Reuters's news indicates that the U.S. Services Purchasing Managers Index (PMI) and ISM Non-Manufacturing Prices, also due on Wednesday, will provide insights into the service sector and inflationary pressures. Furthermore, Thursday's U.S. Initial Jobless Claims and Friday's U.S. Retail Sales MoM data will offer a comprehensive view of the labor market and consumer spending. Be bold when the market is fearful, cautious when euphoric-this golden rule applies today.
Geopolitical tensions continue to simmer, providing a potential tailwind for gold. Rising tensions in the Middle East, as highlighted by recent reports of increased tanker rates due to Hormuz Strait tensions, could drive safe-haven demand for gold. However, the strengthening dollar and profit-taking seem to be outweighing these concerns for now. Manage your risk, wait for your setup-the market always gives a second chance.
The key support level to watch is $5,077.66. A break below this level could trigger a deeper correction towards $4,992.22. On the upside, immediate resistance is at $5,104.45, followed by $5,120.72 and $5,131.24. A sustained move above $5,131.24 would negate the bearish outlook and open the door for a retest of recent highs. Patience looks like it will be rewarded here.
XAUUSD breaks above the $5,131.24 resistance, driven by renewed geopolitical fears or a weaker-than-expected U.S. economic data release. Continued strength could target $5,406.93.
XAUUSD fails to hold $5,077.66 support, leading to a sharp correction towards $4,992.22, as the dollar continues to strengthen and risk appetite declines.
Key Levels
Support Levels
Resistance Levels
Technical Outlook Summary
| Indicator | Value | Signal |
|---|---|---|
| RSI (14) | 41.48 | Neutral |
| MACD Histogram | Negative | Bearish |
| Stochastic | K=51.77, D=40.59 | Bullish |
| ADX | 44.38 | Strong Downtrend |
| Bollinger | Middle Band | Below |
Frequently Asked Questions: XAUUSD Analysis
Is XAUUSD a good buy right now?
XAUUSD is currently trading at $5,124.28. While geopolitical tensions provide some support, a strengthening dollar and mixed technical signals suggest caution. Wait for a break above $5,131.24 or a hold above $5,077.66 before considering a long position.
What is the XAUUSD price forecast for this week?
The XAUUSD price forecast for this week is uncertain. A break above $5,131.24 could lead to a retest of $5,406.93, while a break below $5,077.66 could trigger a move towards $4,992.22. The probability of either scenario depends on upcoming economic data and geopolitical developments.
What are the key support and resistance levels for XAUUSD?
Key support levels for XAUUSD are $5,077.66, $4,992.22, and $4,905.42. Key resistance levels are $5,104.45, $5,120.72, and $5,131.24. These levels represent potential areas of buying or selling pressure.
Why is XAUUSD moving today?
XAUUSD is moving today due to a combination of factors, including a strengthening dollar, profit-taking after recent gains, and mixed technical signals. Upcoming economic data releases and geopolitical developments will likely influence further price action.
Track markets in real-time
AI-powered analysis, technical indicators and real-time price data.
Join Our Telegram Channel
Breaking market news, AI analysis and trading signals instantly.
Join Channel