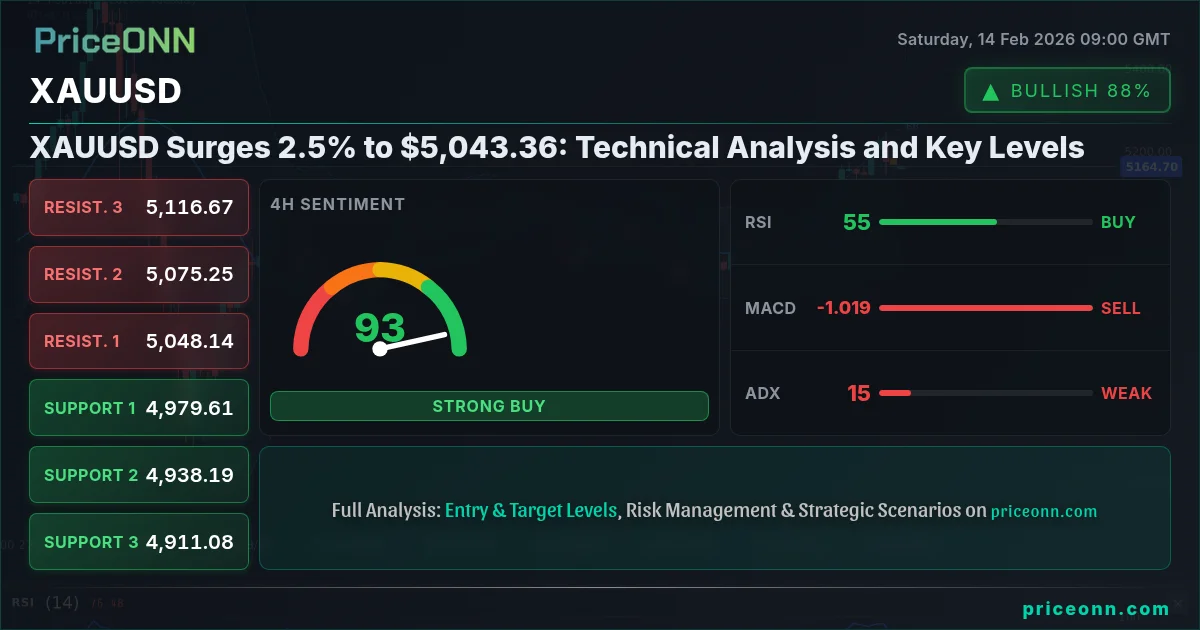
Gold prices have seen a significant surge, currently trading at $5,043.36. This impressive increase of 2.5% indicates strong bullish momentum in the market. As we dive deeper into the technical analysis, it’s crucial to assess the key levels that could influence trading decisions.
With XAUUSD currently at $5,043.36, the market shows signs of bullish momentum supported by various technical indicators.
Current Market Overview
The gold market has been notably influenced by various economic factors, including the current trends in the DXY index and geopolitical developments. As the DXY (Dollar Index) faces pressure, we have seen a corresponding rise in gold prices, as investors seek safe-haven assets.
Technical Analysis
In analyzing the XAUUSD price action, we note several critical levels:
- Current Price: $5,043.36
- Daily Change: +2.5%
- Daily Range: $4,887.04 - $5,045.95
Key Technical Indicators
Support and Resistance Levels
Upcoming Economic Events
Trade Plan
Trade Plan
Scenario A: Continuation of Uptrend (Main)
- Direction: Long
- Entry Trigger: Close above $5,060
- Target 1: $5,080 (~0.7% upside)
- Target 2: $5,100 (~1.1% upside)
- Stop / Invalidation: Close below $5,017
Scenario B: Pullback (Alternative)
- Condition: Support holds at $5,017
- Entry Trigger: Close above $5,040 with volume increase
- Target: $5,052
- Invalidation: Close below $5,010
News Risk: Volatility may increase ahead of CPI data on February 15. Consider reducing position size.
Technical Summary
| Indicator | Value | Signal | Interpretation |
|---|---|---|---|
| RSI (14) | 61.83 | Neutral | Indicates potential for upward movement |
| MACD | Positive | Bullish | Indicates strong positive momentum |
| ADX | 22.34 | Medium Trend | Indicates a moderate trend strength |
Conclusion
As we analyze the market dynamics, it’s clear that XAUUSD presents both risks and opportunities. Investors should remain vigilant and ready to adapt to changing conditions. The current price of $5,043.36 reflects a robust bullish sentiment, but caution is warranted as we await further economic data.
Track markets in real-time
AI-powered analysis, technical indicators and real-time price data.
Join Our Telegram Channel
Breaking market news, AI analysis and trading signals instantly.
Join Channel