

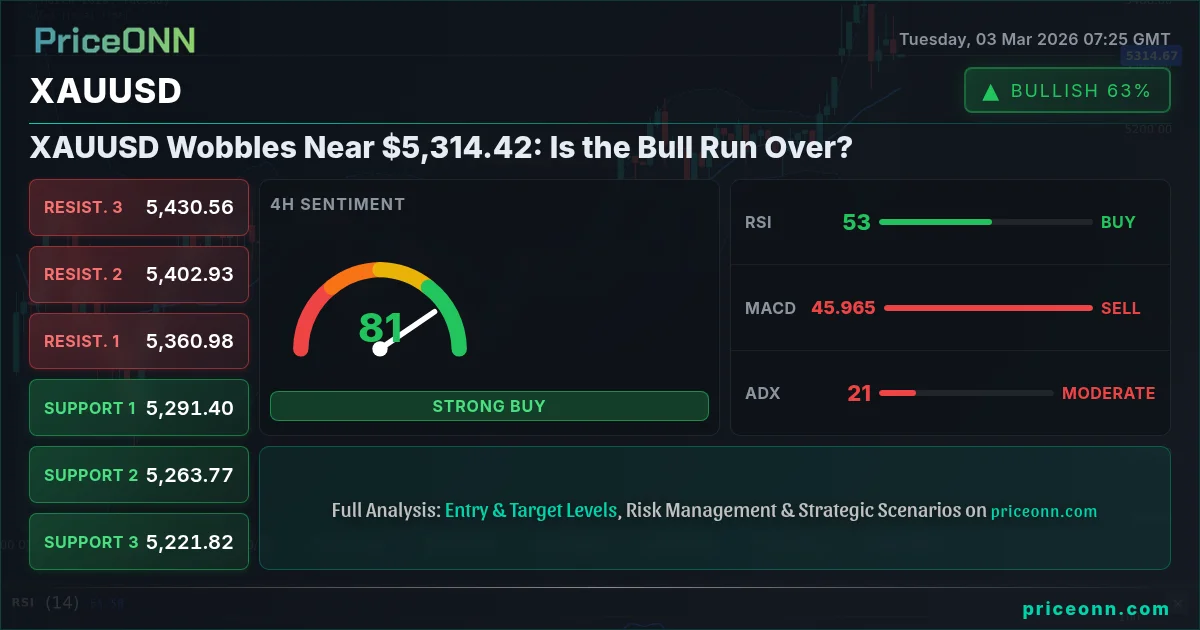
Gold just showed a sign that the bulls are losing steam, with XAUUSD currently wobbling near $5,314.42. With the dollar index (DXY) strengthening and risk appetite waning, is the rally over, or is this just a temporary pause before the next leg up? Let's dig into the technicals and fundamentals to find out what's really going on.
- RSI at 45.57 on the 1H chart suggests waning bullish momentum.
- Key support level to watch is $5,294.27, a break below could signal further downside.
- MACD on the 1H chart shows negative momentum, indicating a potential trend reversal.
- DXY strength is putting pressure on XAUUSD, reinforcing the bearish outlook.
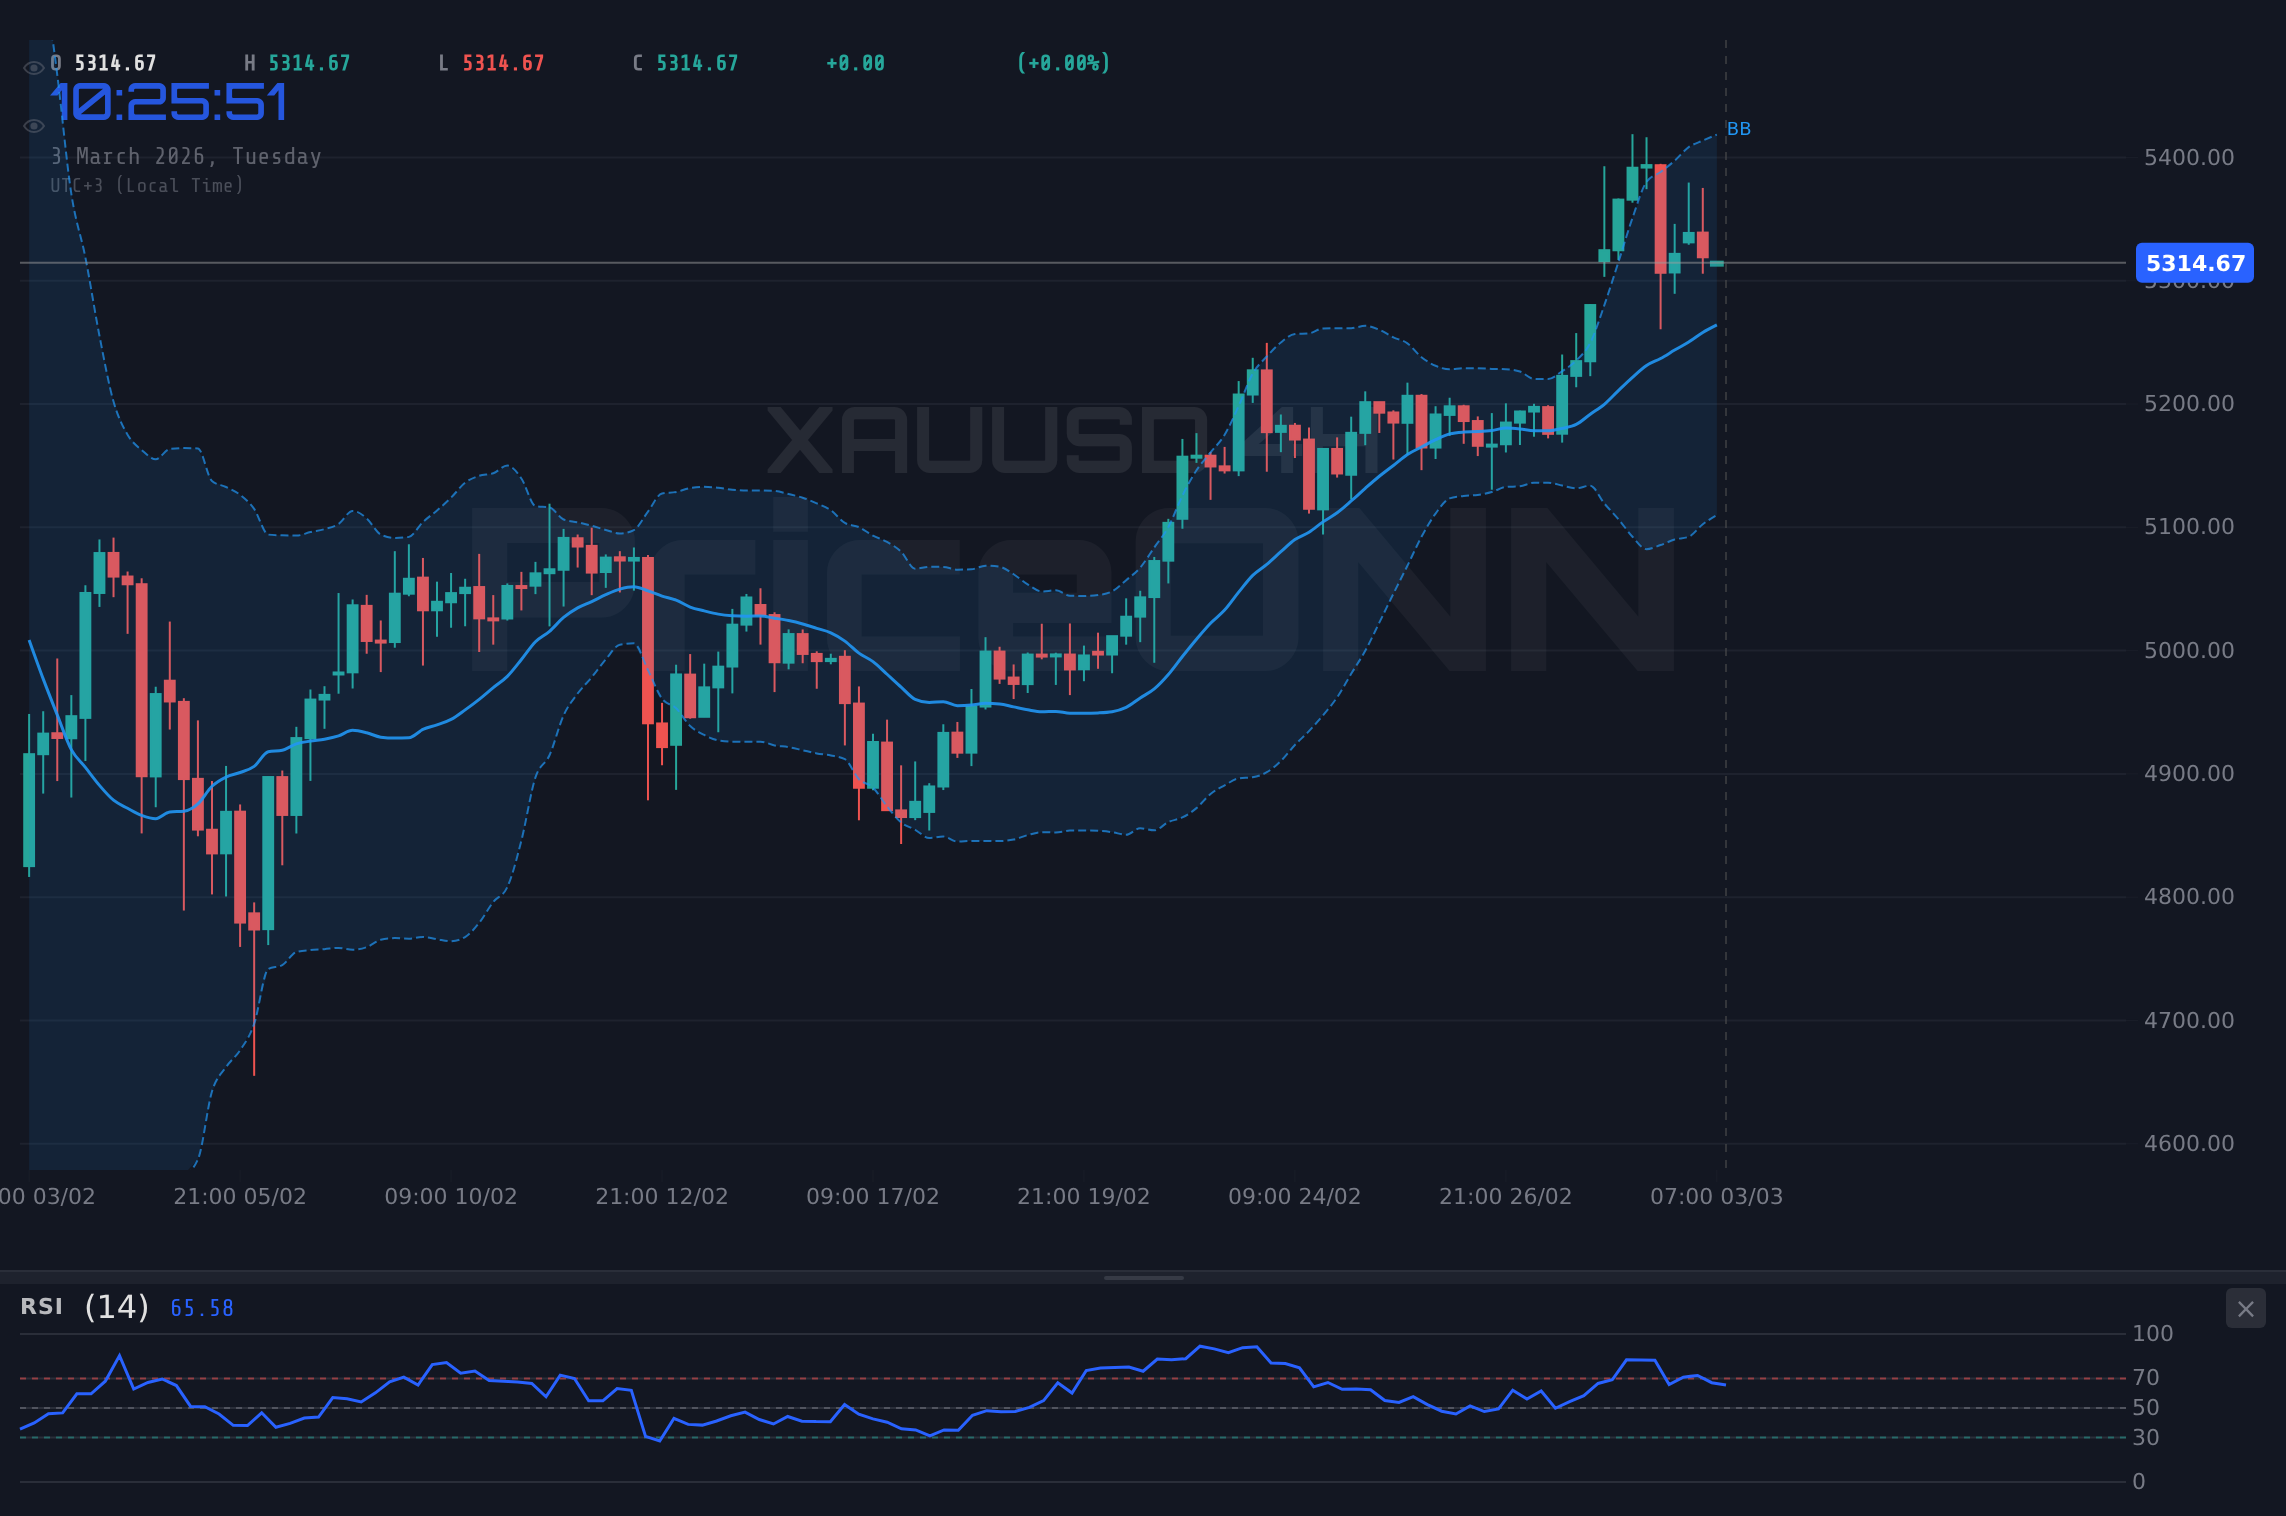
The recent price action in XAUUSD has been choppy, to say the least. After a strong rally that pushed gold to multi-year highs, the market seems to be taking a breather. The question now is whether this is just a pause before the next push higher, or the start of a more significant correction. The technical picture is mixed, but there are some signs that the bulls may be losing control. On the 1-hour chart, the Relative Strength Index (RSI) sits at 45.57, indicating that the market is no longer overbought and has potential to move lower. The Moving Average Convergence Divergence (MACD) histogram is also showing negative momentum, suggesting that the bears are starting to gain traction. If sellers can push gold below the 5294.27 support level, we could see a test of the next support levels at 5269.49 and 5233.28.
However, it's not all doom and gloom for the bulls. The 4-hour and daily charts still show an overall uptrend, with the price trading above its 200-day moving average. The daily RSI is at 62.78, which is still in bullish territory, but showing signs of fatigue. Furthermore, the daily MACD is still positive, suggesting that the long-term trend remains intact. So, what does this mean for traders? It means that we're at a critical juncture, and the next few days could be decisive. Watch the key support and resistance levels closely, and be prepared to adjust your strategy based on how the market reacts.
One factor that's weighing on gold is the strength of the US dollar. The Dollar Index (DXY) is currently trading at 98.41, up 0.19% on the day. A stronger dollar typically puts downward pressure on gold, as it makes the metal more expensive for buyers using other currencies. The DXY is being supported by expectations that the Federal Reserve will continue to raise interest rates in the coming months. Robust US economic data, like a strong ISM Manufacturing PMI (52.3 forecast), reinforces this view. According to Reuters, Fed officials have recently emphasized that inflation remains 'stubbornly high' and that further rate hikes may be necessary to bring it under control.
Geopolitical tensions are also playing a role in the gold market. Escalating tensions in the Middle East, triggered by US-Israel actions against Iran, have boosted the US dollar as a safe haven, according to recent forex analysis. However, gold is also traditionally seen as a safe haven asset, so these tensions could provide some support for prices. News about the potential death of Khamenei and fears over the Strait of Hormuz may also add volatility to the market, as highlighted by Silver Price Monday Forecast.
Taking a look at the broader market context, the SP500 is currently trading at 6814.2, down 0.86% on the day. Risk aversion is increasing as investors worry about the impact of higher interest rates on economic growth. This risk-off sentiment could provide some support for gold, as investors seek out safe haven assets. However, if the stock market continues to decline, it could also trigger a wave of liquidation that drags gold prices lower. The Nasdaq100 is also down significantly, at 24693.76, further confirming the risk-off mood prevailing in the market.
Now, let's talk about some key technical levels to watch. On the downside, the first support level is at 5294.27. A break below this level could trigger a move towards the next support at 5269.49. On the upside, the first resistance level is at 5355.26. A break above this level could open the way for a test of the next resistance at 5391.47. For swing traders, a break of either of these levels could provide a high-probability trading opportunity. Scalpers should focus on trading within the range, taking profits at key support and resistance levels. Long-term investors should remain patient and wait for a clearer signal before adding to their positions.
From a historical perspective, gold has often acted as a hedge against inflation and economic uncertainty. During periods of high inflation, investors have flocked to gold as a store of value, driving prices higher. In the 1970s, for example, gold prices soared as inflation spiraled out of control. Similarly, during the global financial crisis of 2008, gold prices surged as investors sought out safe haven assets. Whether this pattern will repeat itself remains to be seen, but the current economic environment suggests that gold could continue to play an important role in investment portfolios.
The ADX (Average Directional Index) on the 1-hour chart is at 23.62, indicating a moderate downtrend. This suggests that the current pullback may have some legs, and traders should be cautious about trying to pick a bottom. The Stochastic oscillator is also showing a bearish signal, with %K at 41.41 and %D at 68.67. This confirms the view that the bears are currently in control. However, it's important to remember that technical indicators are not always accurate, and they should be used in conjunction with other forms of analysis. The 4H ADX is at 22.44, indicating a moderate uptrend, creating a conflicting signal. The daily ADX, however, is at 20.04, reinforcing the bullish trend on the longer timeframe.
The gold market is currently caught in a tug-of-war between bullish and bearish forces. On the one hand, we have a strengthening dollar, rising interest rates, and a potential economic slowdown. On the other hand, we have geopolitical tensions, inflation concerns, and safe haven demand. The technical picture is mixed, with some indicators suggesting a pullback and others pointing to further upside. The key to success in this market will be to remain flexible, manage your risk, and wait for high-probability trading opportunities to emerge.
XAUUSD breaks above the $5,355.26 resistance, fueled by renewed safe-haven demand and a weakening dollar. Targets: $5,391.47 and $5,416.25.
XAUUSD falls below the $5,294.27 support, pressured by a strengthening dollar and easing geopolitical tensions. Targets: $5,269.49 and $5,233.28.
Technical Outlook Summary
| Indicator | Value | Signal |
|---|---|---|
| RSI (14) | 45.57 | Neutral |
| MACD Histogram | Negative | Bearish |
| Stochastic | K=41.41, D=68.67 | Bearish |
| ADX | 23.62 | Moderate Trend |
| Bollinger | Middle Band | Watch |
Key Levels
Support Levels
Resistance Levels
Frequently Asked Questions: XAUUSD Analysis
Is XAUUSD a good buy right now?
At the current price of $5,314.42, XAUUSD presents a mixed picture. With the 1H RSI at 45.57, the market is not yet oversold, and the MACD shows negative momentum, so caution is warranted. A buy signal would be confirmed on a break above $5,355.26.
What is the XAUUSD price forecast for this week?
The XAUUSD price forecast for this week is highly dependent on the dollar's strength and geopolitical developments. If the DXY continues to rise, gold could test support at $5,269.49. Conversely, renewed safe-haven demand could push gold towards $5,391.47.
What are the key support and resistance levels for XAUUSD?
Key support levels for XAUUSD are $5,294.27, $5,269.49, and $5,233.28. Key resistance levels are $5,355.26, $5,391.47, and $5,416.25. These levels should be closely monitored for potential breakout or breakdown signals.
Why is XAUUSD moving today?
XAUUSD is moving today due to a combination of factors, including a strengthening dollar, increasing risk aversion in the stock market (SP500 -0.86%), and ongoing geopolitical tensions. The stronger DXY is putting downward pressure on gold, while safe haven demand offers some support.
So, what's the actionable insight here? The key is to watch the $5,294.27 level. If XAUUSD breaks below this level, it's likely that the bears will gain control, and we could see a more significant correction. On the other hand, if the bulls can defend this level and push the price back above $5,355.26, it would signal that the uptrend is still intact. Patience looks like it will be rewarded here. Manage your risk, wait for your setup- the market always gives a second chance.
Track markets in real-time
AI-powered analysis, technical indicators and real-time price data.
Join Our Telegram Channel
Breaking market news, AI analysis and trading signals instantly.
Join Channel