

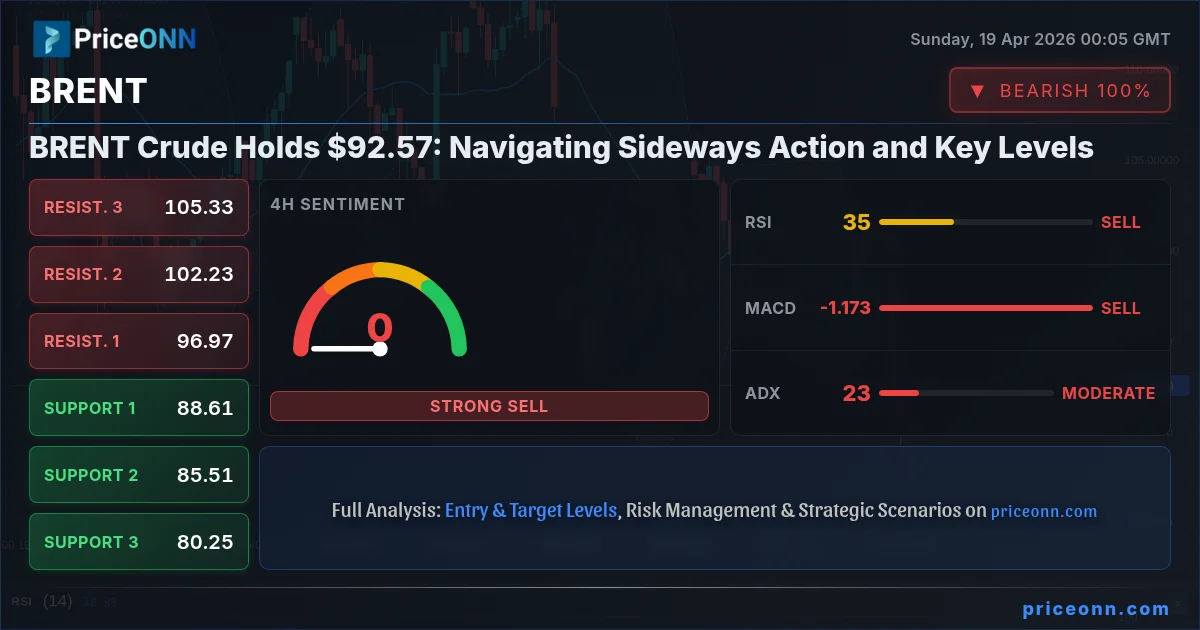
Brent Crude is currently trading around the critical $92.57 mark, a level that has seen considerable attention as the market navigates a period of sideways action following a sharp decline. Last week's price action was a tale of two halves, with significant volatility driven by geopolitical shifts and shifting supply expectations. The question on every trader's mind is whether this consolidation phase is a precursor to a renewed trend or simply a pause before further downside, making the upcoming week's price action and fundamental catalysts paramount.
- BRENT Crude is consolidating around $92.57 after a sharp weekly decline.
- Critical support is identified at $88.61, with resistance overhead at $96.97.
- Geopolitical easing, particularly concerning the Strait of Hormuz, has temporarily capped oil prices, but supply disruption risks remain.
- The ADX at 37.6 on the 1H chart indicates strong downward momentum, while the 1D ADX at 34.16 suggests a strong downtrend is in play, despite short-term consolidation.
The Volatile Week That Was: From Peaks to Consolidation
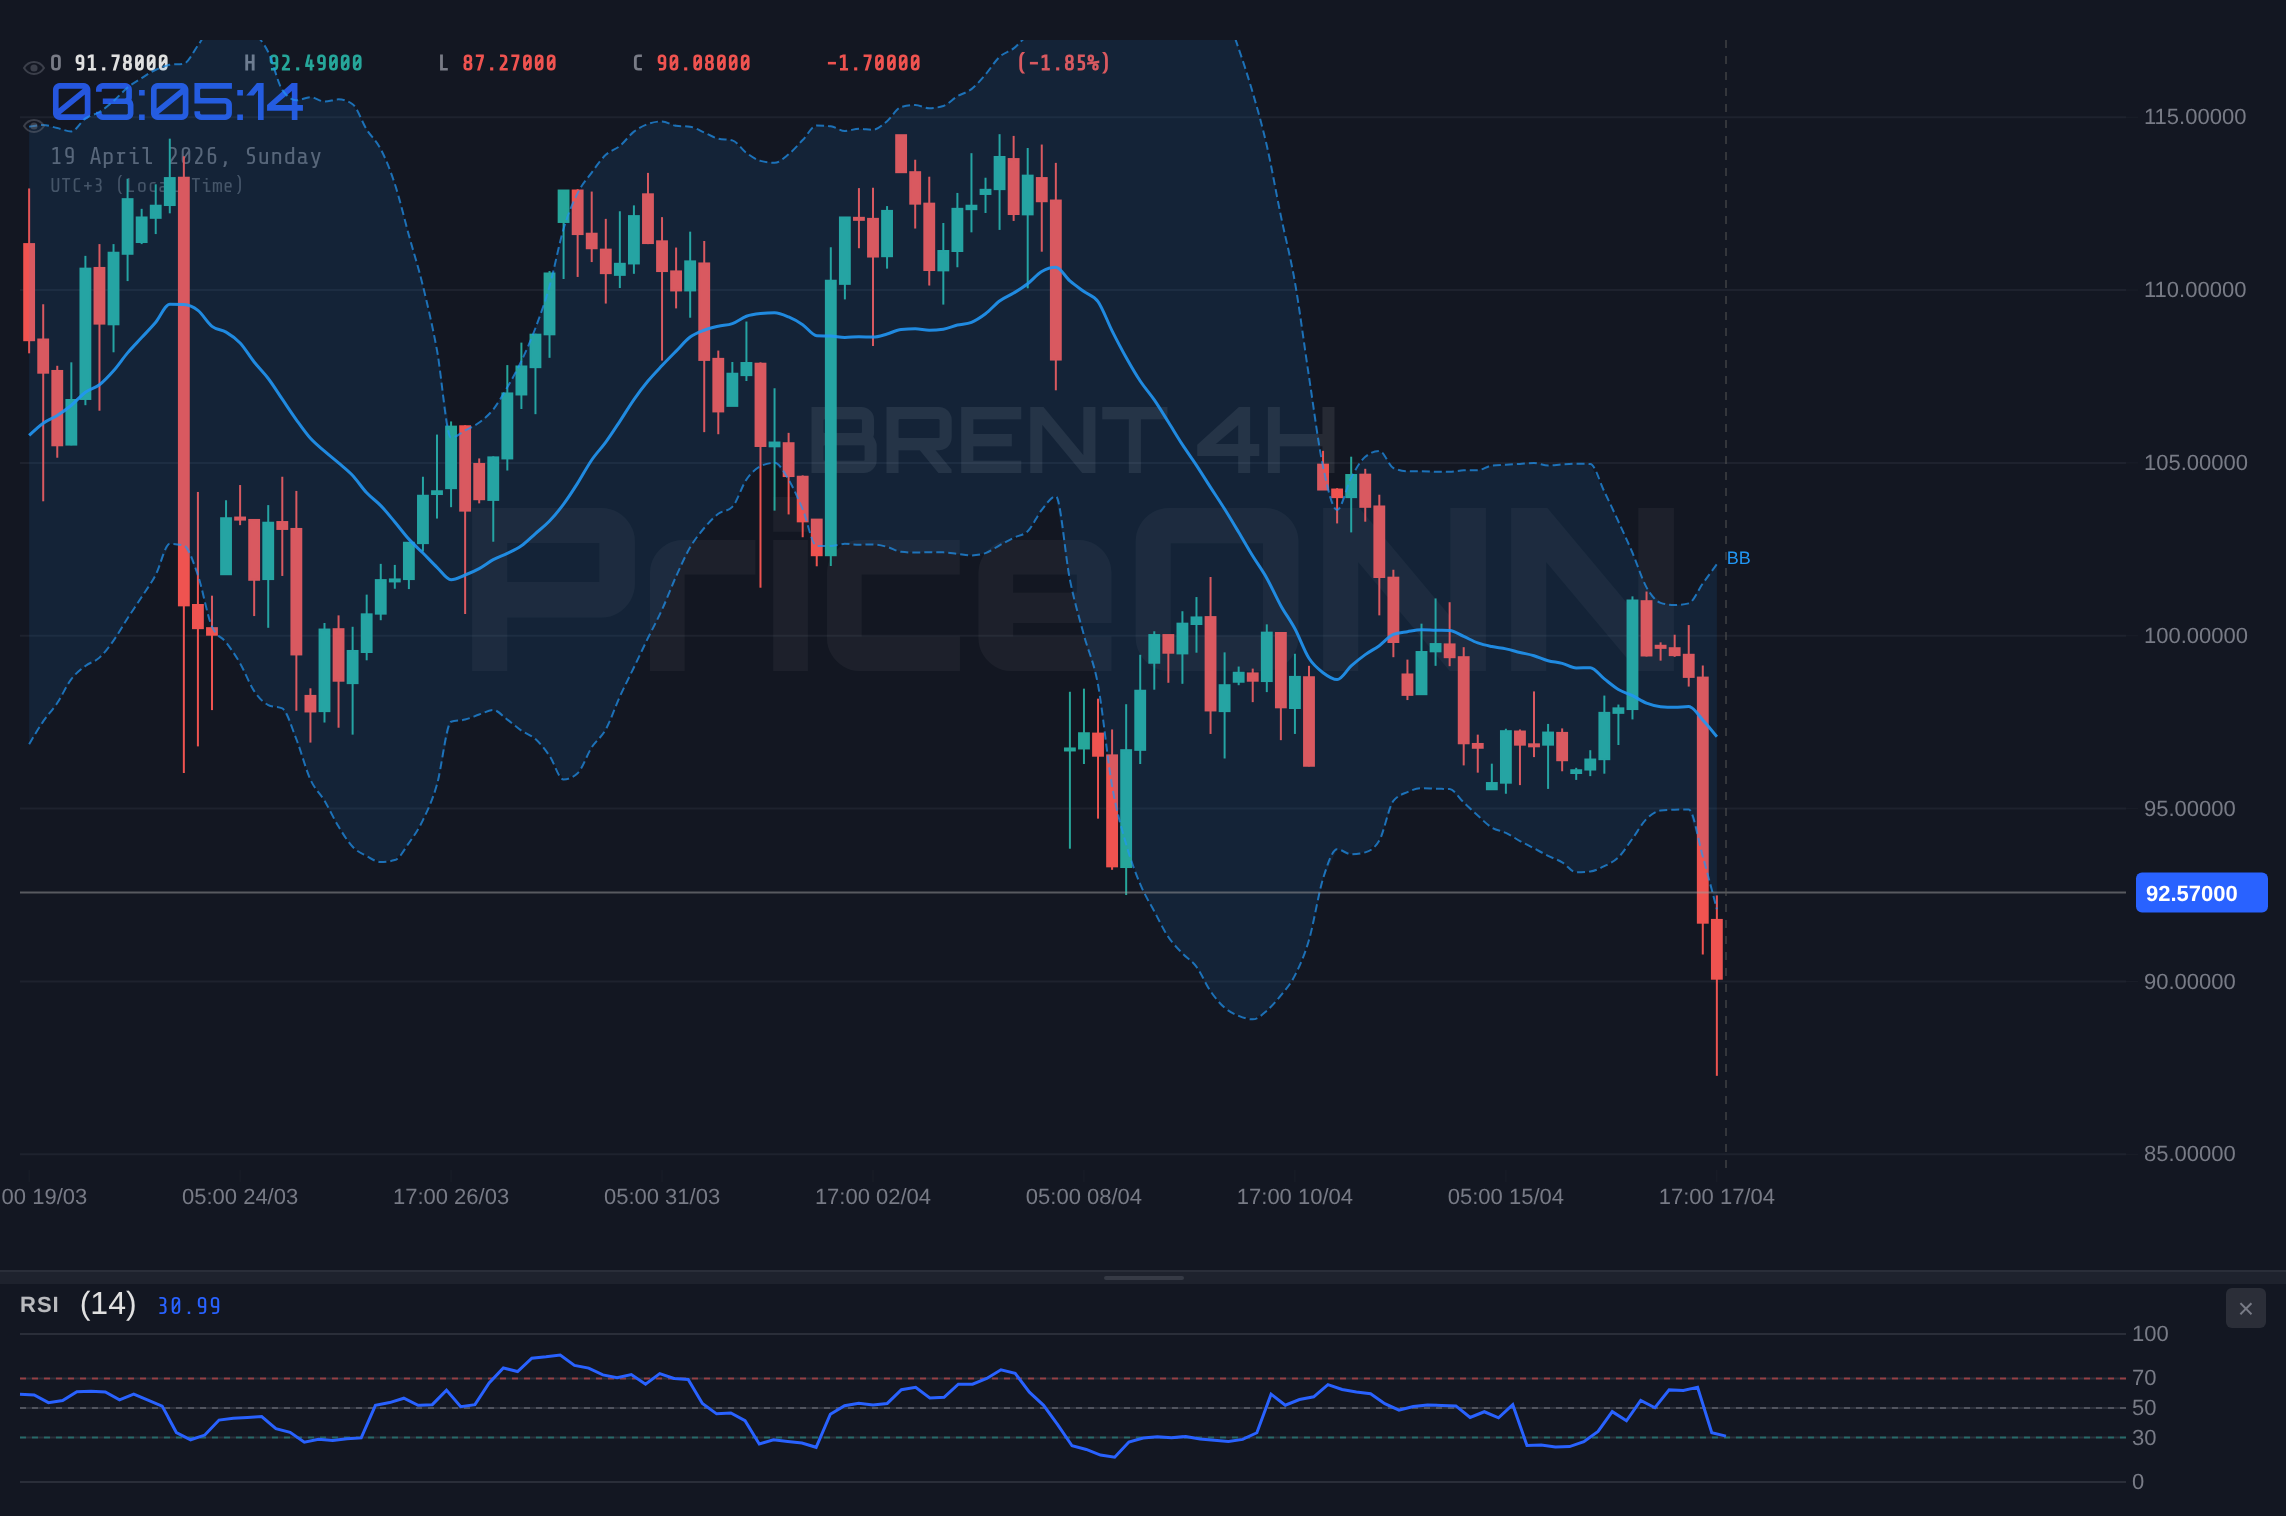
Last week was a rollercoaster for Brent Crude futures. After touching highs that briefly flirted with the $100 per barrel mark, driven by escalating geopolitical tensions and fears of supply chain disruptions, particularly concerning the Strait of Hormuz, prices experienced a dramatic reversal. The market's narrative shifted abruptly when Iran announced a temporary reopening of the strait, coupled with signals of potential diplomatic de-escalation. This news acted as a significant catalyst, sending Brent prices plummeting by approximately 10% within a short period. The sharp decline erased previous gains and brought the price back to the $92.57 level, highlighting the market's sensitivity to perceived geopolitical risk premiums.
This volatility underscores the delicate balance in the oil market. While supply fears can rapidly propel prices higher, any sign of de-escalation or improved supply outlook can trigger sharp corrections. The swiftness of the reversal suggests that much of the recent upward move was driven by fear and speculation rather than a fundamental shift in the physical supply-demand balance. Traders who had positioned for further upside were caught off guard, leading to forced liquidations and amplifying the downward move. This price action serves as a stark reminder of the inherent risks in commodity trading, where geopolitical events can override longer-term fundamental trends.
The price action also revealed potential weaknesses in the bullish case that had emerged prior to the geopolitical scare. While demand indicators had shown some signs of resilience, the market's reaction to the perceived easing of tensions suggests that underlying demand may not have been strong enough to sustain prices at significantly higher levels without the support of geopolitical risk. This leaves Brent in a precarious position, caught between lingering supply disruption concerns and a potentially softening demand outlook.
Fundamental Drivers: Supply vs. Demand Dynamics
The recent price swings in Brent Crude are a clear manifestation of the ongoing tug-of-war between supply-side factors and demand-side considerations. On the supply front, the market remains acutely sensitive to any potential disruptions. The events surrounding the Strait of Hormuz, a critical chokepoint for global oil supply, demonstrated this vividly. While the immediate threat appears to have receded, the underlying geopolitical tensions in the Middle East remain a significant overhang. Any renewed escalation could quickly reignite fears of supply shortages, potentially sending prices back up. This persistent geopolitical risk premium means that even marginal supply disruptions can have an outsized impact on market sentiment and pricing.
However, the demand side of the equation presents a more nuanced picture. While economic activity in major consuming regions like China has shown some signs of recovery, global growth remains somewhat subdued. Inflationary pressures, although potentially easing in some economies, continue to be a concern for central banks, which may lead to tighter monetary policies that could dampen economic activity and, consequently, oil demand. The recent Purchasing Managers' Index (PMI) data from various regions will be crucial in assessing the true health of global manufacturing and services sectors, which are key drivers of oil consumption. If these indicators signal a slowdown, it could put further pressure on Brent prices, irrespective of supply-side jitters.
Furthermore, the market is closely watching inventory levels. Recent data, though not explicitly provided in the current market context, typically plays a vital role. Significant builds in crude oil or refined product inventories would suggest that current supply is outpacing demand, while draws would indicate the opposite. The interplay between OPEC+ production decisions, non-OPEC supply growth (particularly from the US shale sector), and global demand trends will continue to shape the fundamental landscape. The current price of $92.57 suggests that the market is weighing both sides of this equation, leading to the observed consolidation.
Technical Analysis: Reading the Charts at $92.57
From a technical perspective, Brent Crude's chart at $92.57 presents a mixed but predominantly bearish short-term picture, with longer-term indicators still suggesting underlying strength. On the 1-hour timeframe, the trend is neutral with a power of 50%. The RSI(14) is at 38.61, indicating a downward eğilim within the neutral zone, suggesting that sellers are gaining some traction. The MACD is showing negative momentum, with the MACD line below the signal line, reinforcing the bearish sentiment on this very short-term view. Stochastic oscillators are giving a conflicting signal, with %K at 43.74 and %D at 24.17, indicating a potential upward move, yet the ADX at 37.6 points to a strong downtrend, implying that any upward move might be a retracement within a larger downtrend.
The 4-hour timeframe paints a more cautious outlook. The trend is neutral (50% power). The RSI(14) is at 35.27, firmly in oversold territory and showing a downward eğilim. The MACD continues to show negative momentum. However, the Stochastic K value (33.76) is below the D value (61.91), suggesting a potential downward continuation, while the ADX at 22.5 indicates a moderately trending market, leaning towards a downtrend. The fact that the price is below the lower Bollinger band at times suggests extreme selling pressure, although the overall signal is leaning towards 'SELL' across multiple short-term indicators.
On the daily chart, the picture becomes more complex. The trend is neutral with 50% power. The RSI(14) is at 43.97, still showing a downward eğilim but not yet deeply oversold. The MACD maintains negative momentum. Stochastic K (22.89) is below D (23.69), indicating a further potential downside. Crucially, the ADX at 34.16 signifies a strong downtrend. The price is currently trading below the middle Bollinger Band, which historically indicates bearish pressure. The general signal across the daily timeframe is 'SELL' (6 SELL, 2 BUY, 0 NEUTRAL), reinforcing the bearish sentiment derived from the recent price collapse and the prevailing trend strength indicated by the ADX.
The confluence of a strong downtrend signal on the daily chart (ADX 34.16) and the price currently sitting below the middle Bollinger Band at $92.57 suggests that the path of least resistance might still be to the downside. Key support levels to watch are $88.61 (S1), $85.51 (S2), and $80.25 (S3). On the upside, resistance is expected at $96.97 (R1), $102.23 (R2), and $105.33 (R3). Traders will be closely monitoring how price reacts around these levels in the coming days.
The Strait of Hormuz Factor: A Recurring Geopolitical Risk
The situation concerning the Strait of Hormuz remains a critical variable for oil markets. This narrow waterway, through which approximately 30% of the world's seaborne oil trade passes, is a constant source of geopolitical risk. The recent tensions, which saw Iran take actions that led to temporary disruptions and a significant price spike, serve as a potent reminder of this vulnerability. While the immediate crisis appears to have subsided, the underlying geopolitical dynamics that led to the flare-up have not disappeared. The broader regional tensions, involving major global powers and key oil-producing nations, mean that the risk of future disruptions cannot be discounted.
The market's reaction to the news of the Strait's reopening highlights how quickly sentiment can shift. Prices reacted sharply to the perceived de-escalation, suggesting that a significant portion of the recent rally was built on fear. However, this does not mean the risk is gone. Any future actions by regional actors, or further escalations in existing conflicts, could easily reignite these concerns. Traders must remain vigilant, as the potential for supply disruptions in this vital waterway remains a persistent factor that could quickly send Brent Crude prices soaring again.
This geopolitical uncertainty adds a layer of complexity to fundamental analysis. It introduces a significant risk premium into oil prices, meaning that even if the physical supply-demand balance is relatively stable, prices can remain elevated due to the possibility of unforeseen events. This makes forecasting oil prices a challenging endeavor, as it requires not only understanding economic fundamentals but also closely monitoring geopolitical developments and the potential reactions of various market participants. The $92.57 level for Brent is currently reflecting this uncertainty, with traders balancing immediate supply news against the possibility of future shocks.
Correlation Analysis: DXY, Equities, and Brent's Dance
Brent Crude's price action is often influenced by broader market correlations, particularly with the US Dollar Index (DXY) and major equity indices like the S&P 500 and Nasdaq. Currently, the DXY is trading around 97.9, showing a slight downtrend. Historically, a strengthening dollar tends to put pressure on dollar-denominated commodities like oil, as they become more expensive for holders of other currencies. Conversely, a weaker dollar can make oil more attractive, potentially boosting demand and prices.
The DXY's current neutral-to-slightly-weakening trend around 97.9 suggests it is not currently a strong headwind for Brent. However, its 4-hour ADX of 37.19 indicates a strong downtrend, while the 1-day ADX at 26.2 also points to a strong downtrend. This suggests that if the dollar continues to weaken, it could provide some underlying support for oil prices, counteracting some of the bearish pressures from supply and demand fundamentals. Traders will be watching if the DXY can sustain its downward momentum below key support levels.
Equity markets, represented by the S&P 500 and Nasdaq, are showing a mixed picture. The S&P 500 is trading around 6572.87, with a strong 1-hour uptrend but a bearish daily trend. The Nasdaq is at 26681.85, showing strong upward momentum on shorter timeframes but a neutral daily trend. Generally, a strong risk-on sentiment in equities, indicated by rising stock prices, correlates with increased demand for riskier assets and potentially higher oil consumption, which would be bullish for Brent. Conversely, a sharp sell-off in equities, signaling risk aversion, often coincides with falling oil prices as investors flee to safer assets. The current mixed signals from equities suggest they are not providing a clear directional bias for Brent at this moment.
The interplay between these correlated assets is crucial. A significant move in the DXY or a clear directional trend in the equity markets could provide the necessary catalyst to break Brent out of its current sideways consolidation. For instance, a sustained weakening of the dollar coupled with a risk-on sentiment in equities could pave the way for a bullish scenario for Brent, pushing it towards the resistance levels. Conversely, a strengthening dollar and a sell-off in stocks would likely exacerbate any downward pressure on oil prices.
Economic Calendar Watchlist: Key Data Ahead
The economic calendar for the upcoming week holds several high-impact events that could significantly influence Brent Crude's price trajectory. While specific dates were not provided for all events in the current data, the nature of these releases is critical. Traders will be paying close attention to inflation data, such as CPI and potentially core PCE figures for major economies. Higher-than-expected inflation could prompt central banks to maintain or even increase interest rates, potentially dampening economic growth and oil demand. Conversely, cooling inflation might give central banks room to ease monetary policy, which could stimulate economic activity and boost oil demand.
Employment data, including Non-Farm Payrolls (NFP) and unemployment rates, will also be closely scrutinized. Strong employment figures typically indicate a robust economy, which is generally positive for oil demand. However, in the current environment, exceptionally strong jobs data could also fuel inflation concerns, leading to a mixed market reaction. The interplay between labor market strength and inflation will be a key theme.
Manufacturing and services PMIs will provide real-time insights into the health of the global economy. Readings above 50 generally indicate expansion, while those below suggest contraction. A widespread improvement in PMI data would signal strengthening global demand, offering support to oil prices. Conversely, weakening PMI figures would raise concerns about an economic slowdown, potentially weighing on Brent.
Furthermore, any pronouncements or meetings from major central banks, particularly the Federal Reserve and the European Central Bank, will be closely monitored. Their forward guidance on interest rates and monetary policy stance can have a profound impact on economic growth expectations and, consequently, on oil demand. The market's interpretation of these central bank communications will be a key driver of sentiment throughout the week.
Scenario Analysis: Mapping Potential Price Paths for Brent
Bearish Scenario: Testing the Lower Bounds
65% ProbabilityBullish Scenario: Reclaiming the High Ground
15% ProbabilityConsolidation Phase: The Waiting Game
20% ProbabilityThe current technical setup, particularly the strong downtrend signals on the daily chart (ADX 34.16) and the price action below key moving averages, favors a bearish outlook. The market's rapid reversal from geopolitical fear suggests that underlying demand may not be robust enough to sustain higher prices without significant supply shocks. Therefore, the most probable scenario is a continuation of the downtrend, targeting lower support levels. The trigger for this scenario would be a decisive break below the $88.61 support level, which has historically acted as a significant floor. If this level gives way, the path to $85.51 and potentially $80.25 would open up.
The bullish scenario, while less probable at this juncture, remains a possibility, especially if geopolitical tensions re-escalate or if key economic data surprises to the upside, signaling stronger global demand. A sustained break above the $96.97 resistance level would be the primary trigger for this scenario. This would indicate that the market is pricing in renewed supply concerns or a significant demand boost. The upside targets in this case would be $102.23 and potentially higher.
The neutral scenario, where Brent consolidates within the $88.61 to $96.97 range, is also plausible. This could occur if conflicting economic data emerges, or if geopolitical news remains mixed, leading to indecision among traders. In such a scenario, price action would likely be choppy, with limited trending potential. The key would be to watch for a decisive break out of this range, which would then confirm a move towards either the bullish or bearish targets.
What I'm Watching This Week: Key Triggers for Brent
As we head into the new trading week, several key factors will dictate Brent Crude's direction. Firstly, the geopolitical situation in the Middle East remains a primary focus. Any signs of renewed escalation or de-escalation will have an immediate impact on prices. Traders will be looking for official statements from regional powers and monitoring shipping traffic in critical waterways like the Strait of Hormuz. A return to high alert could quickly push prices back towards the $100 mark.
Secondly, economic data releases will be crucial. Inflation figures and central bank commentary will provide insights into the global economic outlook and potential monetary policy shifts. Stronger-than-expected demand indicators or a dovish pivot from major central banks could support oil prices. Conversely, data suggesting an economic slowdown or persistent inflation concerns could weigh on demand and Brent prices. The ADX values on the daily chart (34.16) indicate a strong trend is possible, so confirmation from economic data could be the catalyst.
Finally, technical levels are paramount. The $88.61 support and $96.97 resistance levels are critical. A decisive break below $88.61 would likely confirm the bearish scenario, while a sustained move above $96.97 could signal a shift towards a bullish outlook. The RSI at 43.97 on the daily chart still has room to move lower, supporting the bearish case, while the Stochastic K (22.89) and D (23.69) suggest a potential bounce, though its strength will be tested against the prevailing trend.
Frequently Asked Questions: BRENT Analysis
What happens if BRENT breaks below the $88.61 support level this week?
If BRENT Crude breaks decisively below the $88.61 support level, it would likely confirm the bearish scenario. This could trigger further selling, with the next key target being $85.51, followed by $80.25. The strong daily ADX of 34.16 suggests that such a breakdown could lead to a sustained downtrend.
Should I consider buying BRENT at current levels around $92.57 given the mixed technical signals?
Buying at current levels around $92.57 carries significant risk given the prevailing bearish short-term trend signals and the potential for further downside. While there's a slight chance of a bounce from current levels, a more prudent approach would be to wait for confirmation, such as a break above $96.97 resistance, or a clear reversal pattern forming after testing lower support levels.
Is the RSI at 43.97 on the daily chart a sell signal for BRENT right now?
An RSI of 43.97 on the daily chart is not a definitive sell signal in isolation, as it falls within the neutral zone. However, it does indicate a downward eğilim, suggesting that bearish momentum is present. Combined with the MACD's negative momentum and the price trading below the middle Bollinger Band, it adds to the bearish case, especially if it continues to trend lower towards oversold territory below 30.
How will upcoming inflation data affect BRENT prices this week?
Higher-than-expected inflation figures could lead to concerns about tighter monetary policy, potentially dampening economic growth and oil demand, which would be bearish for BRENT. Conversely, cooling inflation might signal a more favorable economic outlook and potential central bank easing, which could support oil prices. Traders will be closely watching these releases for potential catalysts to break BRENT out of its current range.
Technical Outlook Summary
| Indicator | Value | Signal | Interpretation |
|---|---|---|---|
| RSI (14) | 43.97 | Bearish | Downward eğilim, not yet oversold |
| MACD Histogram | Negative | Bearish | Selling pressure continues |
| Stochastic | K:22.89, D:23.69 | Bearish | Potential further downside |
| ADX | 34.16 | Bullish | Strong downtrend |
| Bollinger Bands | Below Middle Band | Bearish | Indicates bearish pressure |
Key Levels to Watch
Support Levels
Resistance Levels
Track markets in real-time
AI-powered analysis, technical indicators and real-time price data.
Join Our Telegram Channel
Breaking market news, AI analysis and trading signals instantly.
Join Channel