

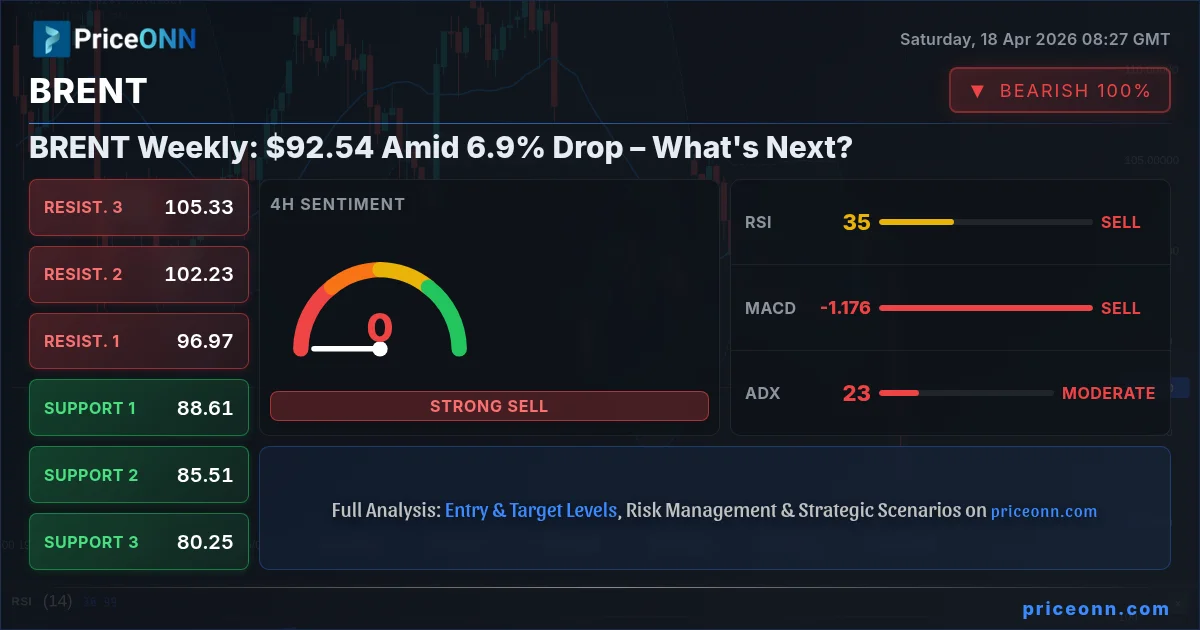
The past week saw a dramatic downturn for BRENT crude, closing significantly lower at $92.54 after shedding 6.9% of its value. This sharp decline, triggered by a confluence of easing geopolitical tensions and shifting market sentiment, brings critical levels into focus for the upcoming trading sessions. As traders digest the implications of Iran reopening the Strait of Hormuz, the question on everyone's mind is whether this drop marks a temporary pullback or the beginning of a more substantial correction. This analysis delves into the technical indicators, key price levels, and broader market correlations to decipher the path forward for BRENT.
- BRENT crude closed the week at $92.54, down 6.9% after a sharp sell-off.
- The ADX at 22.5 indicates a moderate trend, while RSI at 35.15 suggests oversold conditions on the daily chart.
- Key support is identified at $88.61, with resistance looming at $92.98 on the 1-hour chart.
- Easing supply shock fears from the Strait of Hormuz reopening are weighing on prices, contrasting with previous geopolitical risk premiums.
Navigating the Aftermath: BRENT's Sharp Weekly Decline
Last week was undeniably turbulent for BRENT crude. The benchmark oil contract experienced a precipitous fall, closing the trading week at $92.54. This represented a hefty 6.9% decrease from its previous closing price, a move that has caught many by surprise. The catalyst for this sharp decline appears to be a significant easing of geopolitical tensions, particularly following reports that Iran has reopened the Strait of Hormuz. This development directly addresses supply chain fears that had previously underpinned oil prices, leading to a rapid unwinding of risk premiums embedded in the market. The dramatic price action has shifted the technical landscape, bringing key support and resistance levels into sharper focus as traders reassess their positions.
The volatility observed was not just a minor fluctuation; it was a decisive move that has reshaped the immediate outlook for BRENT. The closing price of $92.54 now acts as a crucial reference point, and the underlying technical indicators paint a picture of a market potentially seeking a bottom, but not without significant headwinds. The rapid price adjustment suggests that market participants reacted swiftly to the news, leading to a cascade of selling pressure as speculative long positions were liquidated. Understanding the interplay between these fundamental shifts and the resulting technical posture is paramount for navigating the choppy waters ahead.
The Strait of Hormuz Reopens: A Catalyst for Crude's Collapse
The most significant fundamental development influencing BRENT prices last week was undoubtedly the announcement regarding the Strait of Hormuz. For weeks, escalating tensions in the Middle East had fueled concerns about potential supply disruptions, acting as a major bullish driver for crude oil. The mere threat of a blockade or conflict in this vital shipping lane added a substantial risk premium to prices, pushing BRENT well above the $100 mark at its recent peak. However, reports indicating the reopening of the Strait for all commercial traffic effectively removed this immediate supply shock fear from the market equation. This news acted as a powerful counter-narrative to the prevailing bullish sentiment, triggering a wave of profit-taking and a reassessment of oil's fundamental value.
The market's reaction was swift and severe. Crude oil prices, including BRENT, experienced a dramatic collapse, with some reports suggesting a near 10% drop in a single trading session. This rapid repricing highlights how heavily the market had been factoring in geopolitical risk. As the immediate threat subsided, traders moved to price in a scenario with more stable supply flows, leading to the significant weekly decline. This fundamental shift has direct implications for the technical setup, potentially signaling the end of the recent upward trend and the beginning of a corrective phase.
Technical Indicators: A Mixed Picture Emerges
While the fundamental news provided a clear bearish catalyst, the technical indicators offer a more nuanced view of BRENT's current standing. On the 1-hour timeframe, the ADX (Average Directional Index) at 22.5 suggests a moderately trending market, not yet in a full-blown reversal but indicating some directional conviction. However, the RSI (Relative Strength Index) at 38.43 on the same timeframe points towards a market that is moving out of oversold territory, but still carries a bearish lean. The MACD (Moving Average Convergence Divergence) histogram, while showing negative momentum on the 1-hour chart, suggests that selling pressure might be easing. This creates a bit of a tug-of-war: the trend is present, but momentum indicators are not screaming for a continued sell-off just yet.
Diving deeper into the daily chart, the picture becomes more complex. The ADX here is at 22.5, again pointing to a moderate trend. The RSI, however, is sitting at 35.15, firmly in oversold territory. This divergence between the ADX suggesting a trend and the RSI indicating oversold conditions is crucial. It implies that while the downward move has momentum, the selling might be exhausting itself. The Stochastic Oscillator on the daily chart (%K: 22.84, %D: 23.68) also confirms this oversold state, suggesting a potential for a bounce. This conflict between the 1-hour and daily indicators - one showing bearish momentum but the other oversold conditions - is where the real trading challenge lies.
Navigating the 1-Hour Chart: Short-Term Signals
The 1-hour chart for BRENT provides immediate, short-term signals that traders will be watching closely. The ADX value of 27.43 here indicates a strong upward trend, which is somewhat counterintuitive given the recent price action. However, this might reflect residual momentum from the earlier part of the week or the initial leg of the move. The RSI at 38.43 suggests that while the price has fallen, it's not yet deeply oversold on this timeframe, implying room for further downside if selling pressure persists. The MACD, showing negative momentum with the MACD line below the signal line, reinforces the bearish sentiment on the intraday charts.
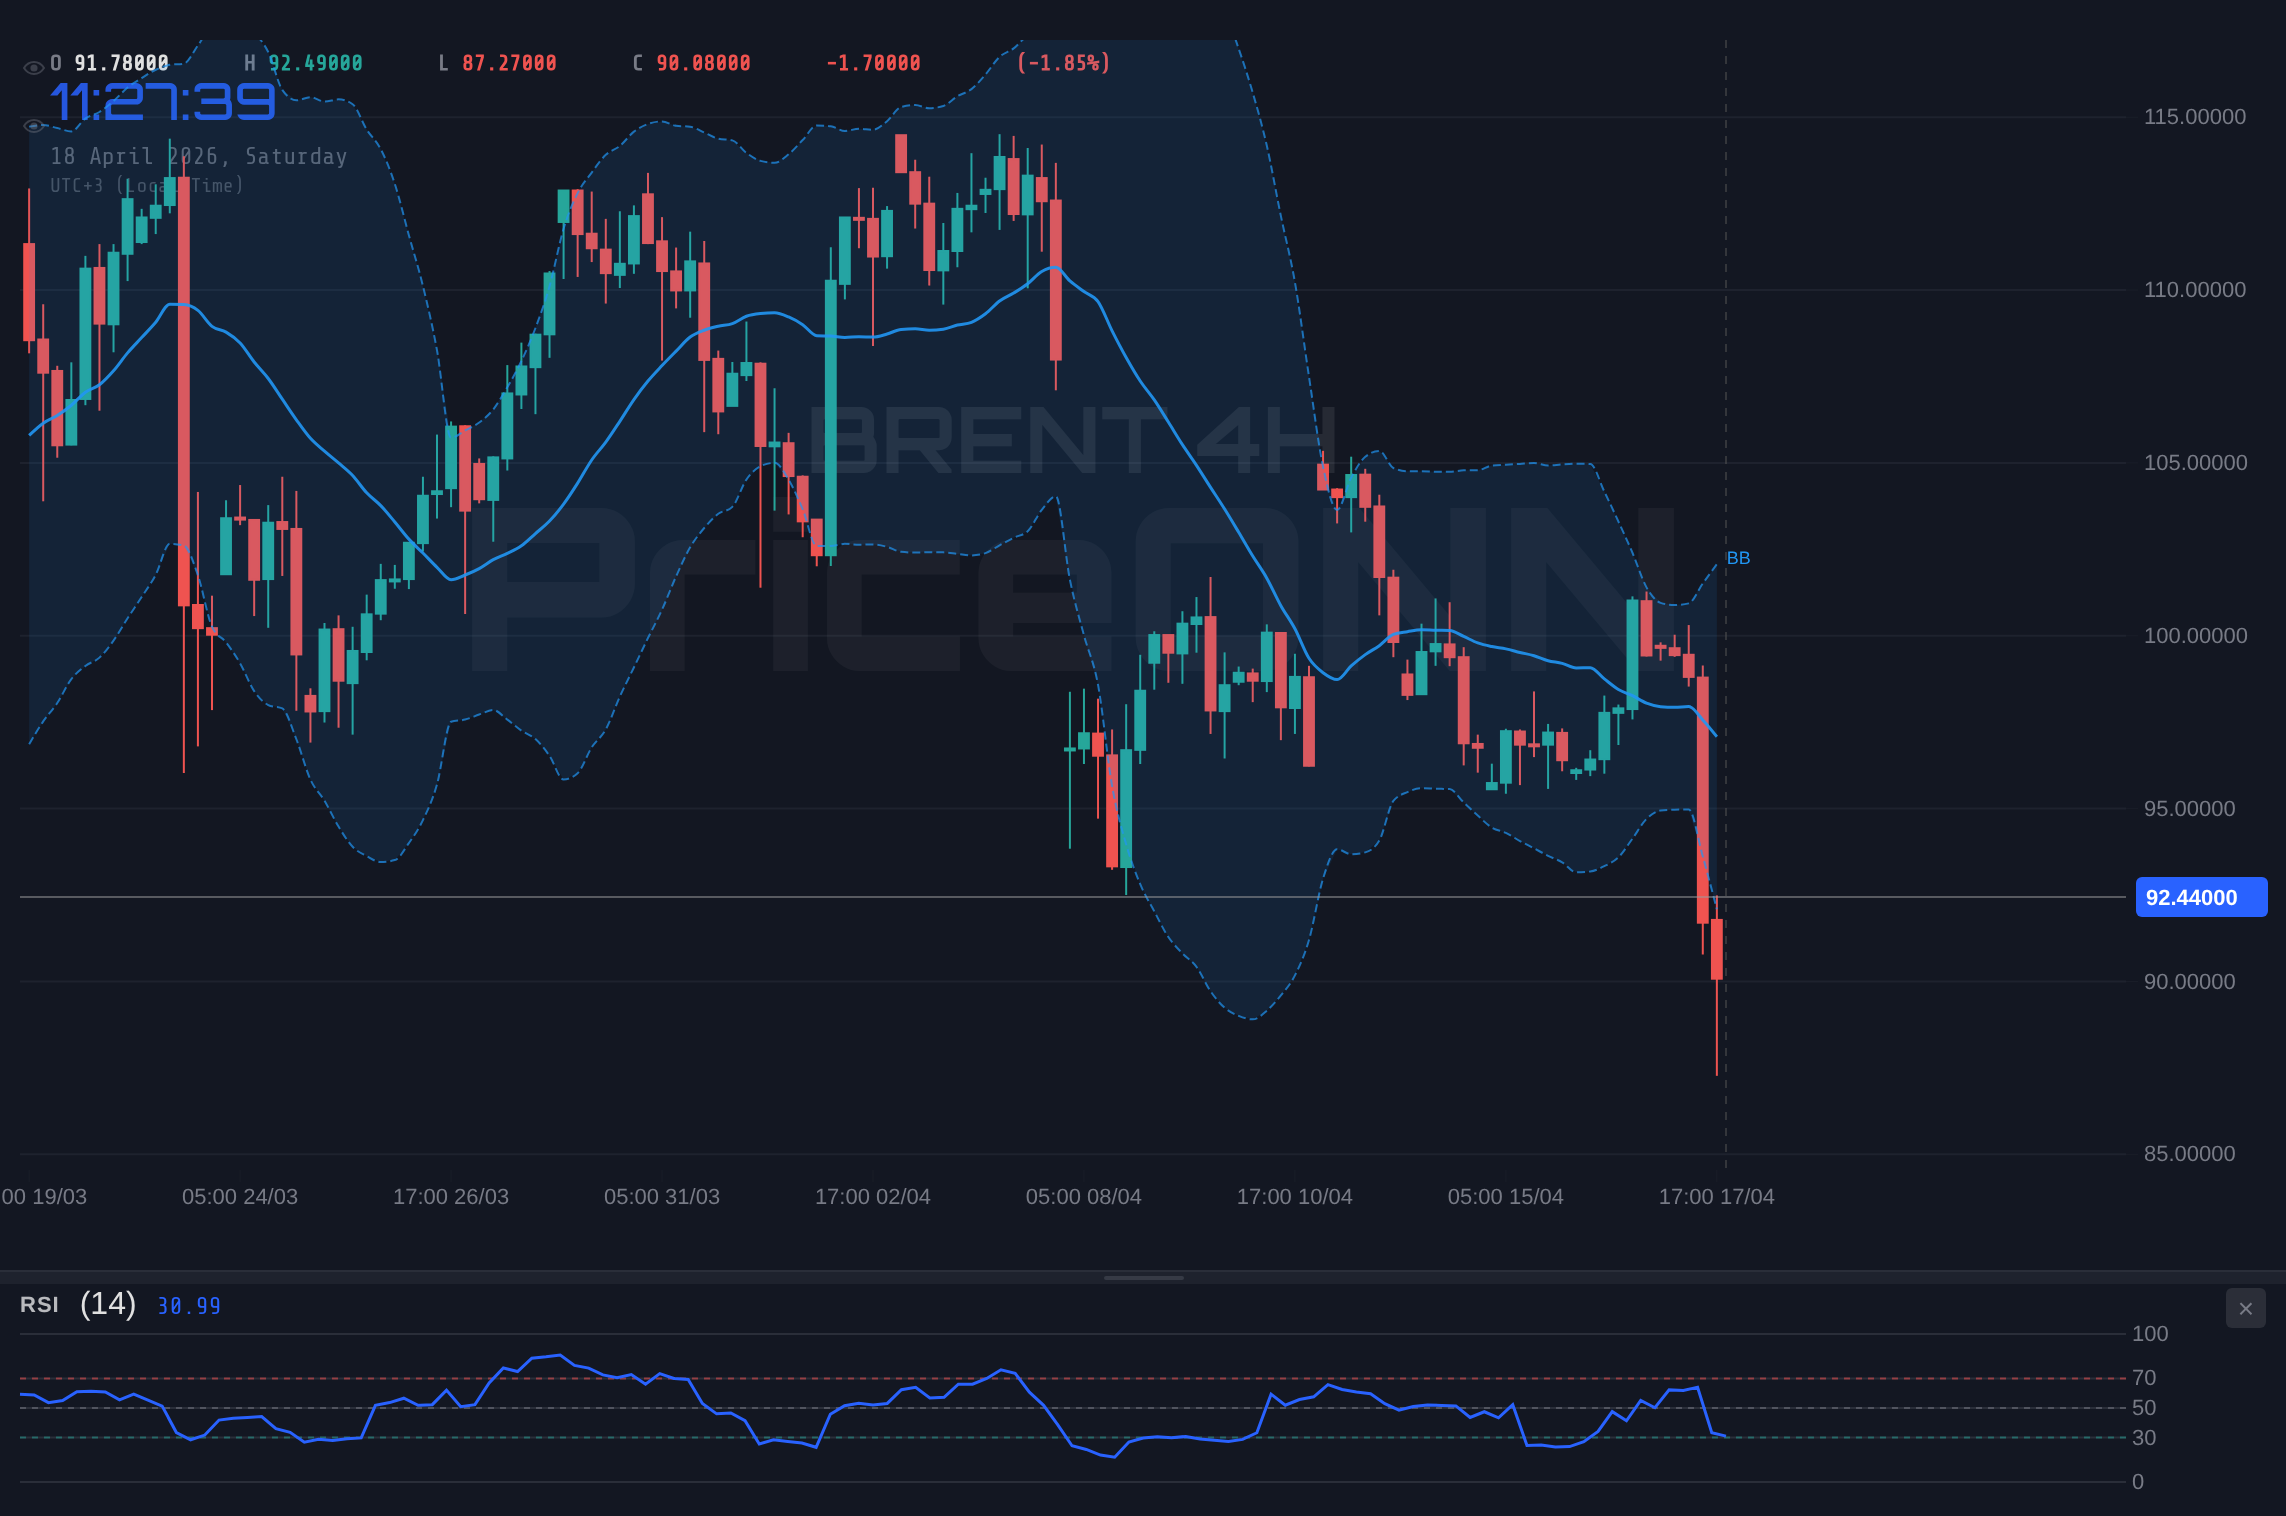
The Stochastic Oscillator on the 1-hour chart (%K: 43.63, %D: 24.15) presents a more bullish divergence, with the %K line crossing above the %D line, suggesting a potential short-term rebound. This creates a conflict: the MACD and RSI lean bearish, while the Stochastic hints at a potential bounce. This ambiguity is typical in markets that have just experienced a sharp move and are consolidating. The Bollinger Bands are currently below the middle band, indicating downward pressure, but the recent Stochastic crossover could signal an impending move towards the middle band. The general signal on this timeframe leans towards 'SELL' (Al: 1, Sat: 7, Nötr: 0), reflecting the prevailing downward momentum.
The Daily View: Oversold Conditions and Trend Strength
The daily timeframe presents a more compelling narrative for potential reversal. The ADX at 22.5 signifies a moderate trend, suggesting that the recent sharp move might be part of a larger, albeit not extremely strong, trend. More importantly, the RSI at 35.15 is deep in oversold territory. Historically, readings this low on the daily RSI have often preceded significant bounces, especially if confirmed by other indicators. The Stochastic Oscillator (%K: 22.84, %D: 23.68) is also deeply oversold and shows a potential bullish crossover forming, indicating that sellers might be losing their grip.
The MACD on the daily chart, while still showing negative momentum, is beginning to flatten. If the MACD line starts to move closer to the signal line, or even crosses above it, it would provide a strong bullish confirmation. The Bollinger Bands are hugging the lower band, which is a bearish signal in the short term, but also suggests that the price is stretched to the downside and could be due for a reversion to the mean. The overall 'General Signal' on the daily chart is 'SELL' (Al: 2, Sat: 6, Nötr: 0), but the oversold RSI and Stochastic are flashing warning signs for further immediate downside. This is where the 'risk/reward' calculation becomes critical for traders.
Key Levels to Watch: Support at $88.61, Resistance at $92.98
With BRENT closing the week at $92.54, the levels discussed in the market data become paramount. On the 1-hour chart, the immediate support is noted at $91.28, followed by $90.24 and $89.58. These are the levels traders will watch to gauge the immediate selling pressure. If the price breaks decisively below $89.58, it could signal a continuation of the sharp decline, potentially targeting lower levels. The resistance on the 1-hour chart is seen at $92.98, $93.64, and $94.68. A break above $92.98 would be the first indication of a potential short-term reversal, especially if accompanied by increasing volume and bullish indicator signals.
Looking at the daily chart, the support levels are more significant. The first major support is at $88.61, which aligns with the lower Bollinger Band on the 4-hour chart. A break below this level would be a strong bearish signal, potentially opening the door to further declines towards $85.51 and even $80.25. On the resistance side, $92.98 remains a critical psychological and technical barrier. If BRENT can reclaim and hold above this level, it would signal a potential shift in momentum. Further resistance lies at $96.97 and the psychologically important $100 level, which BRENT recently breached. The ability to hold above $92.54 and push towards $92.98 will be a key determinant of the short-term trend.
Correlation Analysis: DXY, Equities, and Geopolitics
Understanding BRENT's price action requires looking beyond its own charts and considering its correlations with other major markets. The US Dollar Index (DXY) is a key barometer. Last week, the DXY saw a slight dip, closing around 97.9. Typically, a weaker dollar supports commodity prices, including oil, as dollar-denominated assets become cheaper for holders of other currencies. However, the significant drop in BRENT occurred despite the DXY's weakness, highlighting the overwhelming impact of the geopolitical news. This suggests that the easing of Middle East tensions temporarily overshadowed the dollar's influence.
Equities, particularly the S&P 500 and Nasdaq, also play a role. The S&P 500 closed higher at 6572.87, and the Nasdaq 100 also saw gains, closing at 26682.75. This risk-on sentiment in equities usually correlates with higher oil prices, as it indicates a healthy global economy with strong demand for energy. The fact that BRENT fell sharply while equities rose further emphasizes the specific supply-side news driving the oil market. Geopolitically, the reopening of the Strait of Hormuz is a major de-escalation signal. This reduces the 'fear premium' that had been driving oil prices higher, suggesting that any future price increases will need to be driven by fundamental demand-supply dynamics rather than geopolitical risk.
Central Bank Policies and Inflationary Pressures
While the immediate driver for BRENT's decline was geopolitical, the broader macroeconomic backdrop, particularly central bank policies and inflation, remains a critical long-term factor. Inflationary pressures have been a persistent concern globally, and oil prices are a significant component of that inflation basket. The recent drop in crude prices, if sustained, could provide some relief to inflation figures in the coming months. This might influence central bank decisions, potentially giving institutions like the Federal Reserve more breathing room to consider monetary policy adjustments, although expectations for major shifts remain uncertain.
The provided economic calendar shows mixed signals. For instance, a recent USD figure showed an Actual of -0.913 against a Forecast of 2.1, indicating a weaker-than-expected outcome. Conversely, a GBP event showed an Actual of 0.5 against a Forecast of 0.1, suggesting stronger performance. These figures contribute to the complex global economic picture. The relationship between oil prices, inflation, and central bank policy is a delicate dance. A sustained drop in oil could dampen inflation expectations, potentially leading to less hawkish central bank stances. Conversely, if oil prices rebound due to renewed supply concerns or robust demand, inflationary pressures could re-emerge, forcing central banks to maintain tighter policies.
The Trader's Perspective: Risk Management is Key
For traders, the recent volatility in BRENT presents both challenges and opportunities. The sharp decline has created oversold conditions on longer timeframes, hinting at a potential bounce. However, the bearish momentum on shorter timeframes and the fundamental news regarding the Strait of Hormuz cannot be ignored. This situation calls for a disciplined approach, prioritizing risk management above all else. The fact that the ADX is at a moderate 22.5 on the daily chart suggests that while a trend exists, it's not an overwhelming one, meaning that reversals are possible.
The ideal scenario for a trader would be to wait for clearer signals of confirmation. This could involve waiting for the RSI to move out of oversold territory and for the MACD to show a bullish crossover on the daily chart. Alternatively, a decisive break above the 1-hour resistance at $92.98, coupled with increasing volume, could signal a short-term long opportunity. Conversely, a failure to hold the $88.61 support level could indicate further downside, offering shorting opportunities. Given the conflicting signals and the recent sharp price move, it's a market that demands patience and a well-defined risk management strategy. Stop-loss orders will be crucial to protect against unexpected market moves.
Scenario Planning: Bullish, Bearish, and Neutral Outlooks
Given the current technical and fundamental landscape, several scenarios could unfold for BRENT crude in the coming week. The probabilities assigned reflect the current confluence of data, but are subject to change based on incoming news and market developments.
Bearish Scenario: The Downward Pressure Continues
65% ProbabilityNeutral Scenario: Consolidation Around $90-$92
25% ProbabilityBullish Scenario: A Bounce from Oversold Levels
10% ProbabilityThe Road Ahead: Watching Key Economic Events
Looking ahead, several factors will shape BRENT's trajectory. The ongoing geopolitical situation, despite the recent de-escalation, remains a key wildcard. Any renewed flare-up in tensions could quickly reverse the current price action and send oil prices soaring again. Furthermore, global economic health will be crucial. Stronger-than-expected economic data could boost demand expectations, while weakening data might exacerbate the current bearish sentiment. Traders will be closely watching upcoming economic releases, particularly those related to inflation and consumer spending, as they could influence central bank policies and, consequently, the broader market sentiment.
The correlation with the DXY and equity markets will also be important to monitor. A strengthening dollar or a significant downturn in global equities could add further pressure on oil prices. Conversely, a sustained risk-on environment and a weakening dollar could provide support for a potential BRENT rebound. The technical picture, particularly the daily RSI moving out of oversold territory and MACD showing signs of a bullish crossover, suggests that a bounce is plausible. However, this bounce needs to be confirmed by fundamental developments and sustained price action above key resistance levels.
Frequently Asked Questions: BRENT Analysis
What happens if BRENT breaks below the $88.61 support level?
If BRENT breaks decisively below the $88.61 support level, it would signal a continuation of the bearish trend. This could trigger further selling pressure, potentially targeting the next significant support at $85.51, and possibly extending down to $80.25 if market sentiment remains overwhelmingly negative.
Should I buy BRENT at current levels around $92.54 given the oversold RSI?
Buying BRENT solely based on the oversold RSI at 35.15 on the daily chart carries significant risk. While it suggests a potential bounce, confirmation is needed. A more prudent approach might be to wait for a confirmed bullish signal, such as a break above $92.98 resistance or a bullish MACD crossover, before considering long positions, with strict risk management in place.
Is the ADX at 22.5 a sell signal for BRENT right now?
An ADX reading of 22.5 indicates a moderate trend, not a strong sell signal in itself. It suggests that a trend is present but lacks the conviction for a sustained directional move. When combined with an oversold RSI, it points to a market that could be consolidating or preparing for a reversal, rather than simply continuing a strong downtrend.
How will the easing of Strait of Hormuz tensions affect BRENT this week?
The reopening of the Strait of Hormuz significantly reduces the geopolitical risk premium that had been inflating BRENT prices. This fundamental shift is likely to exert downward pressure on oil prices, as the market reprices supply availability. Expect continued focus on demand-supply fundamentals rather than geopolitical fears as the primary price driver.
| Indicator | Value | Signal | Interpretation |
|---|---|---|---|
| RSI (14) | 35.15 | Bearish | Oversold on Daily, but moving out of extreme zone |
| MACD Histogram | -1.5 | Bearish | Negative momentum, but flattening |
| Stochastic | %K: 22.84, %D: 23.68 | Bullish Crossover Forming | Deeply oversold, potential for bounce |
| ADX | 22.5 | Moderate Trend | Trend exists but lacks strong conviction |
| Bollinger | Lower Band Touch | Bearish Pressure | Price stretched to downside, potential mean reversion |
Track markets in real-time
AI-powered analysis, technical indicators and real-time price data.
Join Our Telegram Channel
Breaking market news, AI analysis and trading signals instantly.
Join Channel