

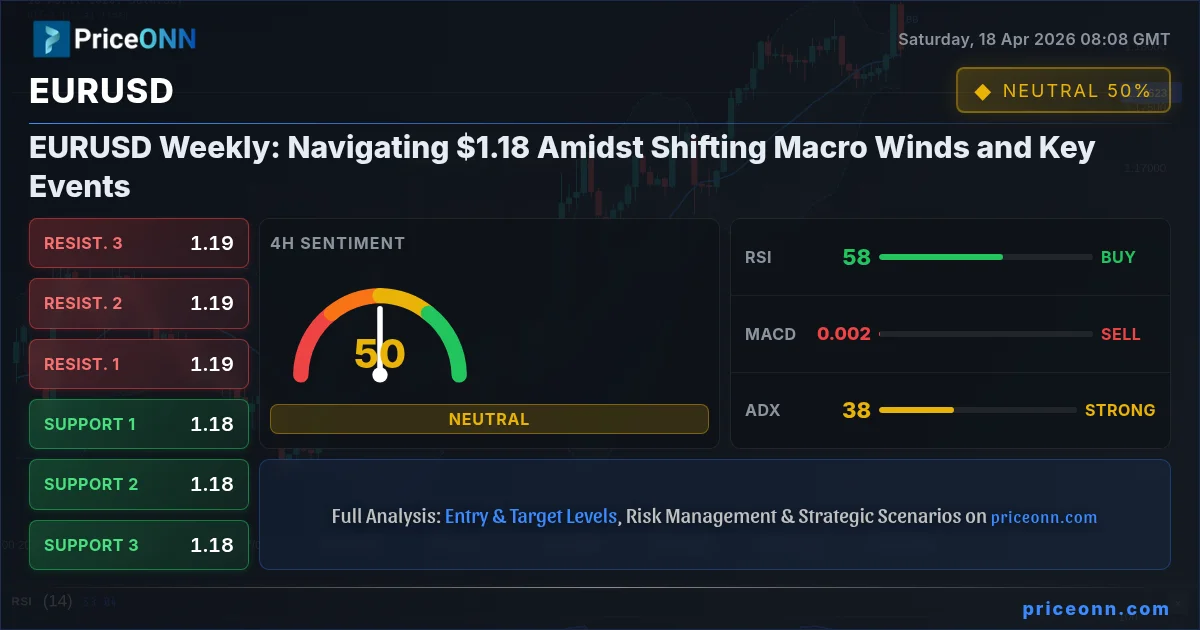
EURUSD stands at a pivotal juncture, hovering around the $1.18 mark as the trading week concludes. This psychological level, a magnet for price action in recent sessions, represents a delicate balance between dollar strength and euro resilience. As we look towards the upcoming week, a confluence of high-impact economic data releases and forward-looking central bank commentary is poised to inject volatility and potentially break this stalemate. Understanding the interplay between these factors is crucial for dissecting the potential path forward for the pair. This analysis delves into the technical underpinnings, the fundamental drivers, and the critical levels that will shape EURUSD's trajectory in the coming days, offering a multi-scenario view for traders and investors.
- EURUSD is consolidating near the $1.1800 level, a critical psychological and technical area.
- The 1-hour RSI at 38.74 signals bearish pressure, while the 1-day RSI at 60.87 shows underlying bullish momentum.
- Key support for EURUSD is identified at $1.17546, with resistance looming at $1.18115.
- Upcoming economic data from the US and Eurozone, coupled with central bank speeches, are expected to be major catalysts.
- The Dollar Index (DXY) showing mixed signals across timeframes adds complexity to the outlook.
The past week has seen EURUSD largely confined to a tight range, oscillating around the significant $1.1800 handle. This period of consolidation, while perhaps offering a brief respite from the intense volatility seen earlier in the year, has also created a coiled spring effect. Traders are keenly observing the confluence of technical indicators and the upcoming economic calendar, anticipating a catalyst that will break this equilibrium. The 1-hour chart paints a picture of immediate bearish pressure, with an RSI reading of 38.74 and MACD in negative territory, suggesting sellers are currently dictating short-term price action. However, delving into the daily timeframe reveals a more nuanced story. The daily RSI sits comfortably at 60.87, indicating a persistent underlying bullish bias that has been building over recent weeks. This divergence between short-term selling pressure and longer-term bullish sentiment is the core tension defining the current EURUSD landscape. It suggests that while immediate dips might occur, the broader trend could still favor the upside if key resistance levels are breached.
Unpacking the Technical Tapestry: EURUSD's Multi-Timeframe Dance
The Hour-by-Hour Battle: Short-Term Signals and Divergences
On the 1-hour timeframe, EURUSD is exhibiting signs of short-term weakness. The Relative Strength Index (RSI) at 38.74 is firmly in neutral territory but trending downwards, indicating that selling momentum is building. This is corroborated by the MACD, which is currently below its signal line and in negative territory, suggesting that bearish momentum is dominant in intraday trading. The Stochastic Oscillator, with %K at 8.68 and %D at 37.13, is deeply oversold, hinting at a potential for a short-term bounce, but the prevailing trend on this timeframe is clearly bearish. The ADX at 18.06 signifies a weak trend, which often leads to choppy, range-bound price action or sharp, sudden moves when a breakout finally occurs. This suggests that while short-term traders might find opportunities on the downside, the lack of a strong trend means any moves could be quickly reversed. The Bollinger Bands are showing the price trading below the middle band, which can sometimes signal a continuation of the downtrend or an oversold condition that might precede a rebound. The overall signal for the 1-hour chart leans heavily towards selling, with a score of 1 'Buy', 7 'Sell', and 0 'Neutral'. This paints a picture of intraday caution, where opportunistic selling could be favored, but the lack of a strong trend makes it risky.
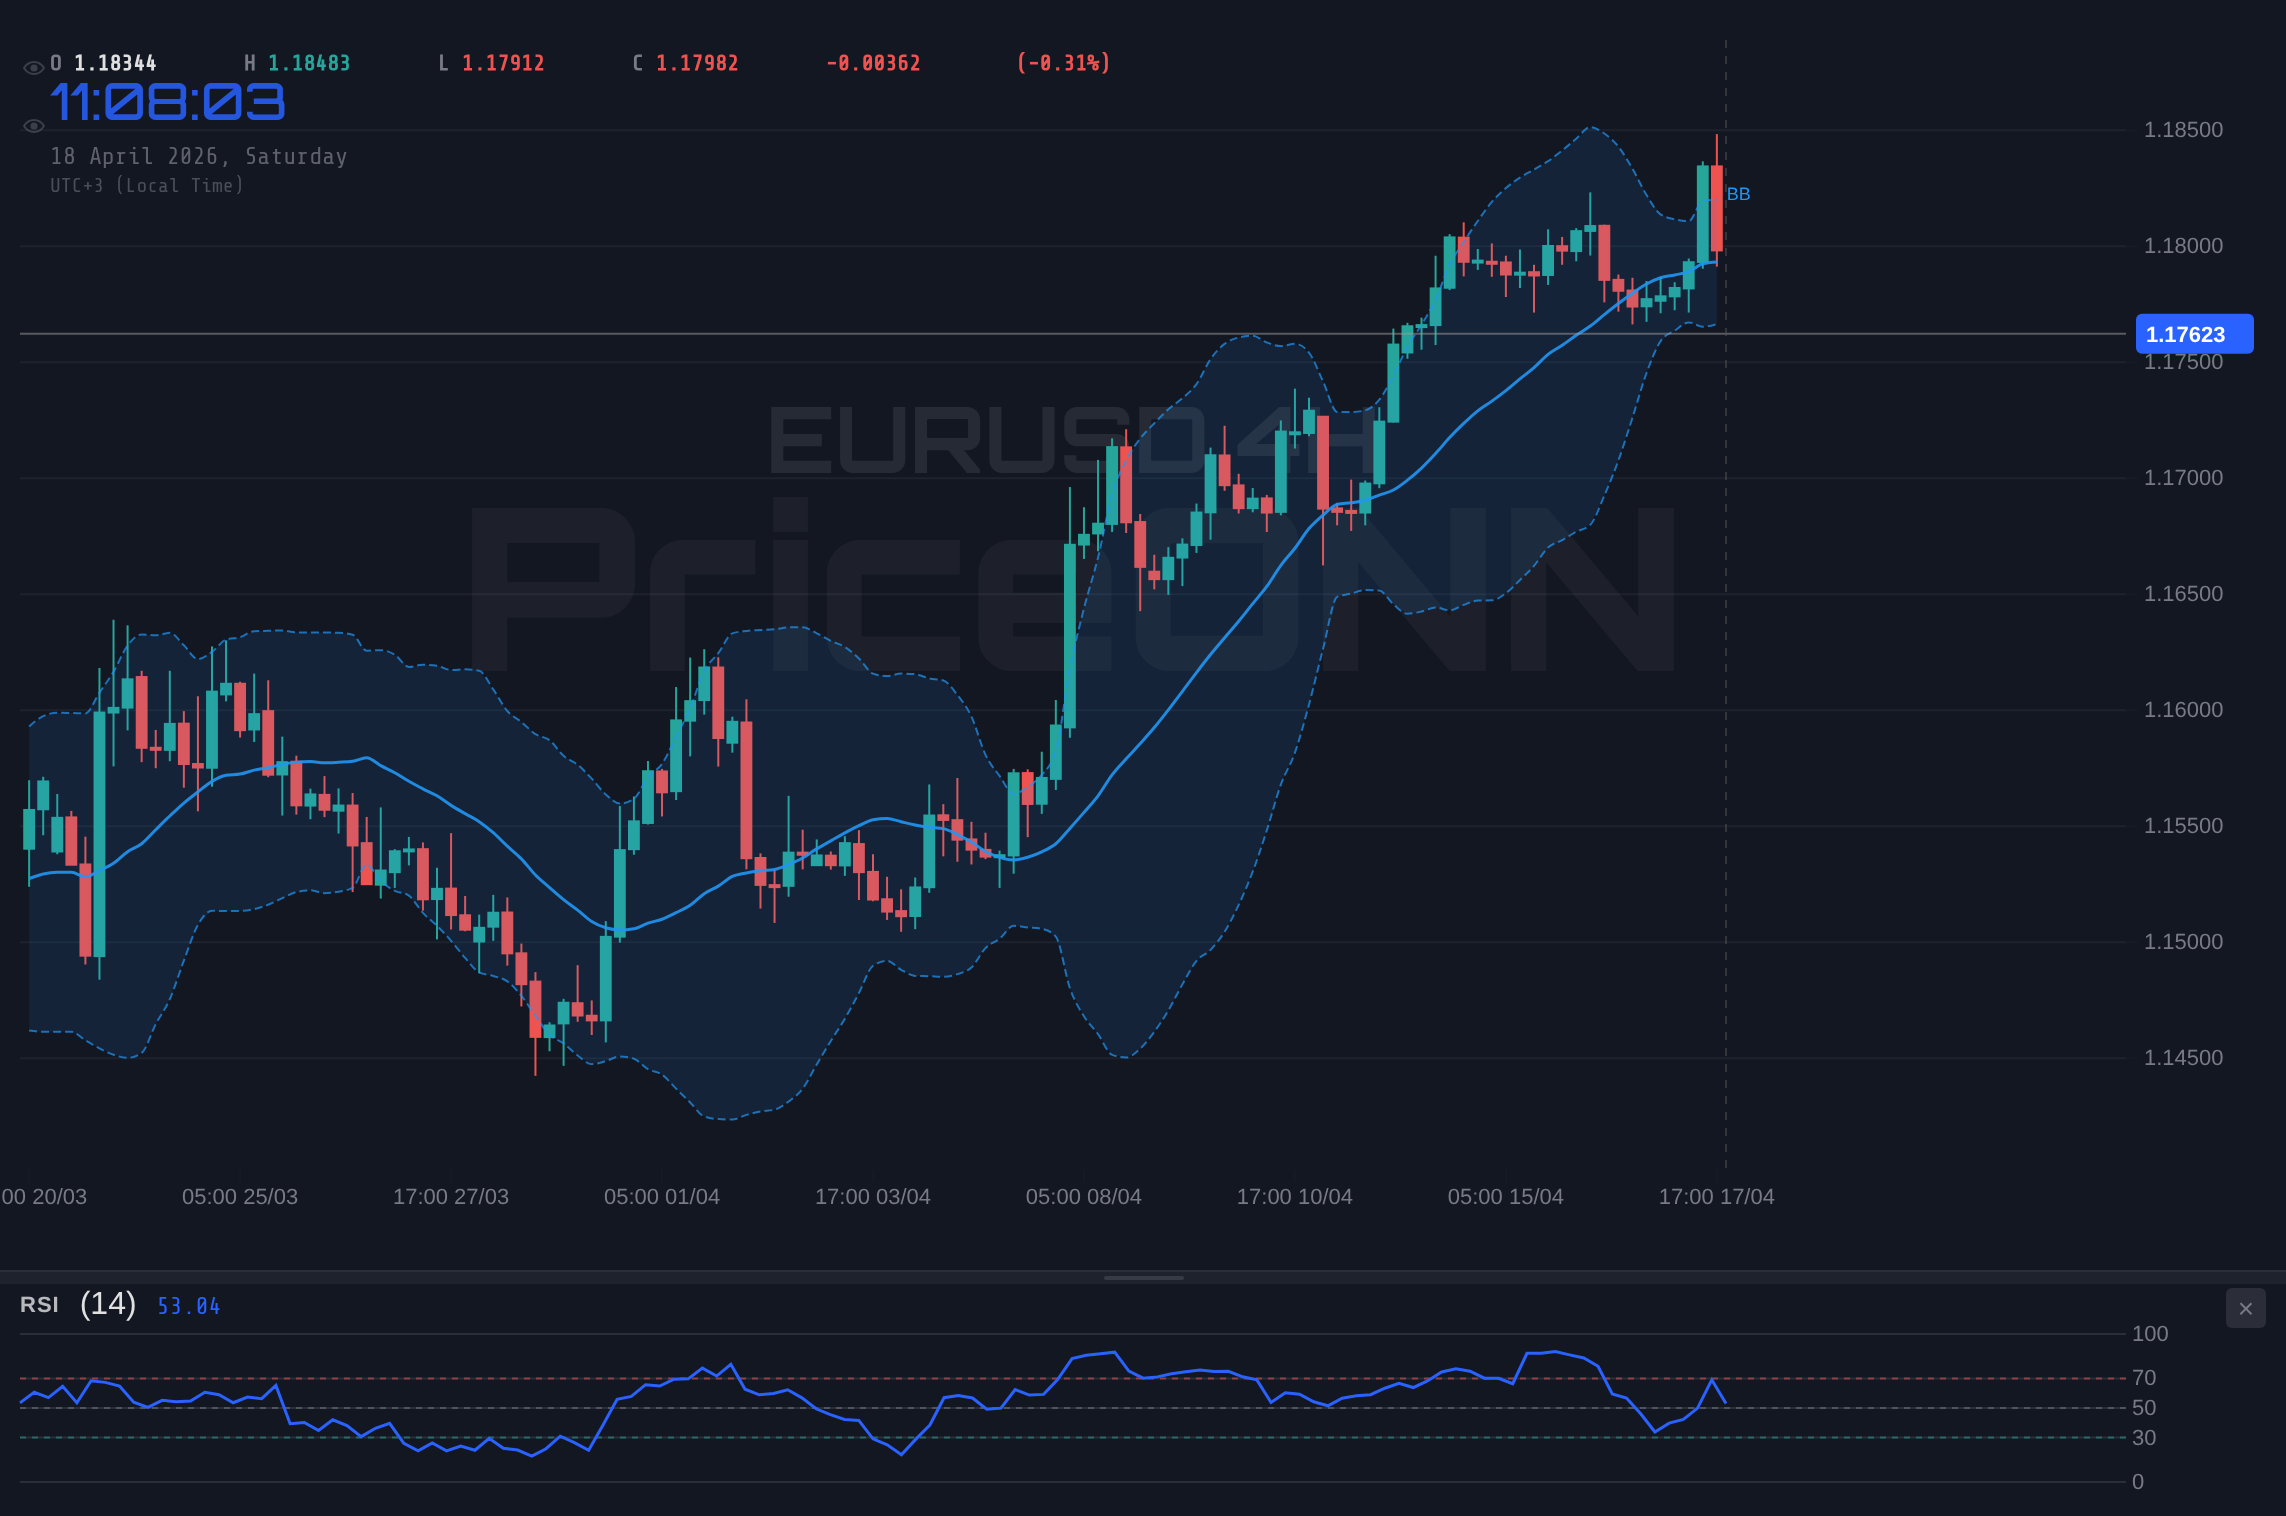
The immediate support levels on the 1-hour chart are at 1.17696, 1.17601, and 1.17465. A decisive break below these levels, especially the psychological 1.1750 area, could trigger further downside momentum, potentially targeting the next major support zone. Conversely, resistance is found at 1.17927, 1.18063, and 1.18158. A break above these levels would be necessary to invalidate the current bearish short-term outlook and signal a potential shift higher. However, given the weak ADX, any upward move might struggle to gain significant traction without broader market confirmation or a fundamental shift. This intraday weakness needs to be considered in the context of the larger trends, as short-term signals can often be whipsawed by more dominant forces.
The 4-Hour Chart: A Mixed Signal Amidst Stronger Trends
Shifting our focus to the 4-hour chart, the picture becomes more complex and arguably more representative of the current market sentiment. The trend is classified as 'Neutral' with a 50% strength, indicating a lack of clear direction on this intermediate timeframe. However, the RSI at 58.18 is in the upper neutral zone, showing a rising tendency, which hints at potential bullish momentum building. The MACD, while still in negative territory, is showing signs of narrowing the gap with its signal line, suggesting that bearish momentum might be waning. The Stochastic Oscillator presents a bullish signal, with %K at 60.96 and %D at 34.62, indicating that the pair is moving out of oversold territory and could be poised for an upward move. The ADX at 38.1 is notably strong, classifying this as a 'Strong Uptrend' - this seems contradictory to the 'Neutral' trend classification, highlighting a potential conflict in indicators or a transition phase. This strong ADX reading suggests that if a directional move does materialize, it could be quite powerful.
Bollinger Bands on the 4-hour chart show the price trading below the middle band, which can be interpreted as a bearish sign or a consolidation phase before a potential breakout. The support levels here are more significant: 1.18043, 1.17741, and 1.17580. A hold above 1.1800 is critical for maintaining any semblance of bullish hope from the daily chart. Resistance levels are at 1.18506, 1.18667, and 1.18969. A sustained move above 1.1850 could signal a more significant shift towards the upside, potentially validating the bullish signals from the daily chart. The overall signal on the 4-hour chart is 'Neutral' (4 'Buy', 4 'Sell', 0 'Neutral'), reflecting the indecision in the market. This intermediate timeframe suggests that while short-term weakness exists, the underlying conditions are not entirely bearish, and a move higher is plausible if key levels hold.
The Daily Outlook: Underlying Strength and Lingering Bullish Hopes
The daily chart provides the broadest perspective, and here, the signals lean more optimistically, despite the 'Neutral' trend classification (50% strength). The RSI stands at 60.87, firmly in the bullish territory, indicating healthy upward momentum. This is a crucial indicator, suggesting that the recent price action, while potentially showing short-term weakness, is not undermining the broader upward bias that has been developing. The MACD is positive and above its signal line, reinforcing the bullish sentiment on a daily basis. This suggests that the longer-term trend, if it were to reassert itself, would likely be upwards. The Stochastic Oscillator, however, is showing a potential warning sign. With %K at 85.04 and %D at 92.18, it is firmly in overbought territory, signalling that the pair may be due for a pullback or consolidation. This overbought condition needs to be monitored closely, as it could precede a reversal or a period of sideways movement.
The ADX on the daily chart is at 28.38, indicating a strong trend. While the trend classification is neutral, the strength indicated by the ADX suggests that if a directional move does occur, it will likely be significant. The Bollinger Bands are trading above the middle band, supporting the bullish inclination. Key daily support levels are situated at 1.17546, 1.17320, and 1.16977. A sustained break below 1.1750 would be a significant bearish development, potentially invalidating the daily bullish outlook. On the resistance side, we have 1.18115, 1.18458, and 1.18684. A decisive close above 1.18115, and particularly above the 1.1850 mark, would be a strong signal for further upside potential, aligning with the bullish RSI and MACD readings. The overall signal on the daily chart is 'Buy' (7 'Buy', 1 'Sell', 0 'Neutral'), highlighting that despite intraday choppiness, the longer-term picture still holds some promise for the bulls.
Fundamental Undercurrents: What's Driving the $1.18 Standoff?
The Dollar's Dilemma: DXY's Mixed Signals
The US Dollar Index (DXY) plays a pivotal role in the EURUSD equation, and its recent performance has been anything but clear-cut. On the 1-hour chart, the DXY shows a bullish signal with an RSI at 56.83 and MACD in positive territory, suggesting some intraday strength. However, this is contradicted by the 4-hour chart, where the RSI at 47.84 is trending downwards and the MACD is positive but showing signs of weakening momentum. The ADX on the 4-hour chart is a strong 37.19, indicating a powerful downtrend, which is puzzling given the bullish signals elsewhere. On the daily chart, the DXY is showing clear bearish signs, with an RSI of 40.62 and negative MACD momentum. The ADX at 26.2 suggests a strong downtrend. This divergence across timeframes for the DXY creates uncertainty. A weaker dollar typically supports EURUSD, while a stronger dollar puts pressure on it. The current mixed picture means that the dollar's influence on EURUSD is less predictable, adding to the indecision around the $1.18 level. Traders are likely waiting for a clearer trend in the DXY before making significant directional bets on EURUSD.
Eurozone Economic Pulse: Inflation and ECB's Stance
On the Eurozone front, recent economic data has provided a mixed bag, influencing the euro's performance. The latest high-impact event, the Eurozone's Harmonised Index of Consumer Prices (HICP) for March, came in at 2.6%, exceeding the forecast of 2.5% and showing an acceleration from the previous month's 1.9%. This higher-than-expected inflation print could, in theory, put upward pressure on the euro. Higher inflation might lead markets to anticipate a more hawkish stance from the European Central Bank (ECB), potentially sooner rather than later, regarding interest rate policy. However, the ECB has consistently signaled a patient approach, emphasizing the need to see sustained disinflationary trends before considering rate cuts. This cautious rhetoric from ECB officials, despite the uptick in inflation, has somewhat capped the euro's upside potential. The market is caught between the immediate inflation data and the ECB's forward guidance, creating a tug-of-war that contributes to EURUSD's range-bound trading.
The implication of this inflation data is significant. While it might seem like a positive for the euro in the short term, it also raises questions about the sustainability of economic growth if inflation remains stubbornly high. The ECB's balancing act is delicate: combatting inflation without stifling economic recovery. Any hints from upcoming ECB communications about their reaction function to this inflation data will be closely watched. If the ECB signals a stronger resolve to fight inflation, even at the risk of slower growth, it could be interpreted as euro-positive. Conversely, if they downplay the current inflation spike and reiterate their commitment to supporting the economy, the euro might struggle to find consistent upward momentum. The current 'Neutral' signal from the 4-hour chart for EURUSD reflects this fundamental ambiguity.
US Economic Indicators: Consumer Spending and Fed's Path
Across the Atlantic, the US economic landscape is also presenting a complex picture, crucial for understanding the dollar's strength and EURUSD's potential moves. The upcoming US Retail Sales data for March is a key event to watch. The previous data showed a significant slowdown, and expectations are for a rebound, largely driven by a surge in gasoline prices, which climbed 26% in March. While a strong retail sales figure would typically be dollar-positive, the context here is important. A rebound driven solely by higher energy costs might not be seen as a sign of robust underlying consumer demand. The market will be dissecting the details: are sales rising due to higher prices, or is there genuine volume growth? The Federal Reserve is closely monitoring such data points as they deliberate on their monetary policy path. Higher inflation, as indicated by rising gas prices and the Eurozone's HICP, could complicate the Fed's decision-making process. If the Fed perceives inflation to be sticky, it might delay anticipated interest rate cuts, which would normally support the dollar.
However, the market seems to be pricing in a certain degree of Fed caution already. The Fed funds futures, for example, might reflect a reduced probability of imminent rate cuts compared to a few months ago. This is a crucial factor for EURUSD. If the market's expectations for Fed policy are already aligned with a 'higher-for-longer' scenario, then even positive US data might not provide a significant boost to the dollar. The interplay between US inflation, consumer spending, and the Fed's reaction function is paramount. The daily chart's 'Buy' signal for EURUSD suggests that perhaps the market is already pricing in a degree of Fed hawkishness, or that the euro's own fundamental story is becoming more compelling. The critical support at $1.17546 is the level to watch; a break below it would signal that US economic resilience, or lack thereof, is starting to weigh negatively on the pair, despite the underlying bullish daily indicators.
The recent surge in oil prices, partly attributed to geopolitical developments like the reopening of the Strait of Hormuz, adds another layer of complexity. Higher oil prices can fuel inflation globally, potentially influencing central bank policies. For the Eurozone, higher energy costs could exacerbate inflationary pressures, while for the US, it could contribute to consumer spending challenges. The correlation between oil prices and EURUSD needs careful monitoring. While oil's recent plunge of 10% on the back of Iran's announcement to reopen the Strait of Hormuz might ease some inflationary concerns, the fragile nature of such developments means the market remains sensitive to any renewed escalations. The impact on inflation expectations and subsequent central bank reactions will be key.
Scenario Analysis: Charting EURUSD's Potential Paths
Bearish Scenario: The Dollar's Comeback
65% ProbabilityBullish Scenario: Euro's Ascendancy
25% ProbabilityConsolidation Scenario: The $1.18 Stalemate
10% ProbabilityThe most probable scenario, given the current technical picture and the anticipation surrounding upcoming economic events, leans towards a bearish outcome in the short term, carrying a 65% probability. The confluence of intraday bearish signals on the 1-hour chart, coupled with the mixed and potentially strengthening signals from the DXY on its lower timeframes, suggests that downside risk is more immediate. The higher-than-expected inflation in the Eurozone, while theoretically positive for the euro, might not be enough to counteract potential dollar strength if US data surprises to the upside or if the Fed maintains its hawkish rhetoric. The critical support at $1.17546 becomes the linchpin for this bearish thesis. A break below this level, especially if accompanied by a rise in the DXY and negative surprises in US data, could easily trigger a cascade towards the $1.17320 and potentially $1.16977 levels. The 1-hour chart's oversold Stochastic might offer a brief reprieve or a minor bounce, but it's unlikely to derail a strong bearish move if the fundamental drivers align.
Conversely, the bullish scenario, while less probable at 25%, remains a significant possibility, particularly if key resistance levels are decisively broken. This scenario hinges on a clear weakening of the dollar (DXY falling below 97.50) and surprisingly strong positive economic news from the Eurozone, perhaps signaling robust growth that could prompt earlier ECB policy adjustments. A sustained break above $1.18115 would be the primary trigger, potentially opening the door for a move towards $1.18458 and then $1.18684. The daily chart's underlying bullish indicators (RSI 60.87, positive MACD) provide the foundation for such a move, but it requires significant catalysts to overcome the immediate bearish pressures and dollar strength. The key here is the 'sustained' nature of the breakout; a mere breach of resistance is not enough; price must hold above it to signal a genuine trend shift.
The neutral scenario, with a 10% probability, represents the market continuing its indecisive dance around the $1.18 mark. This would likely occur if upcoming data releases are largely in line with expectations, offering no new information to sway market sentiment significantly, and if central bank commentary remains cautiously neutral. In such a case, EURUSD might continue to chop sideways, potentially testing the upper range around $1.18300 or drifting back towards the lower end near $1.17800. This scenario is less likely because the confluence of technical indicators (divergences, oversold/overbought readings) and the sheer volume of high-impact data on the horizon suggest that a period of prolonged indecision is improbable. The market is seeking direction, and the upcoming events are designed to provide it.
Key Levels and What Traders Should Watch
The $1.17546 Line: A Critical Juncture for EURUSD
The support level at $1.17546 on the daily chart is arguably the most critical technical level to watch for EURUSD in the short to medium term. This level has acted as a floor previously, and a sustained break below it would not only invalidate the bullish sentiment suggested by the daily RSI and MACD but also open the floodgates for a move towards lower targets. For bearish traders, a confirmed break below $1.17546, ideally on increased volume and accompanied by dollar strength (DXY rising), would be a compelling signal to enter short positions, targeting $1.17320 and subsequently $1.16977. The 1-hour chart's bearish signals provide tactical entry opportunities on pullbacks towards resistance before such a breakdown occurs.
Conversely, for bullish traders, holding above $1.17546 is paramount. Any dip towards this level that finds buyers stepping in would be seen as a confirmation of the underlying daily strength. The immediate focus would then shift to overcoming the resistance cluster around $1.17927-$1.18158 on the 1-hour chart and, more importantly, the daily resistance at $1.18115. A decisive move and close above $1.18115 would significantly increase the probability of the bullish scenario playing out, targeting $1.18458 and beyond. The key for bulls is to see this resistance broken with conviction, not just a brief pierce. The strength of the ADX on the 4-hour chart (38.1) suggests that if a breakout occurs, it could be substantial, making the confirmation of a break above resistance crucial.
Correlation Analysis: DXY, Equities, and Oil
Understanding the interplay between EURUSD and other major markets is vital. The Dollar Index (DXY) currently presents a mixed picture across timeframes, which adds complexity. However, if the DXY were to break decisively below its support levels (e.g., below 97.50 on the 4-hour chart), it would likely provide a tailwind for EURUSD, supporting the bullish scenario. Conversely, a strong rally in the DXY above 98.00 could coincide with a bearish move in EURUSD.
Equity markets, represented by the S&P 500 (SP500) and Nasdaq 100 (Nasdaq), are also important. Currently, both indices are showing strong bullish momentum on their 1-hour and 4-hour charts, despite some overbought conditions on the daily timeframe. A sustained risk-on sentiment in equities generally correlates with a weaker dollar and potentially stronger EURUSD, especially if the euro's own fundamental story improves. However, if risk appetite falters and equities begin to decline sharply (as suggested by the daily SP500 chart's bearish signal), it could lead to a flight to safety, benefiting the dollar and putting pressure on EURUSD.
Oil prices (Brent and WTI) have recently experienced significant volatility, with a sharp decline following news of the Strait of Hormuz reopening. While this eased immediate inflationary concerns, the geopolitical landscape remains tense. A resurgence in oil prices, driven by renewed supply disruptions or heightened geopolitical risk, could fuel inflation expectations. This would complicate central bank policies, potentially leading to a more hawkish stance from both the Fed and the ECB, the net effect on EURUSD being difficult to predict without knowing which central bank reacts more aggressively. For now, the decline in oil prices might offer some relief to consumers and slightly reduce immediate inflation worries, but the underlying sensitivity remains.
What Different Traders Should Watch
For **scalpers** and **intraday traders**, the focus will be on the 1-hour chart signals. The current bearish leaning suggests looking for opportunities to sell on rallies towards resistance levels like $1.17927-$1.18063, especially if the DXY shows signs of strengthening. However, the weak ADX on this timeframe necessitates tight risk management and quick exits, as reversals can be sharp. The oversold Stochastic could signal short-term buying opportunities if price holds above immediate support.
For **swing traders**, the 4-hour and daily charts are more relevant. The critical support at $1.17546 is the key level. A hold here could present a long opportunity targeting resistance levels around $1.18115-$1.18458. Conversely, a break below $1.17546 would signal a short opportunity targeting $1.17320 and $1.16977. The conflicting signals between the 1-hour bearishness and the daily bullishness mean that confirmation on a break of either the immediate support or resistance is crucial. Waiting for the upcoming economic data releases to provide a clear directional catalyst is advisable.
For **long-term investors**, the daily chart's underlying bullish indicators (RSI 60.87, positive MACD) provide a reason for cautious optimism, but the overbought Stochastic and the strong ADX readings across multiple timeframes warrant patience. Building a position might be prudent on significant dips towards the $1.1700-$1.1750 area, provided these levels hold. A sustained break above the $1.1850-$1.1900 region would be a more convincing signal for a longer-term upward trend. The key for long-term players is to avoid getting caught in the short-term noise and focus on the broader trend confirmation and fundamental shifts, particularly concerning the divergence in central bank policy expectations.
Key Economic Events to Monitor
The upcoming week is packed with crucial economic data that will likely dictate the direction of EURUSD. In the Eurozone, investors will be scrutinizing the latest figures on industrial production and consumer confidence. While the recent inflation spike was notable, the ECB will be looking at the broader economic picture. Any signs of significant economic slowdown could temper expectations of hawkish central bank policy, potentially weighing on the euro. Conversely, resilient growth data would bolster the euro's case.
Across the Atlantic, US data will be paramount. The Retail Sales report is a critical gauge of consumer health. A strong report would reinforce the narrative of a resilient US economy, potentially supporting the dollar by delaying Fed rate cut expectations. However, as mentioned, the market will be looking beyond headline numbers to understand if the growth is driven by actual volume or just inflation. Furthermore, any speeches from Federal Reserve officials will be under intense scrutiny. Markets will be searching for clues regarding the Fed's reaction function to inflation data and their outlook on interest rates. Fed speakers who emphasize the need for continued vigilance against inflation could boost the dollar, while those signaling a quicker path to rate cuts might weaken it. The interplay of these US data points and Fed commentary will be a major driver for EURUSD's movement around the $1.18 level.
Frequently Asked Questions: EURUSD Analysis
What happens if EURUSD breaks decisively below the $1.17546 support level this week?
A break below $1.17546, especially if confirmed by rising DXY and negative US data surprises, would likely trigger a bearish move towards $1.17320 and potentially $1.16977. This would invalidate the daily bullish signals and align with the short-term bearish outlook.
Should I consider buying EURUSD at current levels around $1.18 given the mixed signals?
Buying at current levels carries risk due to intraday bearish pressures and uncertain DXY direction. A more prudent approach might be to wait for a confirmed break above $1.18115 resistance, targeting $1.18458, or for a dip to hold firm above $1.17546 support, offering a better risk-reward ratio (estimated 65% probability of downside first).
Is the RSI at 60.87 on the daily chart a strong buy signal for EURUSD?
While an RSI of 60.87 indicates bullish momentum on the daily timeframe, it's not a standalone buy signal. It suggests underlying strength but needs confirmation from price action, particularly a break above resistance, and should be viewed alongside the overbought Stochastic and conflicting signals on lower timeframes.
How will upcoming US Retail Sales data and ECB commentary impact EURUSD around $1.18?
Stronger-than-expected US Retail Sales could strengthen the dollar, pushing EURUSD towards $1.17546 support. Conversely, hawkish signals from the ECB or weaker US data could support EURUSD, aiming for the $1.18115-$1.18458 resistance zone. The market's interpretation of inflation vs. growth will be key.
Track markets in real-time
AI-powered analysis, technical indicators and real-time price data.
Join Our Telegram Channel
Breaking market news, AI analysis and trading signals instantly.
Join Channel