

Market Overview and the NZDUSD Conundrum
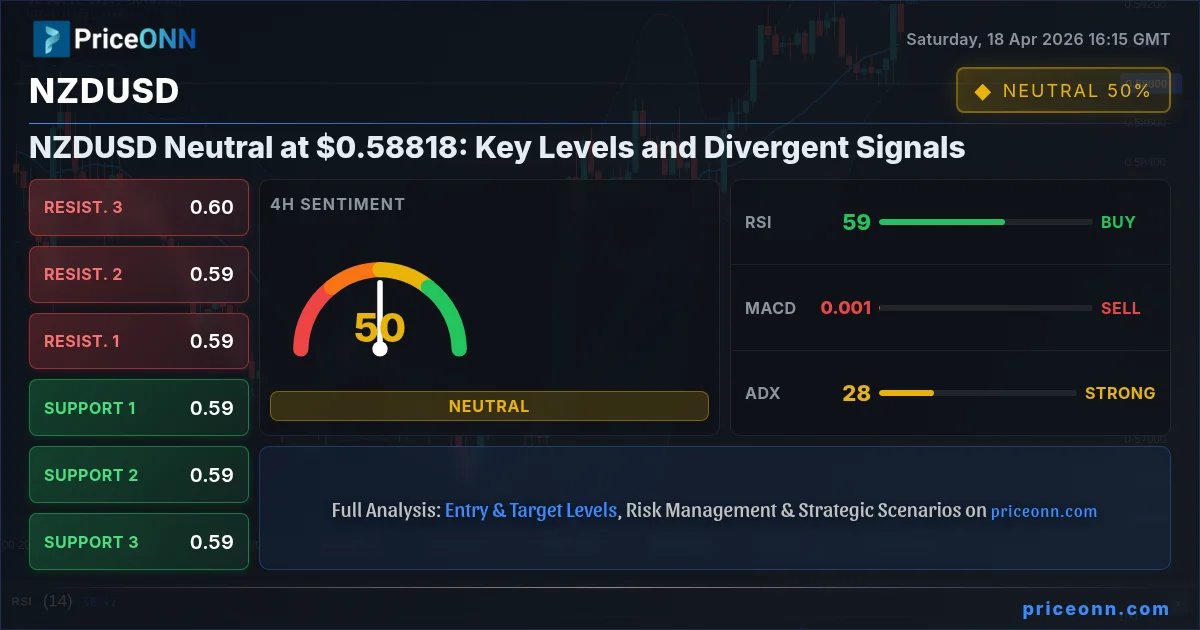
The New Zealand Dollar (NZDUSD) finds itself at a critical juncture, trading around the $0.58818 mark as the weekend approaches. Last week's price action was characterized by a distinct lack of decisive direction, leaving traders and analysts alike scrutinizing various technical and fundamental indicators for clues. This neutrality, however, is not a sign of market apathy but rather a tense equilibrium where opposing forces are battling for control. On one side, the persistent strength of the US Dollar Index (DXY), currently hovering near 97.9, continues to cast a shadow, historically exerting downward pressure on risk-sensitive currencies like the Kiwi. Yet, counterbalancing this is a complex web of global economic data and shifting risk sentiment, which has prevented a clear bearish trend from materializing. The market is currently grappling with conflicting narratives: concerns over global growth and inflation versus the resilience shown by certain economies and the potential for central banks to pivot. This dynamic creates a fertile ground for volatility but also demands a nuanced approach, as any decisive break from current levels could trigger significant follow-through. Understanding the interplay between these factors is paramount for anyone looking to navigate the NZDUSD's path forward.
- RSI at 56.03 on the daily chart signals neutral pressure, with a slight upward lean, indicating neither strong buying nor selling conviction.
- Critical support for NZDUSD sits at $0.58719, a level tested multiple times and holding firm for now.
- MACD histogram shows positive momentum on the 4-hour chart, suggesting potential upside, but the 1-hour signal is negative, indicating short-term caution.
- The correlation with DXY at 97.9 is crucial; a sustained rise in DXY typically weighs on NZDUSD, but recent market action shows a decoupling, demanding closer observation.
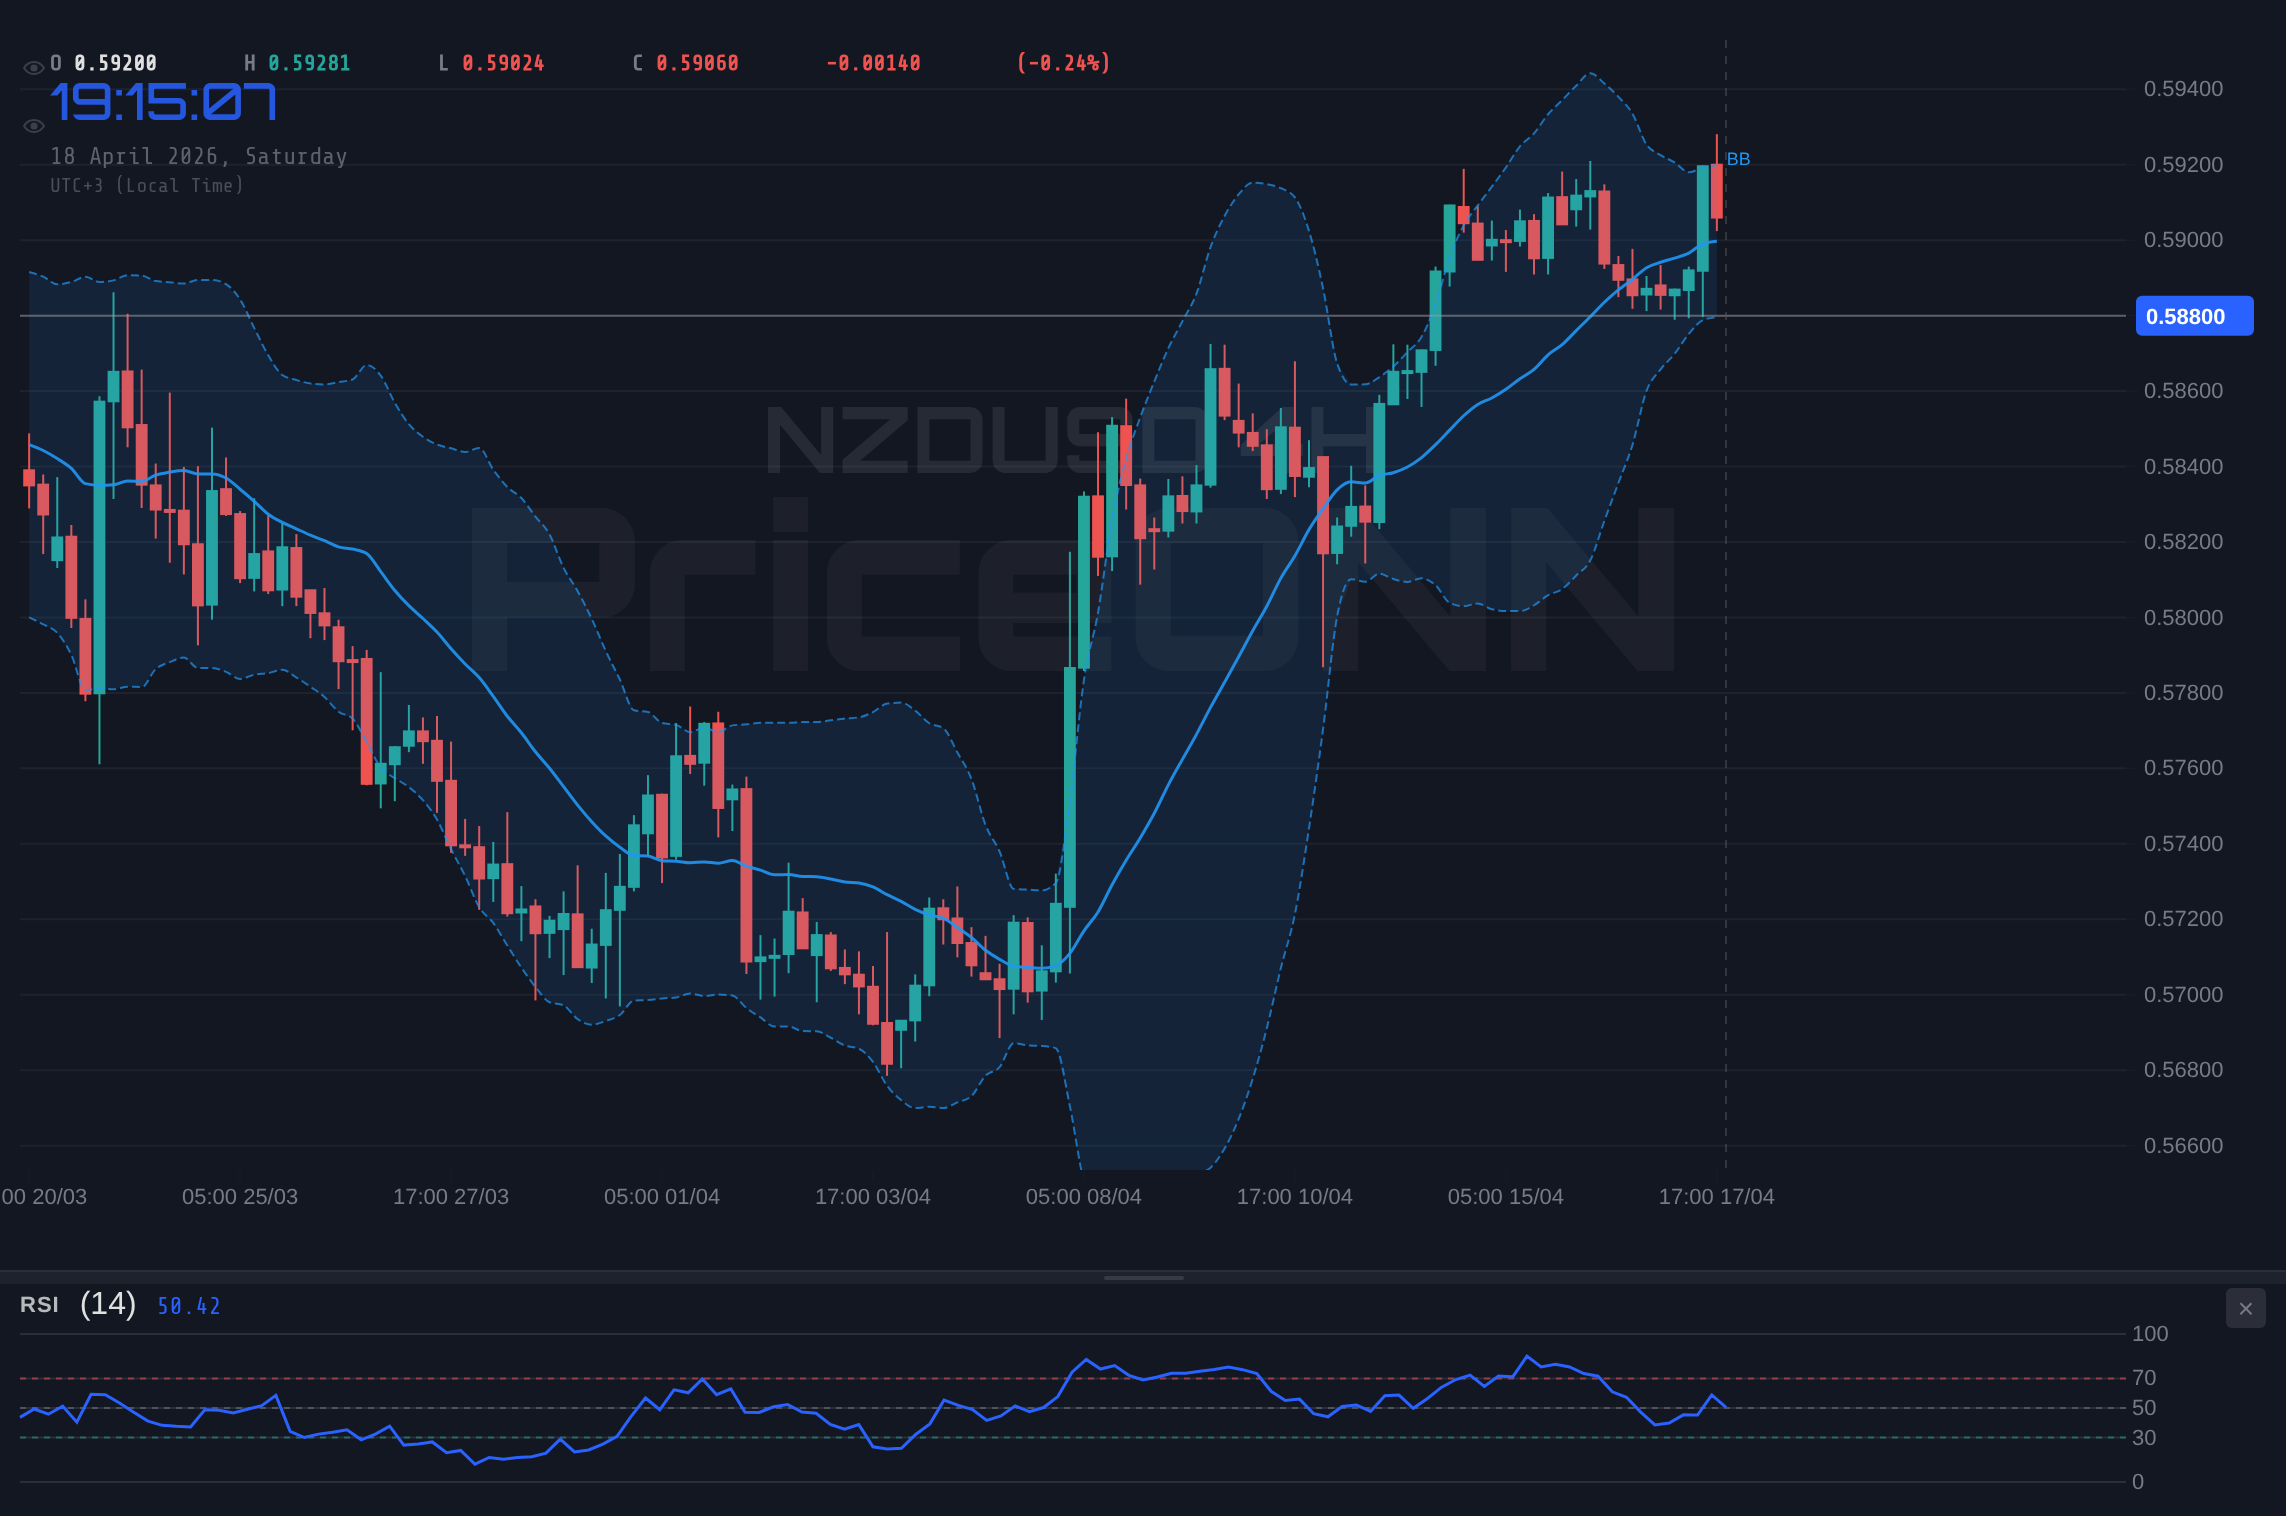
The technical landscape for NZDUSD presents a mosaic of conflicting signals, demanding a multi-timeframe approach. On the 1-hour chart, the trend is decidedly bearish with a strength of 93%, underscored by a negative MACD momentum and an RSI at 44, pointing downwards. Stochastic indicators suggest a potential short-term bounce, but the ADX at 25.63 indicates a strong downtrend is in play, making any upward moves suspect. This suggests that intraday traders might find opportunities on the short side, targeting the immediate support at $0.58834. However, zooming out to the 4-hour timeframe, the picture shifts dramatically. Here, the trend is classified as neutral with 50% strength, but the RSI is at 59.35, showing a clear upward inclination. The MACD is negative, yet Stochastic signals a potential rise, and crucially, the ADX at 28.26 indicates a strong uptrend is building. This divergence between the short-term bearish view and the medium-term bullish undertones creates a complex trading environment. It implies that while short-term traders might be cautious, longer-term players might be looking for confirmation of a bullish reversal.
The daily chart offers the broadest perspective, painting a picture of a neutral trend with 50% strength but with underlying bullish momentum. The RSI at 64.53 resides in neutral territory, leaning towards overbought but far from signaling an immediate sell-off. MACD shows positive momentum, and Stochastic indicators are in the overbought zone (K=86.57, D=88.93), suggesting a potential pullback is due, but without immediate confirmation. The ADX at 25.02 indicates a strong uptrend, which, when viewed alongside the daily Stochastic, creates a classic divergence: strong trend indicators alongside overbought oscillator readings. This is often a precursor to a consolidation or a reversal. For the daily timeframe trader, this suggests caution is warranted. While the overall setup might lean bullish, the current price action around $0.58818 lacks conviction. The key is to watch for confirmation: a sustained move above resistance levels like $0.59117 or a decisive break below support at $0.58719 will be critical in determining the next significant directional move.
The interplay between NZDUSD and its correlated assets paints a clearer, albeit still complex, picture. The US Dollar Index (DXY), currently at 97.9, acts as a primary barometer. Historically, a rising DXY puts significant pressure on the NZDUSD. However, the data reveals a decoupling that demands attention. While the DXY shows mixed signals across timeframes - bullish on 1H, bearish on 4H, and bearish on 1D - its overall trend strength is not decisively in favor of the bulls. This ambiguity in the dollar's direction provides some breathing room for the Kiwi. Furthermore, the performance of major equity indices like the S&P 500 (6572.87) and Nasdaq 100 (26682.75) is crucial. Both are showing strong upward momentum on shorter timeframes, suggesting a risk-on sentiment might be prevailing. If this risk appetite persists, it could lend support to the NZDUSD, overriding some of the dollar's strength. Conversely, any significant downturn in equities could trigger a flight to safety, bolstering the USD and pushing NZDUSD lower. The current divergence between the short-term bearish signals on NZDUSD and the broader risk-on sentiment in equities creates a tense standoff that requires close monitoring.
Examining the energy markets adds another layer to the geopolitical and inflation narrative. Brent Crude is trading at $92.54, and WTI at $86.42, both showing significant daily declines. This drop, particularly after recent geopolitical tensions concerning the Strait of Hormuz, suggests that market fears might be subsiding, or perhaps, the price had overextended on the upside. A sustained decline in oil prices can have a dual effect: it can ease inflationary pressures, potentially giving central banks more room to maneuver and possibly weakening the USD, which would be bullish for NZDUSD. However, it can also signal weakening global demand, a bearish macro-economic indicator that could weigh on risk assets, including the New Zealand Dollar. The fact that oil prices are falling while equities show resilience is an interesting divergence. It suggests that the market might be pricing in a scenario where inflation concerns abate without a significant economic slowdown, a delicate balance that the NZDUSD will be sensitive to. Traders should watch if this oil price correction continues, as it could be a precursor to broader market shifts.
On the fundamental front, the economic calendar provides context for the NZDUSD's recent performance and future outlook. While specific high-impact events are sparse in the immediate weekend window, the data from the past week and upcoming releases are critical. Notably, the US saw mixed retail sales data, with a headline gain driven partly by rising gasoline prices. This underscores the persistent inflationary pressures that the Federal Reserve is monitoring closely. For New Zealand, recent data indicated a contraction in the services sector, with the PSI dropping to 46.0. This economic softness in New Zealand is a significant headwind for the Kiwi, suggesting that the Reserve Bank of New Zealand (RBNZ) might be under pressure to maintain an accommodative stance, or at least delay any hawkish policy shifts. This divergence between a potentially tightening US monetary policy environment (or at least a firm stance on inflation) and a weakening domestic New Zealand economy is a key driver of the NZDUSD's struggle to find a clear direction. The market is pricing in this divergence, creating the neutral bias we see today.
The Bull's Roadmap: Navigating Towards Higher Ground
For the bulls to regain control of the NZDUSD narrative, several conditions must be met, and specific price levels must be decisively breached. The immediate hurdle is the 1-hour resistance at $0.59142. A sustained move above this level, ideally with increasing volume and confirmation from other indicators, would signal a short-term reversal. However, the true test lies higher up. The 4-hour chart points to resistance at $0.60000 (a psychological level) and then the more significant cluster around $0.60300-$0.60500. A break and hold above $0.59117 on the daily chart is the first critical step. If this level is overcome, the next target would be the $0.59362 resistance. A decisive move through this zone, coupled with a weakening DXY and a positive risk sentiment in global equities, could pave the way for a test of the $0.60000 psychological barrier. Further confirmation would come from the daily RSI moving above 65 and the Stochastic exiting the overbought zone without a sharp downturn. This scenario hinges on the market overcoming the current bearish divergence and the underlying weakness in New Zealand's economic data, which makes it a higher-risk, higher-reward proposition.
Bullish Scenario: Kiwi Rebound
25% ProbabilityThe bullish thesis requires a confluence of positive factors. Firstly, a clear weakening of the US Dollar is essential. This could be triggered by softer-than-expected US economic data, such as inflation figures coming in below forecast, or signals from the Federal Reserve suggesting a pause or shift in monetary policy. Simultaneously, positive news from New Zealand, perhaps a surprisingly strong economic report or a hawkish tilt from the RBNZ, would be needed to counterbalance the domestic weakness. On the technical side, a break above the $0.59117 daily resistance is the primary trigger. This would need to be supported by a move of the 4-hour RSI above 60 and confirmation from the MACD turning more decidedly positive. The Stochastic indicators on the daily chart are currently overbought, which adds a layer of caution; a bullish breakout would ideally see these indicators cool slightly before pushing higher, or a period of consolidation would be needed to reset them. If these conditions align, the path towards the $0.59362 level, and potentially the significant psychological barrier at $0.60000, could open up. This scenario represents a significant shift in momentum and would likely require external catalysts rather than purely organic market strength.
Where Bears Take Control: The Downside Risks
The bearish scenario for NZDUSD appears more aligned with the short-term technicals and the underlying economic fundamentals of New Zealand. The primary trigger for a bearish move would be a break below the critical 1-hour support level at $0.58834, followed by a decisive close below the 4-hour support at $0.58661. If this occurs, the market sentiment would likely turn risk-off, putting further pressure on the Kiwi. A strengthening DXY above 98.00 would be a key confirming factor, indicating a flight to safety. Technically, this would involve the 1-hour RSI falling below 40 and the MACD histogram extending its negative momentum. The ADX, already strong on the 1-hour chart, would likely continue to indicate a robust downtrend. The immediate target on a breakdown would be the daily support at $0.58719, followed by the more significant 4-hour support at $0.58527. A break below this level could accelerate the move towards the $0.58321 daily support.
Bearish Scenario: Kiwi Decline
65% ProbabilityThe fundamental backdrop supports this bearish outlook. Weakness in New Zealand's services sector, as indicated by the PSI dropping to 46.0, suggests economic contraction is a real possibility. This could lead to a dovish stance from the RBNZ, widening the interest rate differential against the US, especially if the Fed maintains a hawkish tone on inflation. The recent surge in US gasoline prices, while concerning for consumers, could also be interpreted by the Fed as a sign that inflation remains sticky, reinforcing their resolve. If this narrative plays out, the US Dollar would likely strengthen, creating a powerful headwind for NZDUSD. Technically, the confirmation would come from the daily Stochastic exiting the overbought zone through a sharp decline, and the RSI falling decisively below 50. This scenario paints a picture of continued downside pressure, with rallies likely to be sold into, especially as price approaches the identified resistance levels. For short-term traders, the $0.58834 support is key; a break here opens the door for a move towards $0.58527.
The Waiting Game: Consolidation Around $0.58818
Given the conflicting signals across different timeframes and the lack of immediate catalysts, a period of consolidation around the current $0.58818 level is a distinct possibility. This neutral scenario typically occurs when market participants are waiting for clearer direction from either macroeconomic data releases or significant geopolitical shifts. In this state, the NZDUSD might oscillate within a defined range, defined by the immediate support and resistance levels. On the 1-hour chart, this range could be between $0.5868 and $0.59142, while on the 4-hour, it might extend from $0.58527 to $0.59465. During such consolidation phases, indicators often provide mixed signals, reflecting the indecision in the market. For instance, the RSI might hover around the 50 level, MACD could fluctuate around the zero line, and ADX readings might decrease, indicating a lack of strong trend. Stochastic indicators might bounce between overbought and oversold territories without sustaining extreme readings.
Neutral Scenario: Range-Bound Trading
10% ProbabilityThis neutral scenario implies that neither the bulls nor the bears have gained a decisive advantage. Traders operating within this range-bound environment would focus on identifying support and resistance levels as boundaries for short-term trades, looking to buy near support and sell near resistance. However, the inherent risk in consolidation is the potential for a sudden breakout. When a range breaks, it often does so with significant force, catching range traders off guard. Therefore, even within a neutral scenario, maintaining tight stop-losses and being prepared for a directional move is crucial. The probability of this scenario playing out in the short term is moderate, primarily because the underlying economic data and conflicting technical signals suggest indecision. However, without a major catalyst, price could indeed remain stuck in this range, creating choppy conditions that are difficult to trade profitably. The key takeaway here is that while ranging might seem safe, it often precedes a significant move, and vigilance is required.
Cross-Market Correlations and Their Impact
The performance of the NZDUSD is inextricably linked to a broader ecosystem of financial markets. Understanding these correlations is not just analytical; it's crucial for risk management and identifying potential trading opportunities. The US Dollar Index (DXY) remains the most significant correlation factor. With DXY currently showing a bearish bias on the daily chart (ADX 26.2), this should theoretically support NZDUSD. However, the 1-hour DXY chart is bullish (ADX 22.12), creating a short-term conflict. A sustained move by DXY above 98.00 would likely trigger significant downside in NZDUSD, targeting support levels like $0.58527. Conversely, a DXY break below 97.66 could provide the necessary tailwind for a bullish NZDUSD scenario, potentially aiming for $0.59362.
Equities, particularly the S&P 500 and Nasdaq 100, serve as a gauge for global risk sentiment. The current strength in both indices, especially the Nasdaq's 100% strength on the 1H chart, suggests a risk-on environment. If this sentiment holds, it bodes well for NZDUSD, as investors tend to favor higher-yielding, riskier assets like the Kiwi during such periods. However, the S&P 500's daily chart shows a bearish trend (ADX 47.51), indicating underlying weakness. A reversal in equities, potentially triggered by inflation fears resurfacing or unexpected geopolitical events, could quickly turn sentiment risk-off, hurting NZDUSD and boosting the safe-haven dollar. The oil price correction, with WTI falling below $86.42, adds another layer. While a drop in oil can ease inflation concerns, its significant decline might also signal weakening global demand, which is a negative macro outlook that could ultimately pressure NZDUSD, despite the immediate relief on inflation.
Bond yields also play a critical role. While specific yield data is not provided, rising yields typically strengthen the US Dollar by increasing the attractiveness of dollar-denominated assets. Conversely, falling yields might signal economic concerns or a pivot by the Federal Reserve, potentially weakening the dollar. The relationship between NZDUSD and bond yields is often inverse; higher yields in the US, relative to New Zealand, tend to support USD strength and NZDUSD weakness. Any significant movement in US Treasury yields, particularly the 10-year yield, should be monitored closely as it can corroborate or contradict the signals from the DXY and equity markets. The current technical picture suggests a complex interplay: equities are strong short-term, DXY is mixed, and oil is falling. This creates an environment where NZDUSD could easily whipsaw between levels if any of these correlations break down or shift unexpectedly. The key is to watch for confluence – when multiple correlated assets start signaling the same direction.
What Different Traders Should Watch
Navigating the current NZDUSD environment requires tailoring strategies to different trading styles and time horizons. For scalpers and intraday traders focused on the 1-hour chart, the immediate bearish bias is key. They would be looking for shorting opportunities on rallies towards resistance levels like $0.59142, with tight stop-losses just above, targeting the $0.58834 support. Confirmation would come from MACD histogram continuation to the downside and RSI staying below 50. The high ADX on this timeframe suggests that trending moves, albeit short-lived, are possible, making swift entries and exits crucial.
Swing traders, operating on the 4-hour and daily charts, face a more nuanced picture. The bullish undertones on the 4-hour chart (RSI 59.35, ADX 28.26) and the mixed daily signals suggest a potential for a reversal, but confirmation is vital. They would be watching for a decisive close above the daily resistance at $0.59117 as a primary buy signal, invalidating the bearish short-term outlook. Targets would then be set at $0.59362 and potentially $0.60000. Conversely, a break and hold below the 4-hour support at $0.58661 would signal a bearish continuation, with targets at $0.58527 and $0.58321. Risk management is paramount here, with stop-losses placed beyond the immediate support or resistance levels that define the trade.
Long-term investors and position traders will be focused on the broader economic fundamentals and the potential for a sustained trend change. They will be watching for signs of a significant shift in monetary policy from either the Federal Reserve or the Reserve Bank of New Zealand, as well as sustained changes in global risk sentiment. A break and hold above the psychological $0.60000 level on the weekly chart, coupled with improving economic data from New Zealand and a sustained weakening of the DXY below 97.00, would be required to signal a long-term bullish trend. Conversely, a sustained break below $0.58000, driven by persistent economic weakness in NZ and a strong USD, could indicate a longer-term bearish outlook. For these traders, patience is key, waiting for clear signals rather than trying to catch falling knives or prematurely buying into rallies.
The Path Forward: Key Triggers and Next Steps
As the market digests the current confluence of technical signals and fundamental narratives, several key triggers will dictate the next significant move for NZDUSD. Firstly, the upcoming economic data releases, particularly any surprise inflation figures or employment numbers from the US, will be critical. A significant deviation from forecasts could rapidly shift market sentiment and impact the DXY, thereby influencing NZDUSD. Secondly, the performance of global equities remains a vital barometer of risk appetite. A sustained rally or a sharp correction in indices like the S&P 500 and Nasdaq 100 will provide clues about the prevailing market mood. Finally, on the technical front, the $0.58661 support and $0.59117 resistance levels on the daily chart are the immediate battlegrounds. A decisive breach of either level, confirmed by volume and oscillator readings, will likely set the tone for the coming week.
Frequently Asked Questions: NZDUSD Analysis
What happens if NZDUSD breaks decisively below the $0.58661 support level this week?
A close below $0.58661 would invalidate the short-term bullish divergence and likely trigger further downside. The immediate target would be $0.58527, with a secondary target at $0.58321. This scenario is supported by a rising DXY above 98.00 and negative sentiment in equities.
Should I consider buying NZDUSD at current levels around $0.58818 given the mixed signals?
Buying at current levels carries significant risk due to the bearish short-term signals and underlying economic weakness in NZ. A more prudent approach would be to wait for a confirmed break above $0.59117 resistance, targeting $0.59362, or to wait for a test of the $0.58527 support for a potential long entry with clear invalidation.
Is the RSI at 56.03 on the daily chart a reason to buy NZDUSD right now?
An RSI of 56.03 indicates neutral momentum with a slight upward lean, but it is not a direct buy signal on its own. It suggests the market is not yet overbought, but confirmation from other indicators and price action, such as breaking key resistance levels, is needed before considering a bullish position.
How will upcoming US inflation data affect NZDUSD this week?
Higher-than-expected US inflation could strengthen the USD, pressuring NZDUSD lower towards $0.58527. Conversely, softer inflation might lead to a Fed pause narrative, weaken the dollar, and potentially support a move above $0.59117 for NZDUSD.
| Indicator | Value | Signal | Interpretation |
|---|---|---|---|
| RSI (14) | 56.03 | Neutral | Slight upward momentum, not overbought. |
| MACD Histogram | 0.0015 | Bullish | Positive momentum building on 4H, but caution needed on 1H. |
| Stochastic | K:86.57, D:88.93 | Overbought | Suggests a potential pullback is due, look for confirmation. |
| ADX | 25.02 | Strong Trend | Indicates a strong existing trend, but direction needs confirmation. |
| Bollinger Bands | Mid Band | Watch | Price is above the middle band, suggesting upward pressure. |
Track markets in real-time
AI-powered analysis, technical indicators and real-time price data.
Join Our Telegram Channel
Breaking market news, AI analysis and trading signals instantly.
Join Channel