

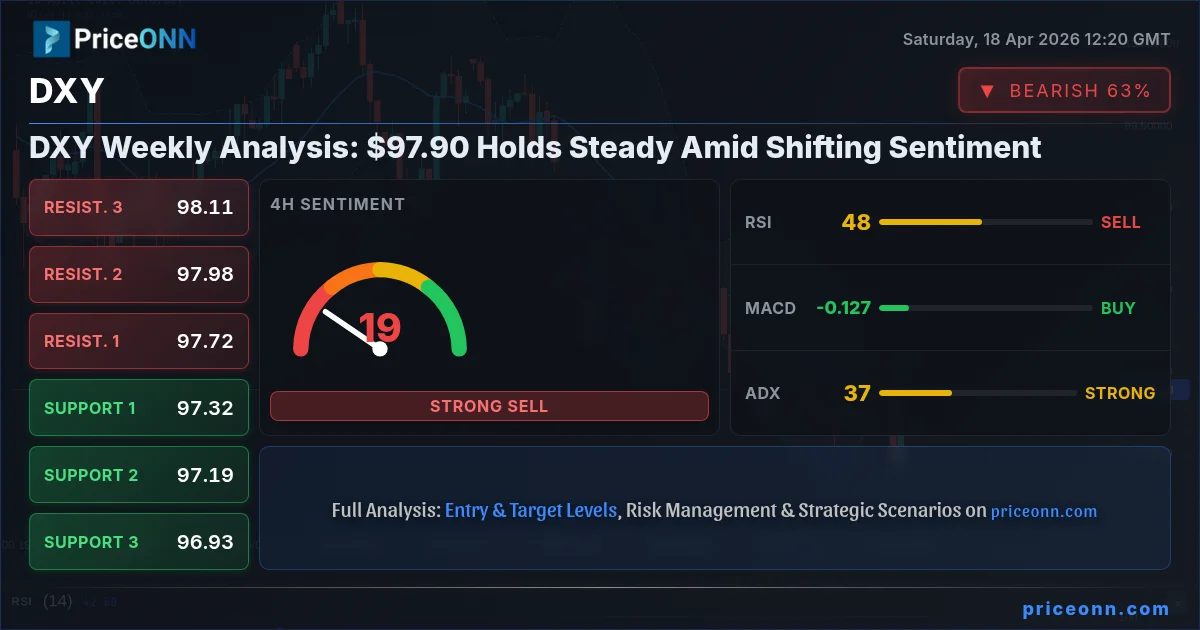
The US Dollar Index (DXY) concluded a remarkably flat week, hovering around the critical $97.90 mark. While major headlines swirled and volatility brewed in other markets, the dollar index itself remained largely range-bound. This period of consolidation, however, appears to be a temporary pause rather than a definitive trend. With significant economic data releases on the horizon and geopolitical tensions simmering, the DXY is poised at a crucial juncture. Understanding the interplay of technical indicators, upcoming events, and market correlations is paramount for navigating the potential moves ahead.
- RSI at 47.84 on the 4H chart signals potential for a downward trend, but the 1D RSI at 40.62 shows continued bearish momentum.
- Critical support for DXY sits at $97.32, tested multiple times this week, while resistance is firming up around $97.73.
- The ADX at 37.19 on the 4H chart indicates a strong downward trend, conflicting with the weaker trend on the 1D (ADX: 26.2).
- Fed rate expectations and upcoming retail sales data are key macro drivers that could break the current DXY stalemate.
This week's price action for the DXY can best be described as a holding pattern. After a period of significant movement, the index seems to be catching its breath. The $97.90 level has acted as a pivot, with price oscillating between support around $97.32 and resistance near $97.73. This tight range suggests indecision among market participants, likely awaiting clearer directional cues. The lack of a decisive breakout or breakdown indicates that neither the bulls nor the bears have gained a firm upper hand. However, the underlying technicals present a complex picture, with conflicting signals across different timeframes that demand careful interpretation.
The 4-hour chart offers a compelling narrative of underlying weakness. The ADX stands at a strong 37.19, indicating a robust downward trend is in play. This is further supported by the RSI reading of 47.84, which, while not deeply oversold, suggests that selling pressure is more dominant than buying interest. The Stochastic indicator, with %K at 48.11 and %D at 73.04, also points towards a bearish divergence, hinting at a potential continuation of the downtrend. On this timeframe, the overall signal leans towards selling, reflecting a bearish sentiment that could push the dollar lower if sustained.
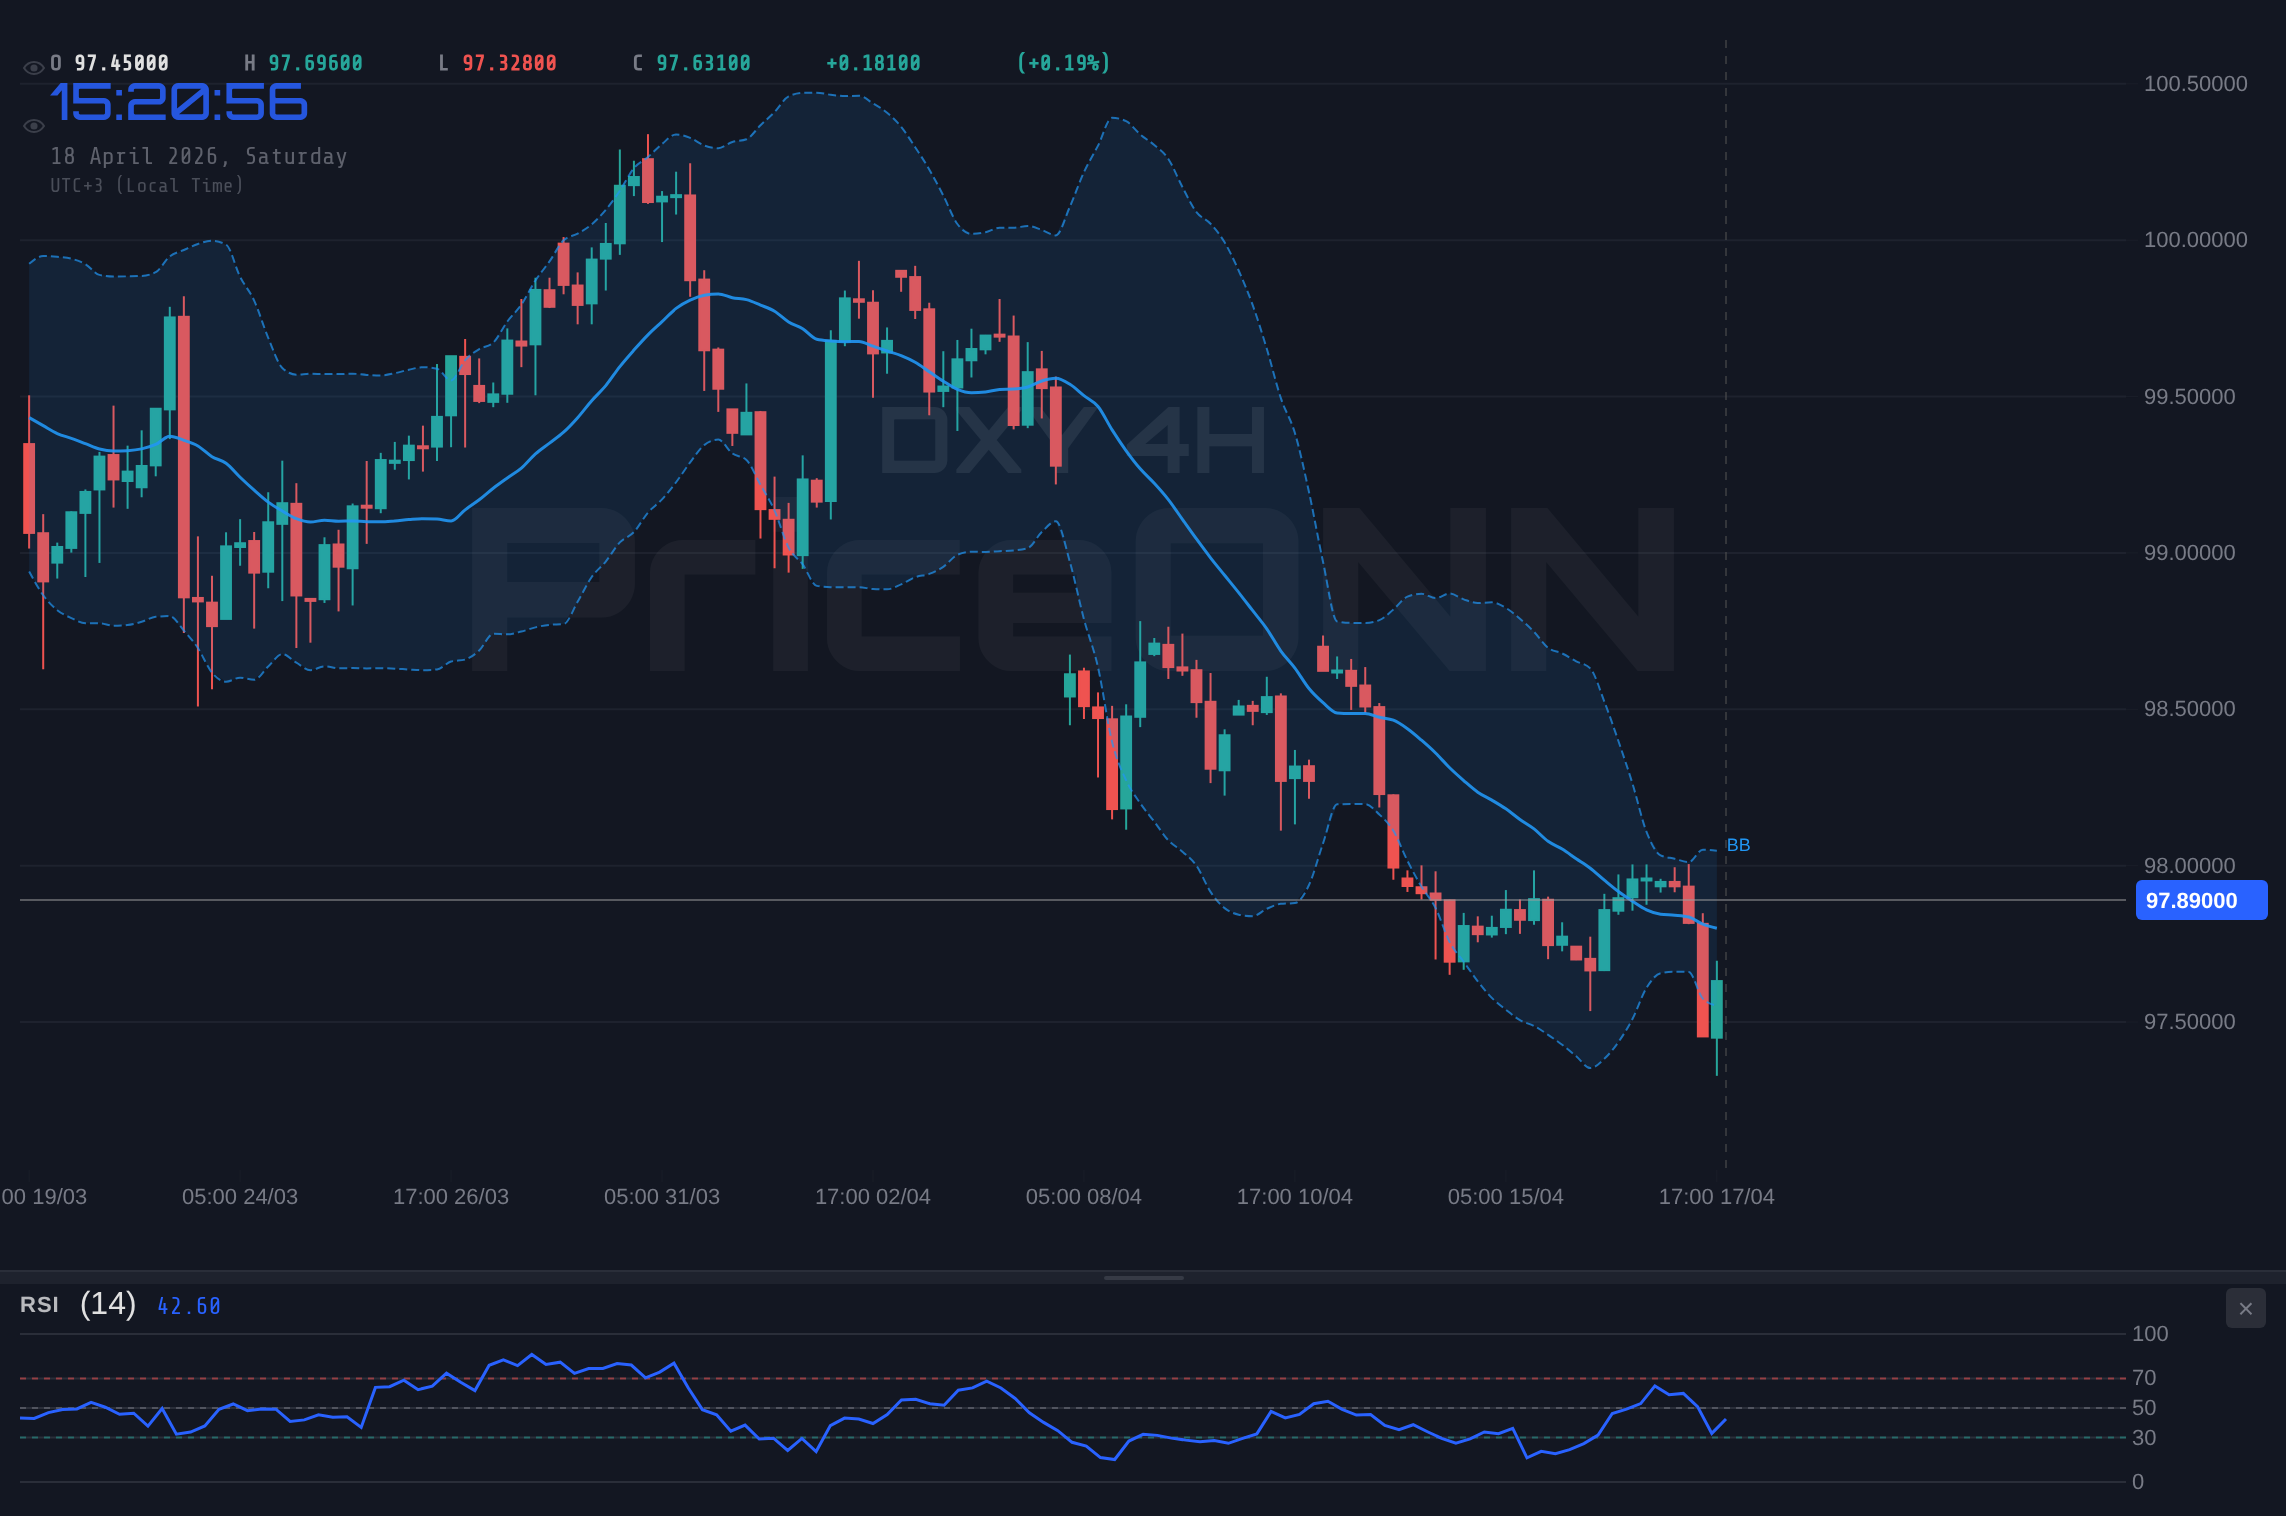
However, the daily chart presents a slightly different, though still predominantly bearish, perspective. The ADX here is lower at 26.2, indicating a medium-strength downward trend, less assertive than the 4-hour signal. The RSI is further down at 40.62, reinforcing the bearish momentum, and the Stochastic is firmly in oversold territory with %K at 15.25 and %D at 9.38. The MACD also shows negative momentum, sitting below its signal line. Despite the bearish readings, the overall strength of the trend on the daily chart is less pronounced, suggesting that the downward move might be losing some steam or facing significant buying interest at lower levels. This divergence in trend strength between the 4H and 1D charts is a key point of observation.
The Bull's Roadmap: Can DXY Find Footing Above $97.73?
For the bulls to regain control, a decisive move above the immediate resistance at $97.73 is non-negotiable. This level has acted as a ceiling throughout the week, capping any upward attempts. A sustained break and hold above $97.73, ideally with increasing volume, would be the first sign of a potential shift in sentiment. The next significant hurdle would be the $97.98 mark, a level that previously capped rallies. If DXY can clear this, the psychological $98.00 level comes into play, followed by the more substantial resistance zone around $98.11 and $98.30. The 1-day chart's Stochastic indicator, currently showing oversold conditions, could provide the impetus for such a bounce if it begins to turn upwards and crosses above its signal line.
Technically, a bullish scenario would require several indicators to align. The RSI would need to move decisively out of the neutral zone and ideally break above 50 on the daily chart. The MACD, currently displaying negative momentum on both 4H and 1D charts, would need to generate a bullish crossover, with the MACD line moving above the signal line. Furthermore, the ADX needs to show a weakening trend (falling below 20-25) or a clear shift to an uptrend. The current strength of the downward trend indicated by the ADX on the 4H chart (37.19) presents a significant headwind for any bullish aspirations. A break above the upper Bollinger Band on the 1D chart would also serve as a confirming signal, though this is currently some distance away.
The primary trigger for a bullish reversal would likely be a significant shift in Federal Reserve policy expectations or a major geopolitical event that drives safe-haven demand away from other assets and towards the US dollar. For instance, stronger-than-expected US inflation data or hawkish commentary from Fed officials could quickly change the narrative. On the charts, a confirmed break above the $97.73 resistance, followed by a hold above $97.98, would set the stage for a potential test of the $98.11 support level. If this bullish momentum sustains, the next target would be $98.30, and potentially higher towards $98.60. However, given the current technical setup, this remains a less probable scenario in the short term without a significant catalyst.
Upcoming US Retail Sales data and potential Fed commentary could introduce significant volatility. Traders should exercise caution and ensure adequate risk management is in place.
Where Bears Take Control: Testing the $97.32 Floor
The bearish case for the DXY remains compelling, primarily driven by the strong trend signals on the 4-hour chart. A break below the immediate support at $97.32 would be the first critical confirmation for bears. This level has already been tested multiple times this week, and a decisive close below it would signal a breakdown of the current consolidation range. Following this, the next key support level to watch is $97.19, a level that has not been tested in recent price action and could represent a significant psychological barrier. Further down, the $96.93 support area would become the next target for bears.
The technical indicators on the 4-hour chart strongly favor a bearish continuation. The RSI at 47.84 suggests room to fall further into oversold territory, and the ADX at 37.19 confirms the strength of the existing downtrend. The Stochastic's bearish divergence further supports this outlook. On the daily chart, while the trend strength is less pronounced (ADX 26.2), the RSI at 40.62 and the oversold Stochastic readings indicate that there is still significant downward pressure. A break below $97.32 would likely trigger further selling, potentially accelerating the move towards lower support levels. The MACD on both timeframes continues to show negative momentum, adding weight to the bearish argument.
The primary catalyst for a bearish move could be a surprisingly weak US economic data release, particularly the upcoming Retail Sales figures, or a shift in market sentiment towards risk-on assets, which would typically weaken the dollar. If US Retail Sales come in significantly below the forecast of 10.3%, it could signal a slowdown in consumer spending, prompting the market to reassess the Federal Reserve's monetary policy stance. This could lead to a sell-off in the dollar, pushing the DXY towards the $97.19 and $96.93 support levels. A close below $97.19 would open the door for a more significant decline, potentially targeting the $96.66 area, although this would require a substantial catalyst.
The Waiting Game: Navigating the $97.32 - $97.73 Consolidation
The neutral scenario hinges on the DXY remaining trapped within its current trading range, primarily between the support at $97.32 and the resistance at $97.73. This sideways movement could persist if conflicting economic signals emerge, or if upcoming data releases are mixed, failing to provide a clear directional bias. In such a scenario, intraday traders might find opportunities within the range, but significant upside or downside potential would be limited until a clear breakout occurs. This consolidation phase is often characterized by lower volatility and a lack of strong trending momentum, making it challenging for trend-following strategies.
From a technical standpoint, a neutral range-bound environment means that indicators may provide conflicting signals. For example, the RSI could hover around the 50 level, indicating balance between buyers and sellers. The MACD might oscillate around the zero line, showing little sustained momentum in either direction. The ADX, crucial for trend identification, would likely remain below 20-25, signifying a weak or non-existent trend. Bollinger Bands might begin to narrow, a classic sign of consolidation before a potential breakout. Stochastic oscillators could fluctuate within the mid-range, failing to give clear overbought or oversold signals that lead to sustained moves.
This waiting game could be extended if key economic events produce ambiguous results. For instance, if US Retail Sales data comes in close to forecasts, and Fed officials maintain a balanced tone in their public statements, the DXY might continue to consolidate. This scenario would suit range-trading strategies, where traders look to buy near support and sell near resistance. However, the underlying bearish technical signals, particularly the strong ADX on the 4-hour chart, suggest that this neutral phase might be a precursor to a further decline rather than a stable equilibrium. The longer the DXY stays within this range, the more significant the eventual breakout is likely to be.
Bearish Scenario: Dollar Under Pressure
65% ProbabilityNeutral Scenario: Range-Bound Trading
25% ProbabilityBullish Scenario: Dollar Rebound
10% ProbabilityWhat's Next for the DXY? Key Events and Levels to Watch
Looking ahead, the DXY's path will likely be dictated by upcoming economic data and central bank commentary. The US Retail Sales report is a critical piece of information that could provide insights into consumer spending resilience amidst rising energy costs and inflation concerns. A significantly weaker-than-expected result would undoubtedly put downward pressure on the dollar, potentially triggering the bearish scenario outlined above. Conversely, a strong report could bolster the dollar, though the market might remain cautious given the conflicting signals from other economic indicators.
The Federal Reserve's stance remains a dominant factor. While rate cuts are still anticipated later in the year, the timing and pace are highly dependent on incoming inflation and employment data. Any hints from Fed officials suggesting a more hawkish outlook, perhaps due to persistent inflation or a resilient labor market, could provide a significant boost to the DXY. Conversely, dovish remarks or data pointing towards an economic slowdown would likely weigh on the dollar. Traders will be scrutinizing every piece of commentary for clues about the future path of monetary policy.
From a technical perspective, the levels discussed remain the key focus. The $97.32 support is the immediate line in the sand for the bears. A break here opens up the path towards $97.19 and $96.93. On the upside, $97.73 acts as the primary resistance that needs to be overcome for any bullish sentiment to take hold, with $97.98 and $98.11 as subsequent targets. The divergence in trend strength between the 4-hour (strong downtrend) and daily (medium downtrend) charts adds complexity, suggesting that while the immediate pressure may be downwards, a sustained move lower requires confirmation.
The correlation with other markets will also be crucial. As noted, rising oil prices ($92.54 for Brent, $86.42 for WTI) can fuel inflation concerns, potentially leading to a stronger dollar if the Fed is perceived to maintain a hawkish stance. However, if oil prices lead to a significant economic slowdown, it could trigger risk-off sentiment, which sometimes favors the dollar as a safe haven, but can also lead to broad commodity sell-offs impacting riskier currencies. The performance of equity indices like the S&P 500 (6572.87) and Nasdaq (26682.75) will also provide context for risk appetite. A continued rally in equities might see the DXY under pressure, while a sell-off could offer it some support.
Ultimately, the DXY appears to be in a precarious position. The technical indicators lean bearish, especially on the shorter timeframes, and upcoming economic data holds the potential to catalyze a significant move. The most probable outcome in the short term, given the current data and range-bound action, is a continued test of the downside. However, the market is dynamic, and a shift in central bank expectations or geopolitical events could quickly alter this outlook. Vigilance around the key support and resistance levels discussed will be essential for navigating the DXY's next directional move.
Frequently Asked Questions: DXY Analysis
What happens if DXY breaks below the $97.32 support level this week?
A break below $97.32 on the 4-hour chart would likely trigger further selling pressure, confirming the bearish scenario. The next immediate targets would be $97.19 and then $96.93. This move would be invalidated if price quickly recovers and holds above $97.73.
Should I consider a short position if DXY holds resistance at $97.73, given the RSI at 47.84?
While the RSI at 47.84 on the 4H chart suggests bearish momentum, it's not yet an oversold signal. A short position would be more compelling if price fails to break $97.73 and shows signs of reversal, like a bearish MACD crossover or a close below $97.32. Risk management is crucial as the market awaits key data.
How does the strong ADX of 37.19 on the 4H chart influence the DXY outlook?
The ADX at 37.19 strongly indicates a defined downward trend on the 4-hour timeframe. This suggests that momentum is with the sellers, making a bearish continuation more probable than a bullish reversal, unless significant counter-signals emerge or key data shifts sentiment.
How will upcoming US Retail Sales data impact the DXY's $97.90 level?
If US Retail Sales significantly miss forecasts (forecast: 10.3%), it could lead to a DXY decline below $97.32 as markets price in Fed easing. Conversely, a strong report might push DXY towards $97.98 resistance, provided other factors don't intervene.
| Indicator | Value | Signal | Interpretation |
|---|---|---|---|
| RSI (14) | 40.62 | Bearish | Continued downward momentum on Daily |
| MACD Histogram | -0.06 | Bearish | Negative momentum on Daily |
| Stochastic (%K/%D) | 15.25 / 9.38 | Oversold | Potential bounce zone, but trend is strong |
| ADX | 26.2 | Bearish | Medium-strength downward trend on Daily |
| Bollinger Bands | Below Middle Band | Bearish | Price below average, indicating downward pressure |
The DXY's stagnant performance this week belies the potential for significant moves ahead. While the $97.90 area has acted as an equilibrium point, the underlying technical structure, particularly the strong downward trend signals on the 4-hour chart, suggests that the path of least resistance may be lower. Traders must remain vigilant for key economic data releases and any shifts in Federal Reserve policy expectations, as these are likely to be the catalysts that break the current consolidation. Managing risk and adhering to defined levels will be crucial for navigating the forthcoming volatility.
Track markets in real-time
AI-powered analysis, technical indicators and real-time price data.
Join Our Telegram Channel
Breaking market news, AI analysis and trading signals instantly.
Join Channel