

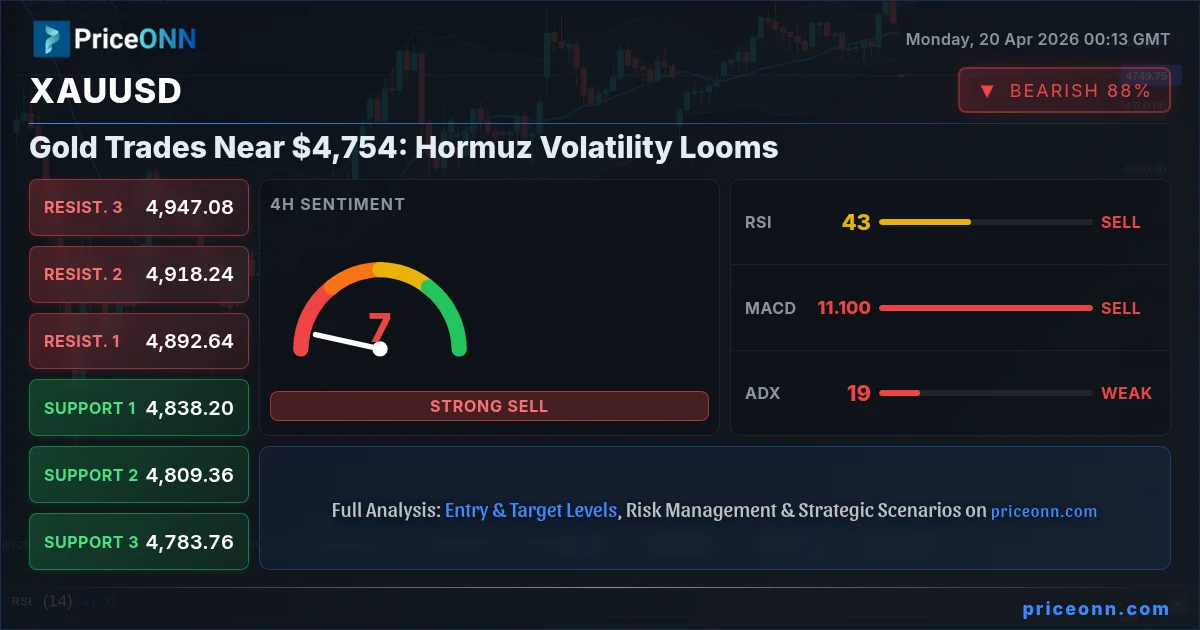
The specter of geopolitical instability is once again casting a long shadow over global markets, with gold prices finding themselves at a critical juncture near the $4,754 mark. Recent developments, particularly concerning the Strait of Hormuz, have injected a fresh dose of volatility, prompting traders to re-evaluate their risk exposure. While the immediate technical picture for XAUUSD suggests a cautious approach, the underlying geopolitical currents are creating a complex trading environment.
This article delves into the intricate interplay between geopolitical events and gold's price action, examining the current technical landscape and the crucial levels that traders are watching. We will explore how the situation in the Strait of Hormuz, coupled with broader market sentiment and the actions of central banks, is shaping the outlook for the precious metal. Understanding these dynamics is paramount for navigating the choppy waters ahead.
- RSI at 32.16 on the 1H chart signals oversold pressure, while the 1D RSI remains neutral at 49.28.
- Critical support for XAUUSD sits at $4,759.75, tested multiple times in the short term.
- MACD histogram shows negative momentum on 1H and 4H, suggesting bearish pressure, but turns positive on the daily chart.
- The DXY is currently at 98.11, with a strengthening trend on the 1H chart, potentially pressuring gold prices.
Navigating Geopolitical Fault Lines: The Hormuz Factor
The recent rapid shifts in passage control through the Strait of Hormuz have sent ripples across energy markets and, by extension, the broader financial landscape. While reports suggest a temporary reopening or easing of restrictions, the mere fact that such a critical chokepoint for global oil supply can be so easily influenced underscores the persistent geopolitical risks. This heightened tension typically fuels demand for safe-haven assets, with gold often being the primary beneficiary. However, the immediate price action for XAUUSD tells a more nuanced story, indicating that the market is weighing multiple factors simultaneously.
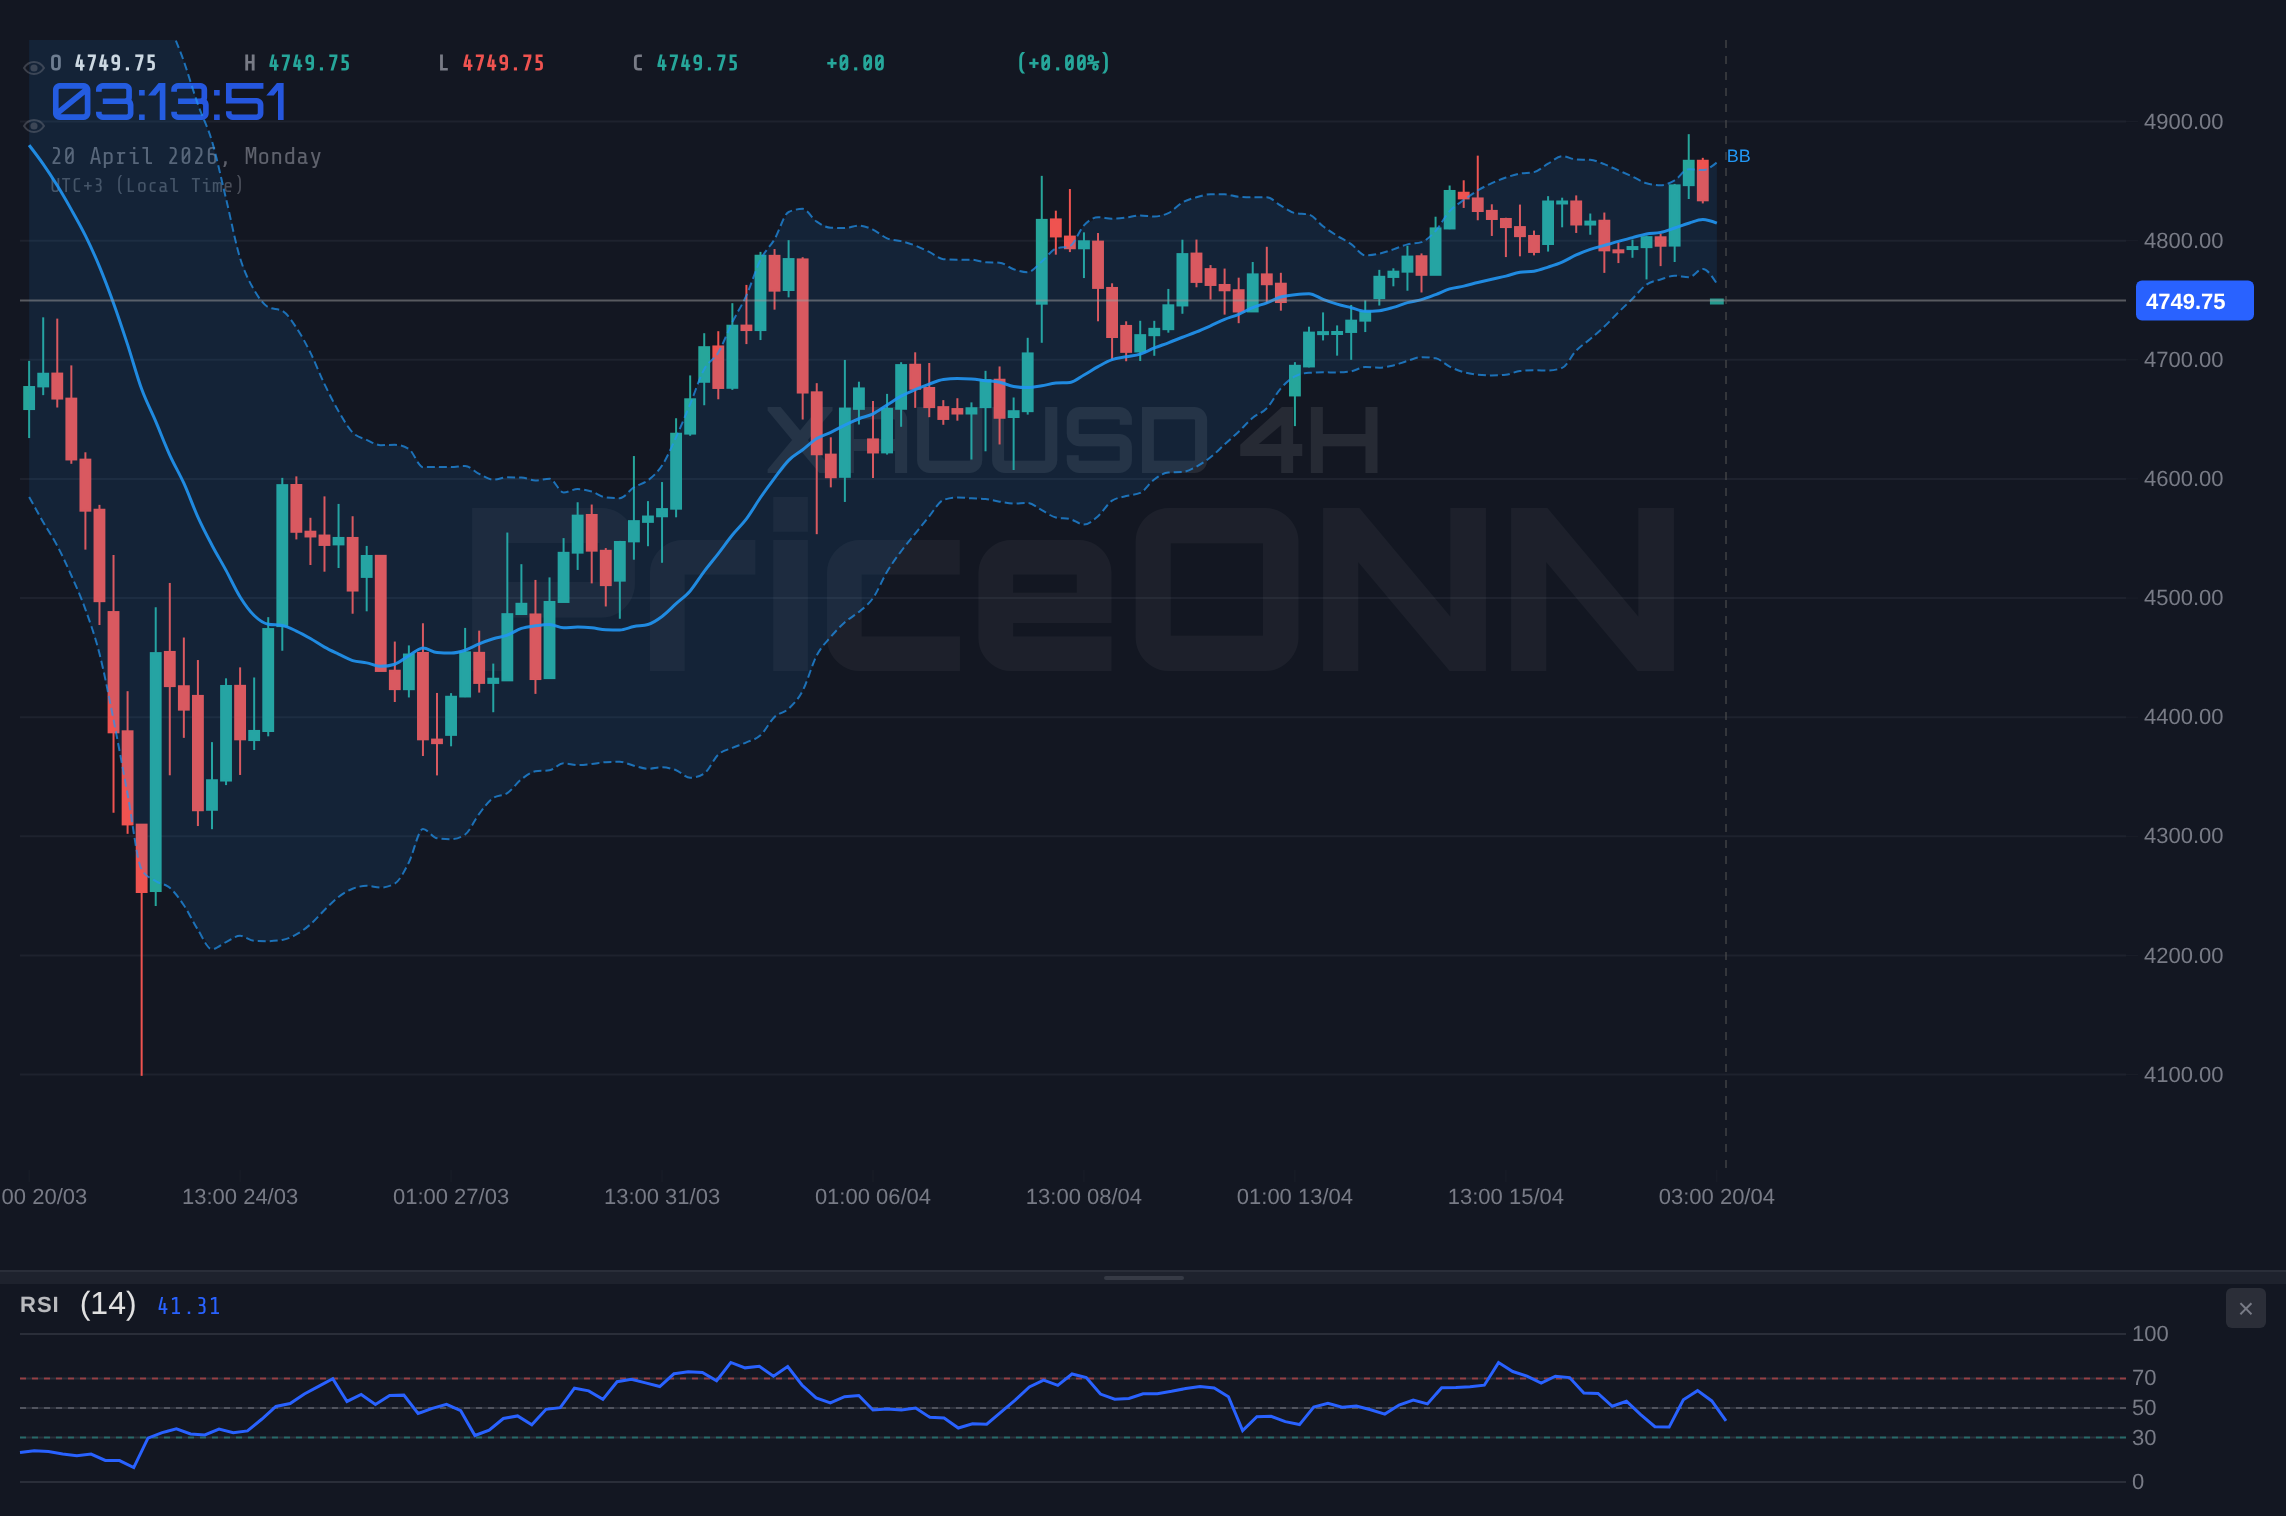
The current price of $4,754.18 for gold reflects this delicate balance. On one hand, the potential for supply disruptions in the energy sector should theoretically boost gold prices. On the other hand, the strength of the US Dollar, as indicated by the Dollar Index (DXY) currently trading at 98.11 and showing a strengthening trend on the 1H chart, acts as a counteracting force. A stronger dollar typically makes dollar-denominated assets like gold more expensive for holders of other currencies, potentially dampening demand. This push and pull between geopolitical fear and currency strength creates a complex environment for traders trying to decipher gold's next move.
Technical Cross-Currents: What the Charts Reveal
Delving into the technical indicators provides a clearer, albeit still complex, picture of XAUUSD's immediate prospects. On the 1-hour timeframe, the trend is assessed as neutral with a strength of 50%. The RSI(14) at 32.16 hovers in neutral territory but leans towards a bearish inclination, suggesting some selling pressure. This is further supported by the MACD, which is exhibiting negative momentum with the MACD line below its signal line. The Stochastic oscillator, with K at 22.39 and D at 57.82, also signals a bearish trend, indicating that the market is oversold on this short timeframe. The ADX at 28.85 further confirms a strong downtrend on this timeframe, painting a picture of short-term weakness.
However, zooming out to the 4-hour chart reveals a different narrative. Here, the trend is described as bullish with a strength of 90%. The RSI(14) is at 43.3, still in neutral territory but showing a downward tendency. The MACD remains negative, but the Stochastic oscillator shows a bullish signal with K (60.05) above D (50.73), suggesting a potential upward momentum. The ADX at 19.01 indicates a weaker trend on this timeframe, suggesting a more range-bound or consolidating market. This divergence between the short-term bearish signals and the medium-term bullish outlook highlights the indecision currently present in the gold market.
The Daily Chart: A Foundation of Neutrality
The daily chart for XAUUSD provides a broader perspective, currently indicating a neutral trend with 50% strength. The RSI(14) sits at 49.28, just below the midpoint, and shows a downward inclination. The MACD, however, presents a more positive outlook on this timeframe, displaying positive momentum with the MACD line above its signal line. Bollinger Bands are situated above the middle band, hinting at a potential upward bias. Yet, the Stochastic oscillator provides a conflicting signal, with K at 65.58 and D at 76.33, indicating a bearish signal as %K falls below %D and is moving out of overbought territory. The ADX at 22.43 suggests a medium-strength downtrend.
This mixed picture across different timeframes underscores the current market condition for gold. The 1-hour chart leans bearish, the 4-hour chart shows bullish potential despite some headwinds, and the daily chart offers a neutral stance with conflicting indicators. This lack of a clear directional consensus means that price action will likely be driven by significant news events or a decisive break of key technical levels. The immediate support level to watch on the 1-hour chart is $4,759.75, with further support at $4,740.44 and $4,722.93. Resistance is seen at $4,796.57, $4,814.08, and $4,833.39.
Correlations and Macroeconomic Undercurrents
Understanding XAUUSD's movements requires looking beyond its own charts to its correlations with other key markets. The Dollar Index (DXY) is a primary driver. Currently trading at 98.11, the DXY shows a strengthening trend on the 1-hour timeframe, which typically exerts downward pressure on gold prices. A higher dollar makes gold more expensive for foreign buyers, potentially curbing demand. Traders are closely monitoring the DXY's ability to maintain its upward momentum; a decisive move above its 1-hour resistance at 98.04 could signal further headwinds for gold.
Furthermore, the performance of major equity indices like the S&P 500 and Nasdaq provides insights into market risk appetite. The S&P 500 is currently trading at 6,572.87, showing a strong upward trend on the 1-hour chart, suggesting a generally positive risk sentiment. However, its daily trend is bearish, and its 1-hour RSI is nearing overbought territory at 70.95, indicating potential for a pullback. If risk appetite falters and equities begin to decline, this could, paradoxically, support gold as a safe-haven asset, despite a stronger dollar. This interplay between risk-on sentiment in equities and the safe-haven appeal of gold, complicated by dollar strength, is the core of the current market dynamic.
The Role of Oil Prices and Inflation Expectations
Oil prices, particularly Brent crude currently at $97.75, are intrinsically linked to inflation expectations and geopolitical stability. The volatility surrounding the Strait of Hormuz directly impacts oil supply concerns. Should tensions escalate and lead to significant supply disruptions, we could see a surge in oil prices, which in turn would likely fuel inflation expectations. Historically, gold has acted as a hedge against inflation, making it an attractive asset during periods of rising energy costs and broader price increases. The current daily chart for Brent shows a neutral trend, but the 1-hour chart exhibits a bullish signal, suggesting that oil could be poised for further gains if geopolitical risks continue to simmer.
Conversely, if the geopolitical situation de-escalates and oil prices stabilize or decline, this could reduce inflationary pressures. This scenario might lessen the appeal of gold as an inflation hedge, potentially contributing to its price weakness, especially if coupled with a strong dollar and risk-on sentiment in equities. The interplay between energy prices, inflation, and gold's role as a hedge is a critical piece of the puzzle for any gold trader to consider. The ADX on the daily Brent chart is 34.16, indicating a strong downtrend, which might suggest that the immediate inflationary fears from oil are abating, though the 1-hour chart shows a bullish signal with ADX at 35.38.
Trade Scenarios: What Needs to Happen for a Clear Setup?
Given the conflicting signals across timeframes and the influence of external factors, gold is currently in a 'watch zone'. A clear trading setup requires a decisive catalyst or a confirmation of a trend. For a bullish scenario to materialize, we would need to see XAUUSD decisively break above its immediate 1-hour resistance at $4,796.57. This would need to be accompanied by a sustained weakening of the DXY and perhaps a resurgence in risk-off sentiment affecting equity markets. Such a move would likely invalidate the short-term bearish signals and confirm the bullish potential seen on the 4-hour chart.
Conversely, a bearish scenario would be confirmed if gold prices fall decisively below the key 1-hour support level of $4,759.75. A break below this level, especially on significant volume, could trigger further selling, targeting the next support at $4,740.44. This would align with the bearish signals on the 1-hour chart and potentially signal a deeper correction. Invalidation of this bearish thesis would occur if price fails to hold below $4,759.75 and instead rallies back above the $4,796.57 resistance. For now, the market is characterized by uncertainty, making it prudent to wait for clearer directional cues.
Bullish Scenario
Bullish Scenario: Geopolitical Fears Reignite Demand
60% ProbabilityNeutral Scenario
Neutral Scenario: Choppy Trading Amidst Uncertainty
30% ProbabilityBearish Scenario
Bearish Scenario: Dollar Strength and Easing Tensions Prevail
10% ProbabilityThe Trader's Dilemma: Waiting for Confirmation
The current technical setup for XAUUSD, characterized by conflicting signals across different timeframes and significant external influences, presents a classic 'watch zone' scenario. The 1-hour chart leans bearish, with an RSI of 32.16 and negative MACD momentum, while the 4-hour chart hints at bullish potential despite a neutral RSI. The daily chart remains indecisive. This divergence means that entering a trade without further confirmation could be speculative rather than strategic. A daily close above the 1-hour resistance at $4,796.57 would be a significant development, potentially signaling a shift in momentum and opening the door for a move towards higher targets.
Conversely, a failure to hold the $4,759.75 support level on the 1-hour chart could lead to a rapid decline, targeting $4,740.44. Traders should be particularly mindful of the correlation with the DXY, which is currently at 98.11 and showing strength. Any significant moves in the dollar index will likely have a direct impact on gold. The key for traders now is patience and discipline. Waiting for a clear breakout or breakdown, confirmed by volume and other indicators, will be crucial to avoid getting caught in the current choppy market conditions. The market is offering signals, but clarity is still needed for a high-probability trade setup.
Frequently Asked Questions: XAUUSD Analysis
What happens if XAUUSD breaks below $4,759.75 support?
A break below the $4,759.75 support level on the 1-hour chart could trigger further downside, potentially targeting $4,740.44. This would align with bearish signals on the short-term charts and suggest a continuation of the current downtrend.
Should I buy XAUUSD at current levels near $4,754 given the mixed signals?
Buying at current levels near $4,754 carries significant risk due to conflicting signals across timeframes and the strengthening DXY. A more prudent approach would be to wait for a decisive break above $4,796.57 resistance or a confirmed hold of $4,759.75 support, ideally with confirmation from other indicators.
Is the RSI at 32.16 on the 1H chart a sell signal for XAUUSD?
An RSI of 32.16 on the 1-hour chart indicates oversold conditions, which can sometimes precede a bounce. However, it also aligns with the overall bearish momentum on that timeframe. Confirmation from other indicators and price action is needed rather than relying solely on the RSI reading.
How will the situation in the Strait of Hormuz affect XAUUSD this week?
Escalating tensions in the Strait of Hormuz could increase geopolitical risk premiums, potentially driving demand for gold as a safe-haven asset. However, this effect may be counteracted by a strong US Dollar. Traders should watch for significant oil price movements as an indicator of the market's reaction.
| Indicator | Value | Signal | Interpretation |
|---|---|---|---|
| RSI (14) | 32.16 | Bearish | Oversold on 1H, Neutral on 1D |
| MACD Histogram | -15.20 | Bearish | Negative momentum on 1H/4H |
| Stochastic | K:22.39, D:57.82 | Bearish | Oversold on 1H, falling %K |
| ADX | 28.85 | Strong Trend | Confirms downtrend on 1H |
Track markets in real-time
AI-powered analysis, technical indicators and real-time price data.
Join Our Telegram Channel
Breaking market news, AI analysis and trading signals instantly.
Join Channel