

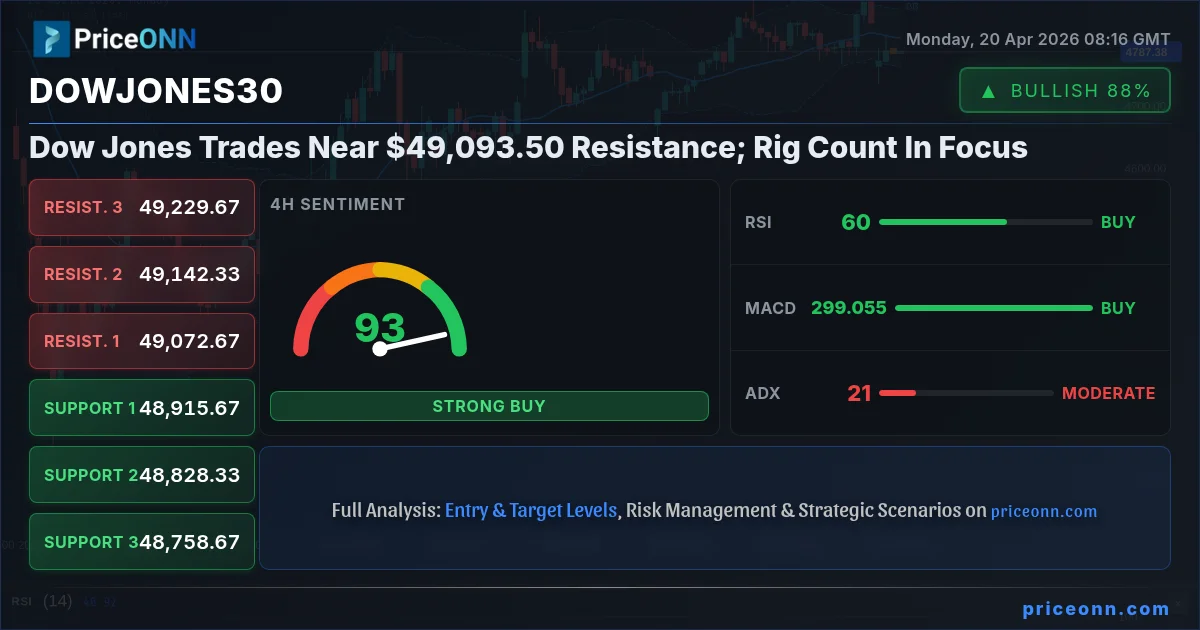
The Dow Jones Industrial Average (DJIA) is currently navigating a critical juncture, trading near the $49,093.50 resistance level. This pivotal moment arrives amidst a complex interplay of technical signals and evolving macroeconomic factors, particularly concerning the energy sector's influence on broader market sentiment. While the index shows resilience, the path forward hinges on its ability to decisively break through key resistance or risk a pullback towards established support zones. Understanding the nuances of its current technical posture and the external forces at play is crucial for traders aiming to capitalize on potential market movements.
- The Dow Jones30 is currently trading at $49,093.50, testing a significant resistance level.
- RSI at 52.03 on the 1H chart suggests neutral momentum, while the 1D chart shows RSI at 64.44, indicating a bullish trend in neutral territory.
- Key resistance is observed at $49,147, with crucial support found at $49,070 on the 1-hour timeframe.
- The broader market sentiment, influenced by DXY's current level of 98 and WTI Crude Oil's surge to $96.65, presents a complex backdrop for the index.
The Dow Jones Industrial Average (DJIA) is currently navigating a critical juncture, trading near the $49,093.50 resistance level. This pivotal moment arrives amidst a complex interplay of technical signals and evolving macroeconomic factors, particularly concerning the energy sector's influence on broader market sentiment. While the index shows resilience, the path forward hinges on its ability to decisively break through key resistance or risk a pullback towards established support zones. Understanding the nuances of its current technical posture and the external forces at play is crucial for traders aiming to capitalize on potential market movements.
The Dow Jones Industrial Average (DJIA) is currently navigating a critical juncture, trading near the $49,093.50 resistance level. This pivotal moment arrives amidst a complex interplay of technical signals and evolving macroeconomic factors, particularly concerning the energy sector's influence on broader market sentiment. While the index shows resilience, the path forward hinges on its ability to decisively break through key resistance or risk a pullback towards established support zones. Understanding the nuances of its current technical posture and the external forces at play is crucial for traders aiming to capitalize on potential market movements.
Navigating Resistance: The Dow Jones30's Current Technical Stance
1-Hour Chart Dynamics: A Cautious Approach
On the 1-hour timeframe, the Dow Jones30 is hovering around the $49,093.50 mark, presenting a clear test of the $49,147 resistance. The ADX at 22.65 indicates a moderately strong trend, but the stochastic oscillator, with K at 62.88 and D at 35.82, flashing a bullish signal (%K > %D), suggests upward momentum might be building. However, the RSI reading of 52.03 keeps the index in neutral territory, signaling neither strong buying nor selling pressure. This mixed picture on the hourly chart suggests that while there's underlying strength, the immediate path higher isn't guaranteed. The MACD, while showing negative momentum and the MACD line below the signal line, indicates that the recent upward push might be losing steam, demanding vigilance from short-term traders.
The presence of support levels at $49,070, $49,027, and $48,993 provides a buffer against any immediate downside. A break below $49,070 could signal a short-term reversal, inviting sellers to test lower grounds. Conversely, a sustained push above $49,147, ideally with increasing volume, would confirm bullish intent and potentially open the door for further upside. The current setup on the 1-hour chart is one of careful observation, where short-term traders would be looking for clear confirmation before committing to a direction. The market is in a delicate balance, and any significant news catalyst could tip the scales.
4-Hour Chart: Underlying Strength and Divergence
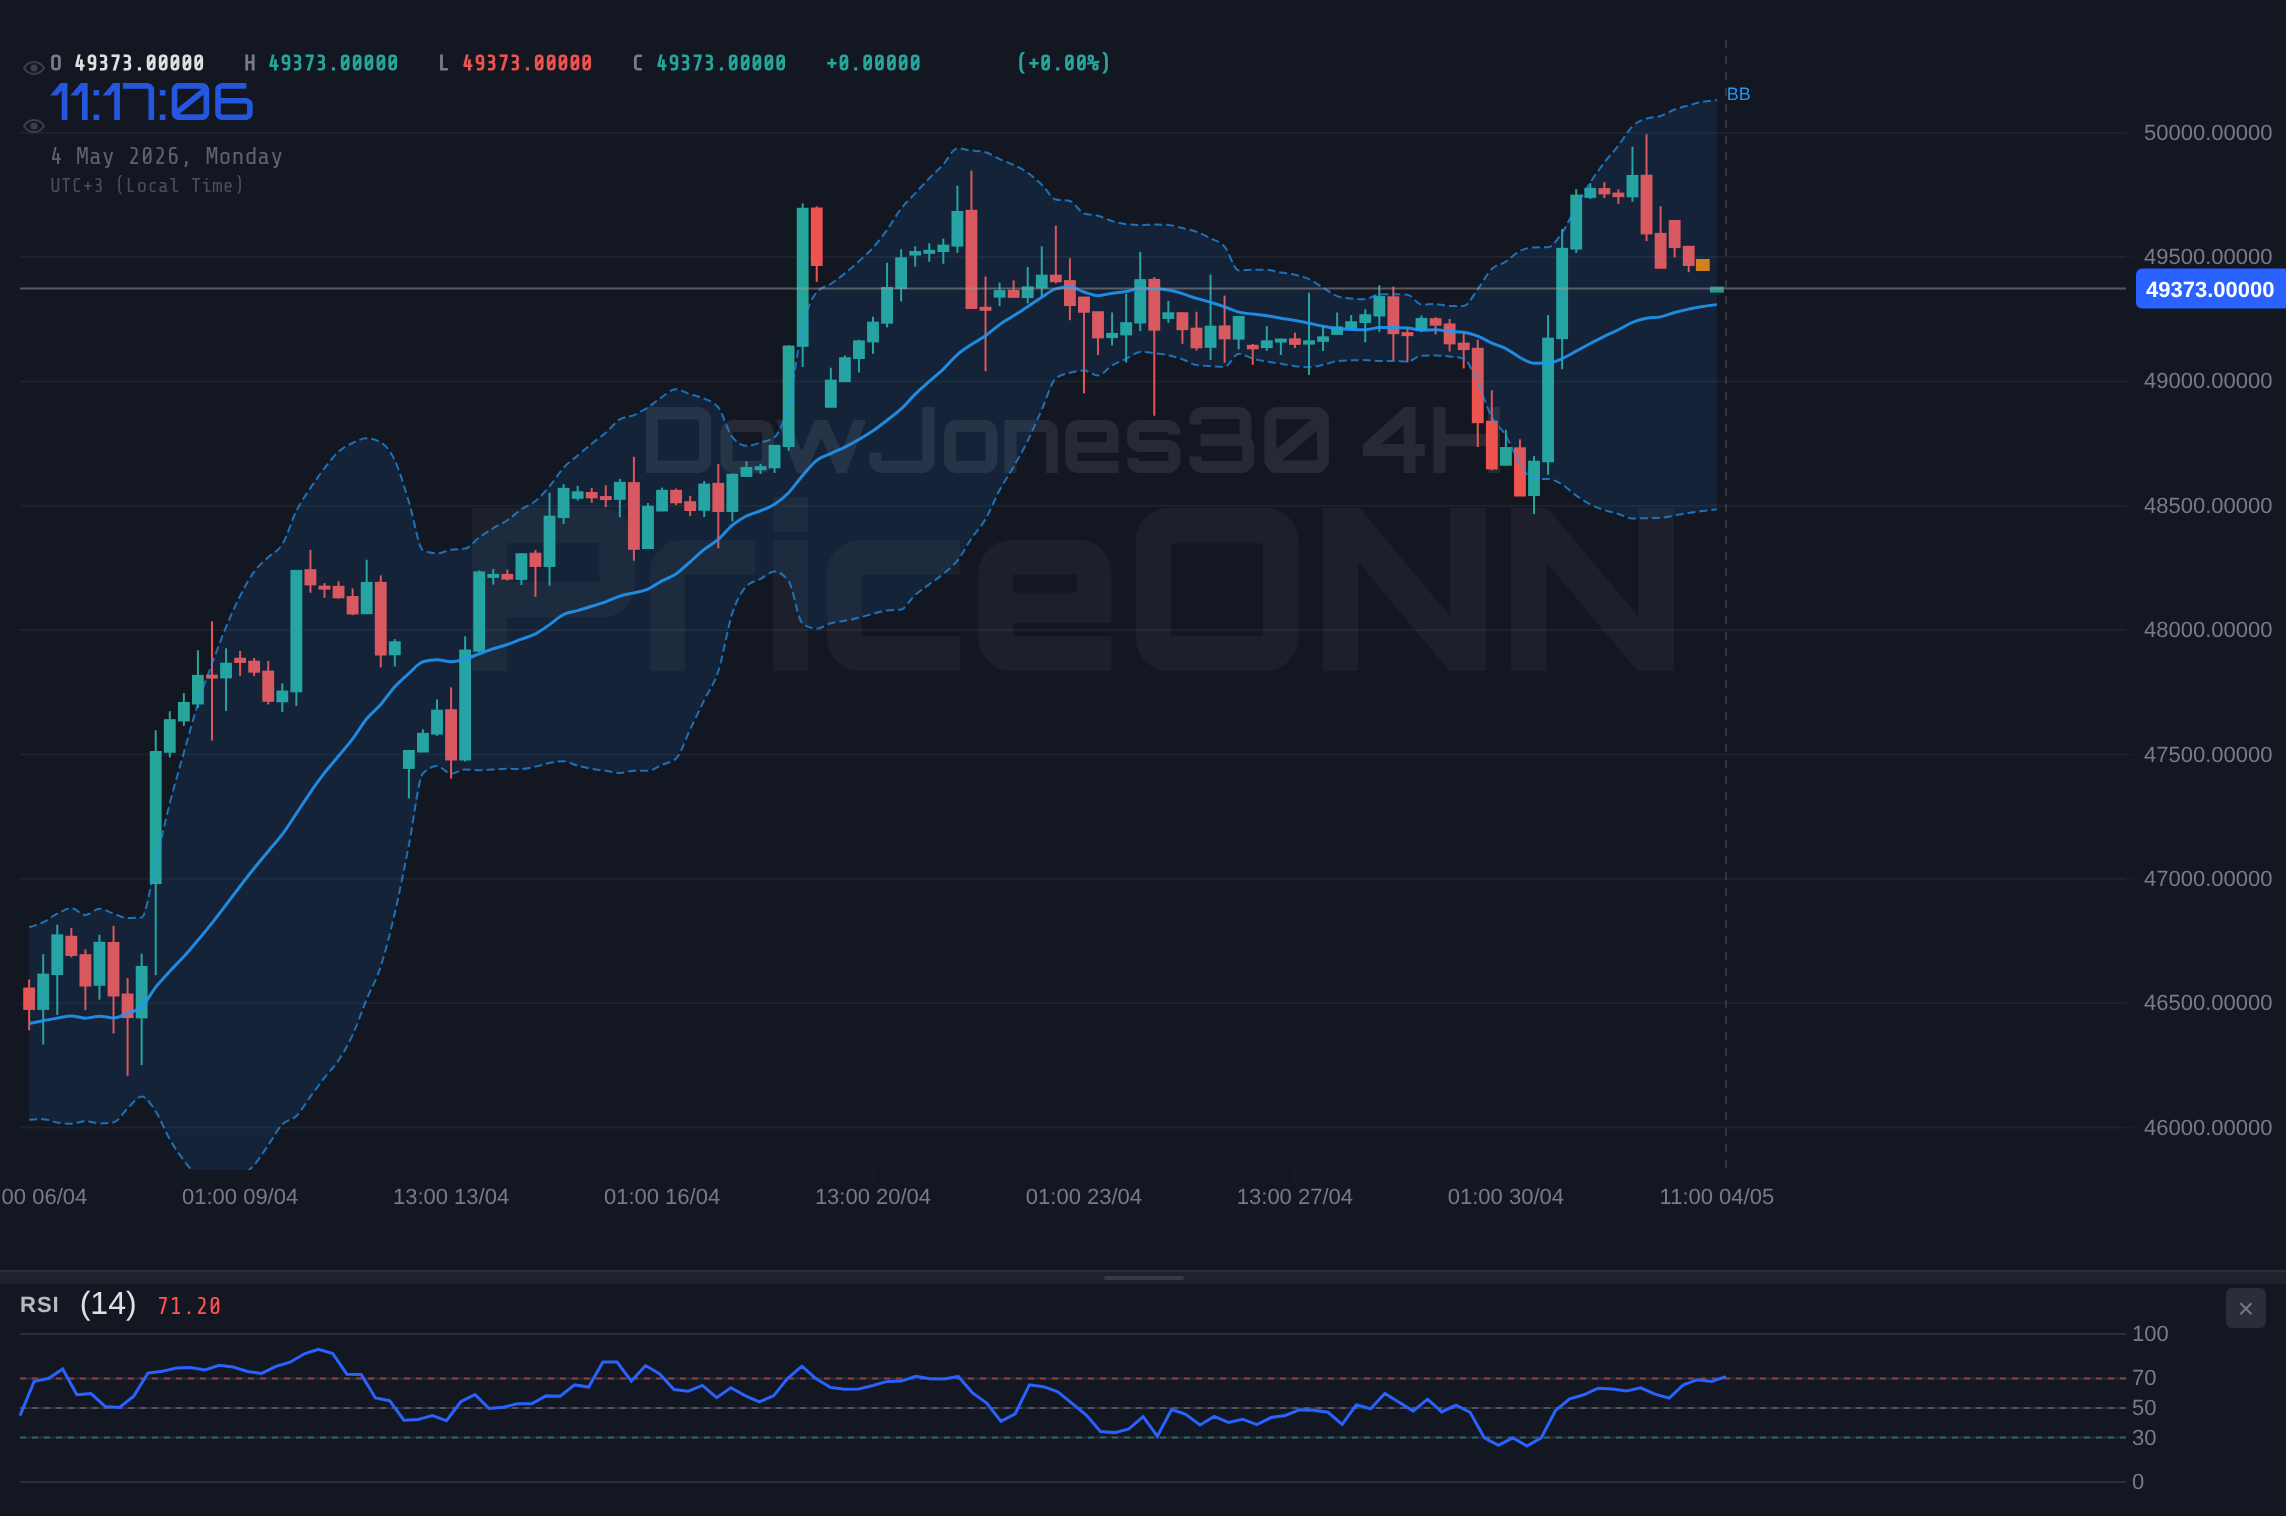
Shifting to the 4-hour chart, the Dow Jones30 exhibits a stronger bullish trend (Power: 86%). The price is trading above the middle Bollinger Band, indicating upward momentum. The RSI at 60.27, while still in neutral territory, shows a clear upward tendency. This contrasts slightly with the 1-hour chart's more cautious stance. The stochastic oscillator, however, presents a potential divergence signal: K at 60.68 and D at 86.78, showing a bearish signal (%K
The ADX at 21.49 reinforces the idea of a moderately strong trend, but combined with the stochastic's bearish signal, it paints a picture of a trend that might be facing headwinds. The support levels at $48,915.67, $48,828.33, and $48,758.67 are significant for this timeframe. A sustained move below these levels would invalidate the current bullish structure on the 4-hour chart and could trigger a more substantial correction. The resistance levels at $49,072.67, $49,142.33, and $49,229.67 remain the immediate hurdles for the bulls. The fact that the index is testing resistance while showing some conflicting signals on the 4-hour chart highlights the importance of the price action around $49,093.50.
Daily Chart Perspective: A Resilient Trend
On the daily chart, the Dow Jones30 displays a predominantly neutral trend (Power: 50%), yet it shows underlying bullish characteristics. The RSI at 64.44 is firmly in the upper neutral zone, suggesting room for further upside before becoming overbought. The MACD indicator is positive, with the MACD line above the signal line, reinforcing a bullish momentum. The Bollinger Bands show the price trading above the middle band, aligning with a generally positive outlook. The stochastic oscillator, with K at 90.02 and D at 94.13, is in the overbought territory, indicating a potential for a short-term pullback or consolidation, a signal that aligns with the caution observed on shorter timeframes.
The ADX at 25.08 suggests a strong upward trend, which, when viewed against the overbought stochastic, creates a picture of a trend that is strong but potentially due for a pause. The daily support levels at $48,818, $48,168, and $47,719 are substantial and would require significant selling pressure to breach. The daily resistance levels at $49,917, $50,366, and $51,016 represent the longer-term targets for the bulls. The resilience shown on the daily chart, despite short-term technical divergences, suggests that the overall market sentiment remains supportive of equities, provided no major negative catalysts emerge. This long-term view provides a crucial context for interpreting the intraday price action.
Macroeconomic Currents: Energy Prices and Dollar Influence
The Impact of Oil Prices on Market Sentiment
The recent surge in WTI Crude Oil prices, reaching $96.65, and Brent Crude Oil at $96.65, cannot be ignored. This significant upward movement, particularly the 4.8% gain in WTI, injects an inflationary element into the market. Higher oil prices typically correlate with increased inflation expectations, which can influence central bank policy and investor risk appetite. On the 1-hour WTI chart, the trend is neutral but showing bullish signs, while the 4-hour shows a bearish trend and the daily a neutral trend with bearish signals. This mixed technical picture for oil suggests volatility, but the immediate upward price action is notable.
The correlation between oil prices and broader market indices like the Dow Jones30 is complex. On one hand, rising oil prices can boost energy stocks, contributing to index gains. On the other hand, they can signal rising inflation, potentially prompting tighter monetary policy which could dampen equity markets. The current situation, where oil is showing significant upward momentum on the day, could be interpreted as a signal of underlying geopolitical tensions or strong demand, both of which have implications for the global economy and, by extension, the Dow Jones30. Traders are watching closely to see if this energy price rally translates into broader inflationary concerns or simply reflects supply-side dynamics.
The Dollar Index (DXY): A Counterbalance
The US Dollar Index (DXY) is currently trading at 98, showing a slight increase of 0.11% on the day. On the 1-hour chart, the DXY shows a downtrend with bullish signals, while the 4-hour shows a neutral trend with bullish signals, and the daily chart indicates a neutral trend with bearish signals. This mixed technical picture for the dollar index mirrors the complexity seen across other markets. Historically, a strengthening dollar (rising DXY) tends to put pressure on commodities like gold and can weigh on US export-oriented companies, indirectly affecting the Dow Jones30. Conversely, a weakening dollar can support equity markets by making US exports cheaper and potentially signaling a shift towards riskier assets.
With the DXY at 98, the current environment presents a complex dynamic. A rising DXY could theoretically pressure the Dow Jones30, especially if it signals a flight to safety or anticipation of Fed tightening. However, the mixed technical signals on the DXY across different timeframes suggest that its influence might be muted or temporary. The fact that the Dow Jones30 is testing resistance while the dollar is also showing mixed signals indicates that other factors, such as corporate earnings, sector-specific news, or geopolitical developments, might be playing a more dominant role in price discovery for the index in the short term. The interplay between oil prices and the dollar's strength will be a key factor to monitor.
Trade Scenarios and Risk Management
Given the current technical setup and macroeconomic backdrop, several scenarios are plausible for the Dow Jones30. The index is at a critical resistance level ($49,093.50), with conflicting signals across different timeframes and external factors like oil prices and the dollar index adding layers of complexity. Prudent risk management and a clear understanding of potential outcomes are paramount for traders navigating this environment.
Bearish Scenario: Resistance Holds Firm
65% ProbabilityNeutral Scenario: Consolidation Around Resistance
25% ProbabilityBullish Scenario: Breakout Confirmation
10% ProbabilityThe bearish scenario appears most probable given the confluence of resistance levels, mixed short-term signals, and potential overbought conditions indicated by the stochastic on the 4-hour and daily charts. A failure to decisively break higher could lead to a retracement, with the $49,070 level serving as the immediate line in the sand. Traders should pay close attention to volume and price action around this key psychological and technical level. The potential for consolidation also remains high, especially if no new significant catalysts emerge.
Key Levels and Technical Outlook Summary
| Indicator | Value | Signal | Interpretation |
|---|---|---|---|
| RSI (14) | 52.03 | Neutral | 1H: Neutral, 4H: Bullish, 1D: Bullish |
| MACD Histogram | - | Bearish | 1H: Negative Momentum |
| Stochastic %K/%D | 62.88 / 35.82 | Bullish | 1H: Bullish Signal |
| ADX | 22.65 | Moderate Trend | 1H: Moderate Up Trend |
| Bollinger Bands | Middle Band | Watch | Price above middle band on 1H/4H, below on 1D |
The Dow Jones30's current position near $49,093.50 presents a classic technical challenge. While the daily chart still offers a degree of bullish underpinning, the confluence of resistance levels and conflicting signals on shorter timeframes, particularly the stochastic divergence and the MACD's negative momentum on the 1-hour chart, warrants a cautious approach. The elevated oil prices add another layer of complexity, potentially fueling inflation fears that could impact Fed policy expectations and, consequently, equity market sentiment. Traders looking for clear direction may need to wait for a decisive break above the $49,147 resistance or a confirmed move back towards the $49,070 support.
Frequently Asked Questions: DowJones30 Analysis
What happens if the Dow Jones30 fails to break above the $49,147 resistance level?
If the Dow Jones30 fails to break decisively above the $49,147 resistance, it could lead to a pullback. The immediate support to watch would be $49,070 on the 1-hour chart, followed by $49,027. A sustained move below these levels would likely invalidate the bullish short-term momentum.
Should I trade the Dow Jones30 at current levels of $49,093.50, given the mixed signals?
Trading at current levels of $49,093.50 requires careful risk management due to mixed signals. A high-probability setup would involve waiting for a clear breakout above $49,147 with confirmation, or a confirmed bounce from support around $49,070. The bearish scenario currently holds a 65% probability, suggesting caution is advised.
Is the RSI at 52.03 on the 1-hour chart a concern for the Dow Jones30 trend?
An RSI of 52.03 on the 1-hour chart is within the neutral zone, indicating neither strong buying nor selling pressure. While not an immediate concern, it suggests the upward momentum seen on shorter timeframes might be stabilizing, aligning with the resistance test and the potential for consolidation or a short-term pullback.
How will the rising oil prices affect the Dow Jones30's movement this week?
Rising oil prices, with WTI at $96.65, can create inflationary pressures. This might lead to concerns about future central bank policy, potentially impacting risk appetite for indices like the Dow Jones30. While energy stocks may benefit, broader market sentiment could turn cautious if inflation fears escalate significantly.
Track markets in real-time
AI-powered analysis, technical indicators and real-time price data.
Join Our Telegram Channel
Breaking market news, AI analysis and trading signals instantly.
Join Channel