

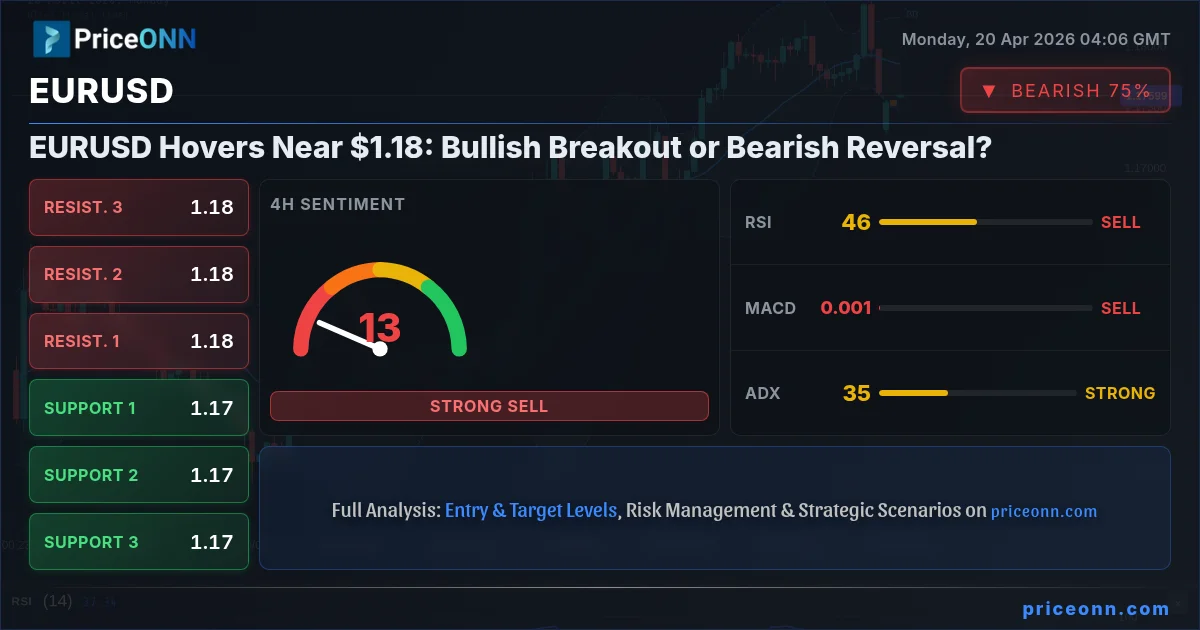
The EUR/USD currency pair is currently locked in a tense battleground, hovering precariously near the $1.18 mark. This critical juncture, where the bulls and bears are fiercely contesting control, presents a fascinating case study for traders. With the pair stalled just shy of the significant $1.1824 resistance level, as noted by recent market commentary, the immediate outlook has shifted towards neutrality, prompting a deep dive into what the charts and data are truly telling us. Is this a pause before a decisive upward surge towards $1.18206 and beyond, or are we witnessing the prelude to a bearish retreat back towards the $1.17317 support zone? Understanding this dynamic is crucial for navigating the current choppy waters.
- EUR/USD shows mixed signals with RSI at 60.08 on the daily chart, indicating neutral momentum but with a slight upward bias.
- Critical support for EUR/USD is identified at $1.17317, while resistance looms at $1.18206, a level that has recently capped gains.
- The US Dollar Index (DXY) at 98.01 is showing a strengthening trend on the 1H and 4H charts, which typically pressures EUR/USD lower.
- ADX readings on multiple timeframes suggest a strong trend is developing, but the direction is conflicting across different charts, adding to the current indecision.
The Bull Case: A Foundation Built on Resilience
Testing the Upper Echelon: EURUSD's Push Towards $1.18206
On the bullish side of the ledger, there are compelling reasons to believe that EUR/USD might be poised for further gains. The daily chart presents a picture of underlying strength, with the RSI at 60.08 suggesting that while not yet overbought, the momentum is leaning towards the upside. This is further supported by the MACD, which is trading above its signal line, indicating positive momentum building. The price action on the daily chart has also been respecting the middle Bollinger Band, implying a potential continuation of the upward trend. Furthermore, the Stochastic indicator on the daily chart, while showing %K at 74.55 and %D at 89.81, is in the upper range, signaling that any pullback might be short-lived before another push higher, especially if it crosses back above the signal line.
The 4-hour chart, despite showing some conflicting signals like negative MACD momentum, still holds a strong ADX of 34.84, indicating a robust trend is in play. While the Bollinger Bands are currently below the middle band, suggesting a potential breakout or oversold condition, the overall trend strength is undeniable. The daily chart's overall signal of 'BUY' (Al: 7, Sat: 1, Nötr: 0) further bolsters the bullish argument. Traders looking for confirmation might watch for a decisive break and hold above the $1.18206 resistance level, a point that has recently acted as a ceiling. If this level is cleared with conviction, and ideally with increased volume, the next logical targets could be the higher resistance levels of $1.18789 and $1.19095. The strength seen in the S&P 500, trading up 0.74% at 6572.87, also suggests a risk-on environment which can be supportive of the Euro.
The Dollar's Role: A Nuance in the Bullish Narrative
However, a purely bullish outlook for EUR/USD must contend with the strength of the US Dollar Index (DXY). The DXY is showing a mixed picture across timeframes, with a neutral but slightly bullish trend on the 1-hour and 4-hour charts (overall signal 'BUY'). While the daily chart for DXY indicates a bearish trend (overall signal 'SELL'), its current levels around 98.01 suggest it's not entirely out of the woods for the dollar. A strengthening dollar, often seen when DXY is in an uptrend, typically exerts downward pressure on EUR/USD. The fact that the DXY is hovering near resistance levels on the 1H and 4H charts could mean it's due for a pullback, which would, in turn, support EUR/USD. Conversely, if the DXY breaks through its immediate resistance, it could stifle any bullish aspirations for the Euro.
The correlation between DXY and EUR/USD is usually inverse. If DXY manages to push higher from its current levels, perhaps driven by positive US economic data, it would likely drag EUR/USD down. On the 1-hour chart, while RSI is at 61.11, Stochastic is showing a dip, and MACD is positive, suggesting a battle. The 4-hour chart shows RSI at 51.91, also neutral-to-upward, but with a strong ADX of 34.66 indicating a powerful trend, albeit one that might be consolidating before a directional move. The key here is to monitor how the DXY behaves around its immediate resistance levels. A sustained break above 98.09 on the 1H chart could signal dollar strength, while a failure to hold above 97.93 might offer some breathing room for EUR/USD bulls.
The Bear Case: Dollar Strength and Technical Headwinds
Battling Resistance: The $1.18206 Hurdle
Conversely, the bearish argument for EUR/USD hinges on the pair's inability to decisively break through key resistance levels and the potential for dollar strength. The $1.18206 level on the daily chart is a significant hurdle. Recent news highlights that EUR/USD's advance stalled near this critical Fibonacci retracement level, shifting the immediate outlook to neutral, with some analysts even suggesting a retreat to $1.1662. The 4-hour chart shows a clear bearish signal from Stochastic (%K=21.2, %D=40.06) and negative MACD momentum. While the ADX is strong at 34.84, indicating a trend, the direction could be downwards if the bulls fail to push through resistance.
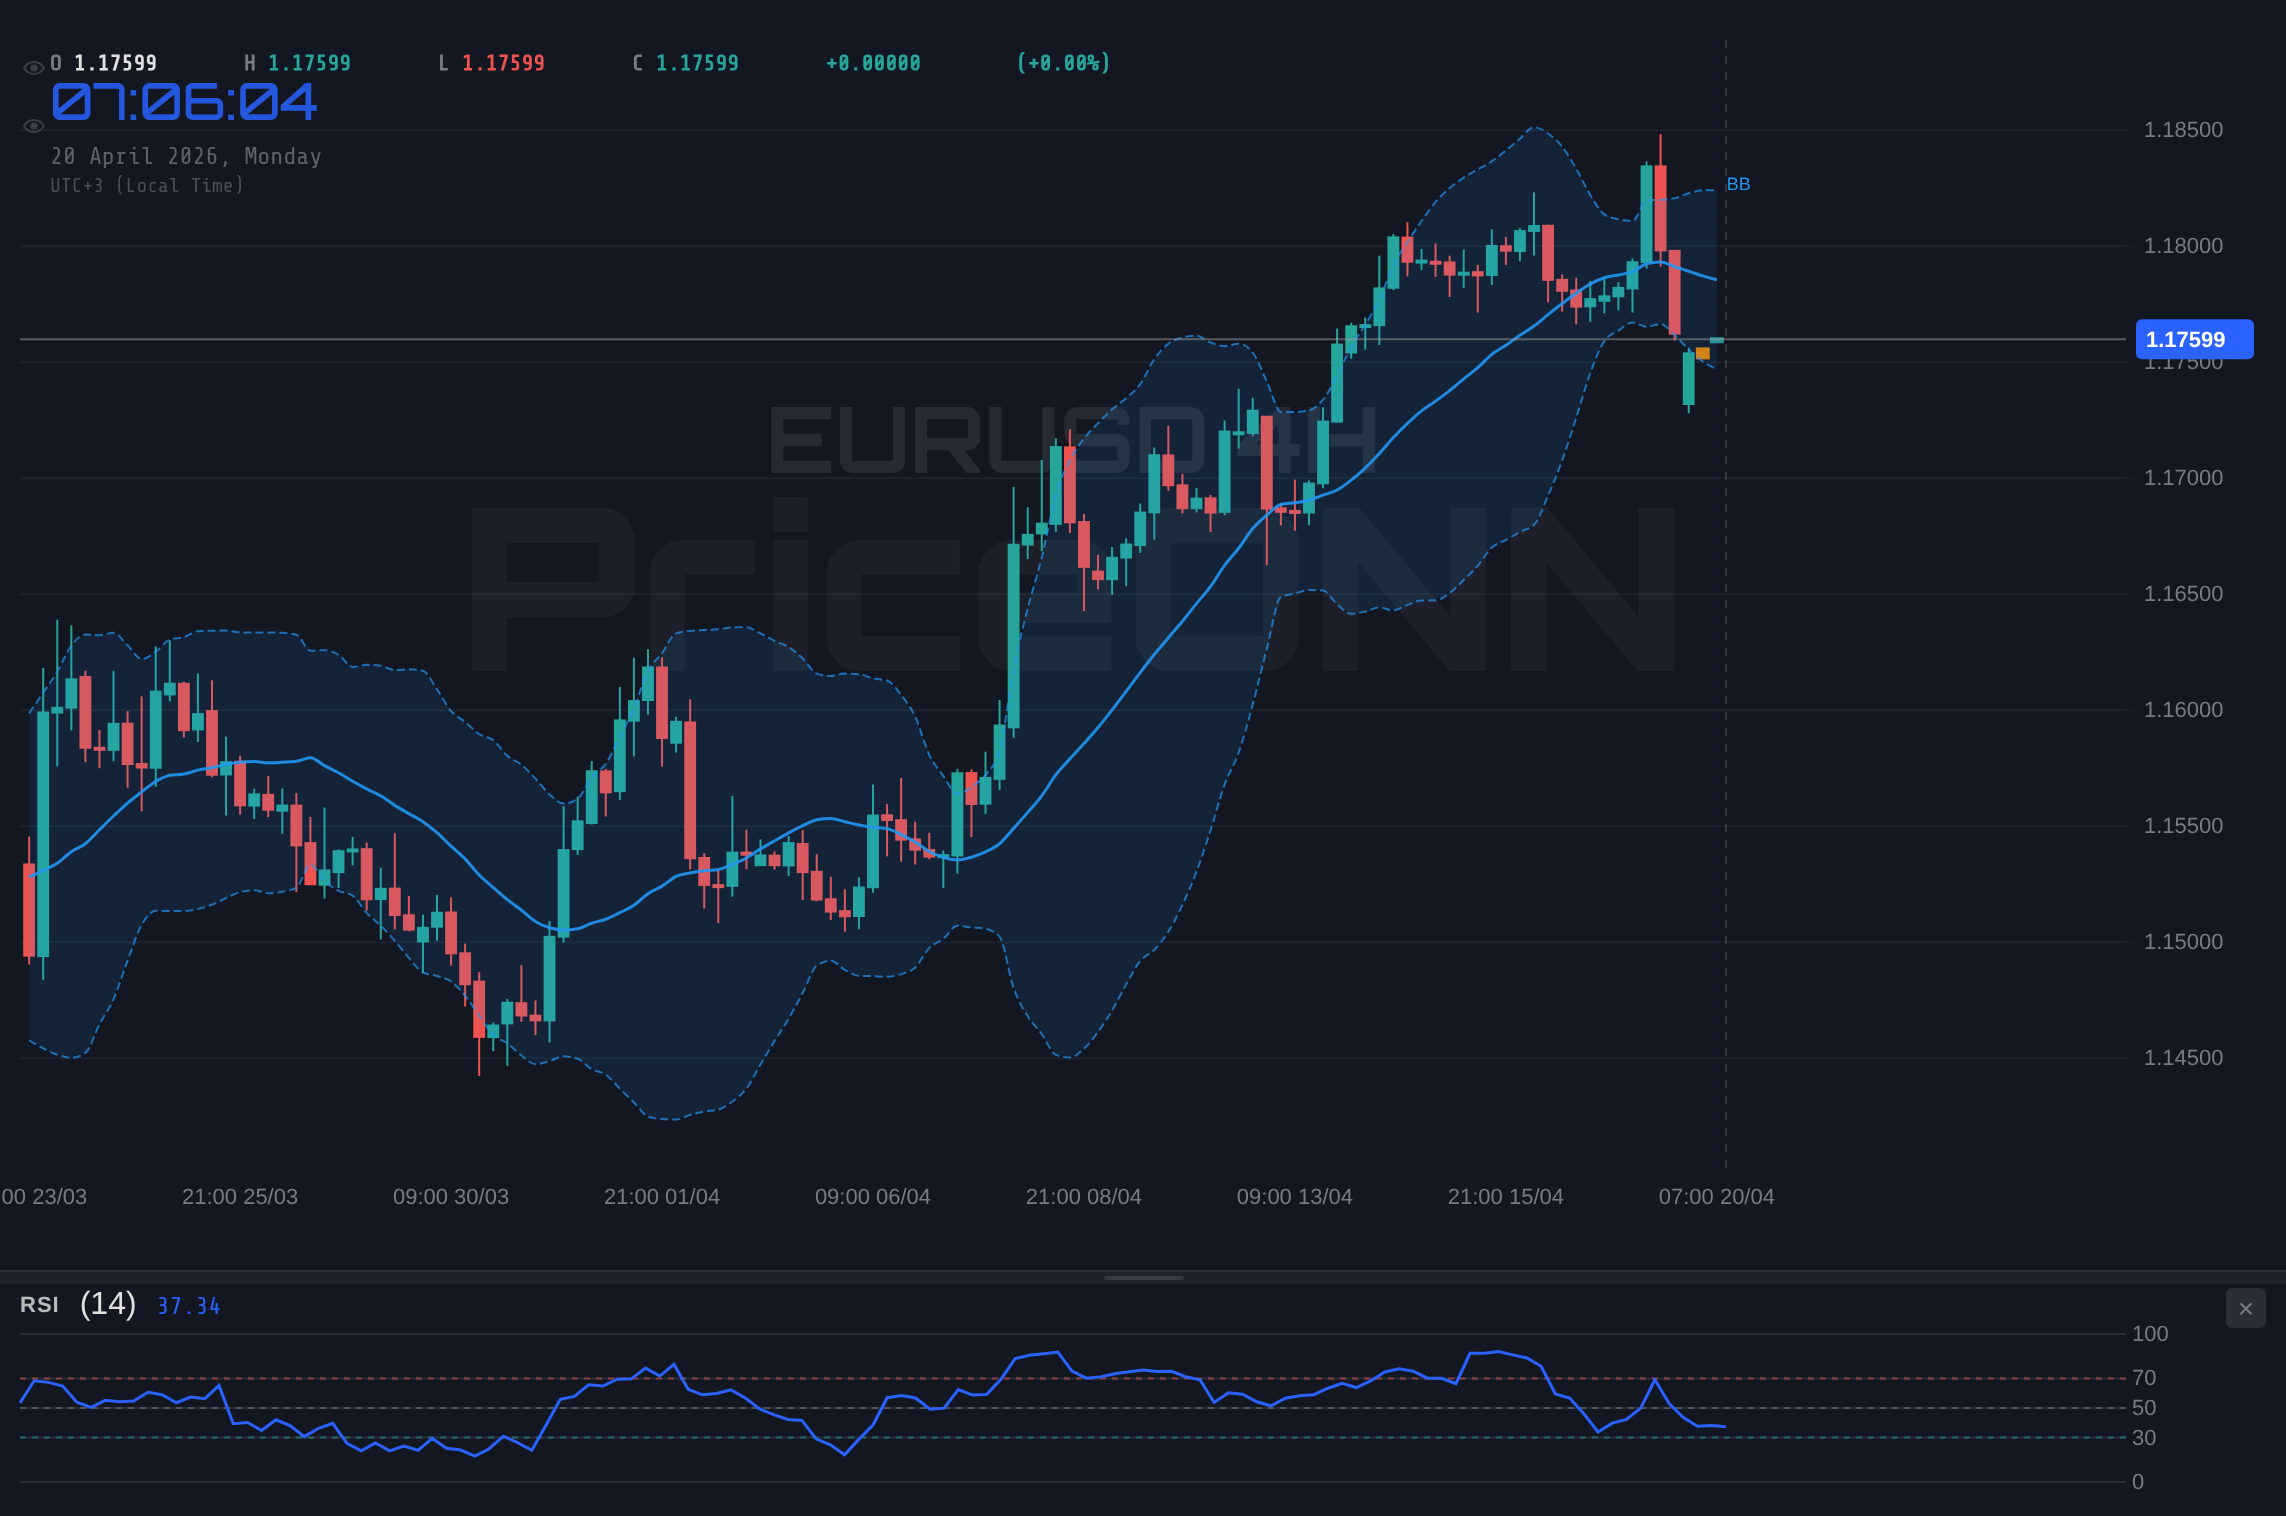
The 1-hour chart presents a more bearish picture with a 'SELL' signal (Al: 2, Sat: 6, Nötr: 0). The RSI at 43.55 is in the neutral zone but trending downwards, and the MACD is below its signal line. Bollinger Bands on the 1-hour and 4-hour charts are also below the middle band, suggesting downside pressure or a potential for a breakdown. If EUR/USD fails to hold the $1.17531 support on the 1H chart, the next logical targets would be the lower support levels at $1.17499 and $1.1746. A break below the $1.17317 daily support level would significantly strengthen the bearish case, potentially opening the door for a move towards $1.17011 and even $1.16428.
Economic Undercurrents: Inflation and Fed Expectations
Fundamental factors also play a crucial role. While specific economic calendar data points for today (Monday, April 20th, 2026) are not detailed as 'Actual' values, the upcoming releases for the USD are closely watched. The fact that the previous figures for some USD events were positive (e.g., Previous: 0.6, Forecast: 1.4) suggests underlying economic strength that could support the dollar. If upcoming US Retail Sales data, for instance, shows consumer resilience amidst rising inflation, it could bolster the Federal Reserve's case for a hawkish stance, thereby strengthening the dollar and pressuring EUR/USD.
The market sentiment, as reflected in the S&P 500's current rise, might suggest a risk-on mood. However, this can be a double-edged sword. If this risk appetite falters, leading to a sell-off in equities (the Nasdaq 100 is already down -0.61% at 26517.9), it could trigger a flight to safety, benefiting the US dollar and weakening EUR/USD. The geopolitical context, such as tensions around the Strait of Hormuz, can also inject volatility into oil prices and indirectly affect global risk sentiment, potentially influencing currency markets. While oil prices have seen some volatility, the narrative around the Strait of Hormuz reopening might be a temporary calm, with underlying geopolitical risks still present.
The Technical Tightrope: Conflicting Signals and Key Levels
Navigating the Indicators: A Tale of Two Timeframes
The technical picture for EUR/USD is far from clear-cut, presenting a complex puzzle for traders. On the 1-hour chart, the overall signal leans towards 'SELL' with a bearish RSI trend and negative MACD momentum. However, the Stochastic indicator is showing a bullish crossover (%K > %D), and the ADX at 19.3 indicates a weak trend, suggesting consolidation rather than a strong directional move. This timeframe paints a picture of short-term indecision, with immediate support at $1.17531 and resistance at $1.17602.
The 4-hour chart, while showing negative MACD momentum and a bearish Stochastic signal, also presents a strong ADX of 34.84, pointing towards a defined trend. The RSI is neutral at 45.76, trending downwards. The Bollinger Bands are below the middle band, which can signal oversold conditions or an impending breakdown. The overall signal here is also 'SELL'. This timeframe suggests that if the price fails to break above the $1.17871 resistance, a move lower towards $1.17485 is plausible.
In stark contrast, the daily chart offers a more bullish perspective. The overall signal is 'BUY' (Al: 7, Sat: 1, Nötr: 0). The RSI is at 60.08, showing upward momentum, and the MACD is positive and above its signal line. The Bollinger Bands are above the middle band, indicating an uptrend. The Stochastic is in the upper range, albeit with %K below %D, which could suggest a pullback or consolidation before the next leg up. The ADX at 28.42 confirms a strong trend. This divergence across timeframes highlights the current market tension: short-term indicators suggest caution or a potential downturn, while the longer-term daily view hints at underlying strength.
The Verdict: Where the Smart Money Might Be Looking
Given the conflicting signals across different timeframes, the most prudent approach is to await clearer confirmation. The 4-hour ADX of 34.84 and the daily ADX of 28.42 suggest that a trend is indeed developing, but the conflicting signals from RSI, MACD, and Stochastic across these charts mean the direction is not yet firmly established. The immediate price action around the $1.1760 area is critical. A failure to hold above this level, coupled with a breakdown below the $1.17317 daily support, would strongly favor the bearish scenario.
Conversely, a decisive push and sustained hold above the $1.18206 resistance, particularly if accompanied by a weakening DXY and positive market sentiment, would validate the bullish case. The conflicting Stochastic signals across timeframes are particularly noteworthy. On the 1H and 4H, they suggest a potential move higher from oversold/oversold-like conditions, while on the daily, it's showing a potential downturn from overbought-like territory. This ambiguity underscores the need for patience. Traders should look for confluence: a break of $1.18206 with positive daily indicators and a softening DXY would be a strong bullish signal. Conversely, a close below $1.17317 with bearish daily indicators and dollar strength would confirm the bears' advantage.
Trade Scenarios and Probabilities
Bearish Scenario: Retreat to Support
65% ProbabilityNeutral Scenario: Consolidation and Waiting Game
25% ProbabilityBullish Scenario: Breaking Resistance
10% ProbabilityFrequently Asked Questions: EURUSD Analysis
What happens if EURUSD breaks below the $1.17317 support level?
A break below the daily support at $1.17317 would invalidate the short-term bullish outlook and strongly favor the bearish scenario. This could lead to a test of lower levels, potentially targeting $1.17011 and even $1.16428 as the dollar potentially strengthens.
Should I buy EURUSD at current levels near $1.18 given the mixed RSI signals?
Buying at current levels near $1.18 carries risk due to the conflicting signals and resistance at $1.18206. A more prudent approach would be to wait for a clear break above $1.18206 with daily confirmation, or a confirmed bounce from the $1.17317 support level, aligning with a clear trend signal.
Is the RSI at 60.08 on the daily chart a buy signal for EURUSD?
An RSI of 60.08 on the daily chart is in the neutral-to-bullish zone, indicating upward momentum but not yet overbought conditions. While it supports a bullish outlook, it's not a standalone buy signal. Confirmation from other indicators like MACD and price action breaking key resistance levels is crucial.
How will upcoming US economic data impact EURUSD trading this week?
Upcoming US economic data, particularly retail sales and inflation figures, could significantly influence the DXY and thus EUR/USD. Stronger-than-expected data might bolster the dollar, pushing EUR/USD lower towards $1.17317, while weaker data could weaken the dollar, potentially supporting a move towards $1.18206.
Track markets in real-time
AI-powered analysis, technical indicators and real-time price data.
Join Our Telegram Channel
Breaking market news, AI analysis and trading signals instantly.
Join Channel