

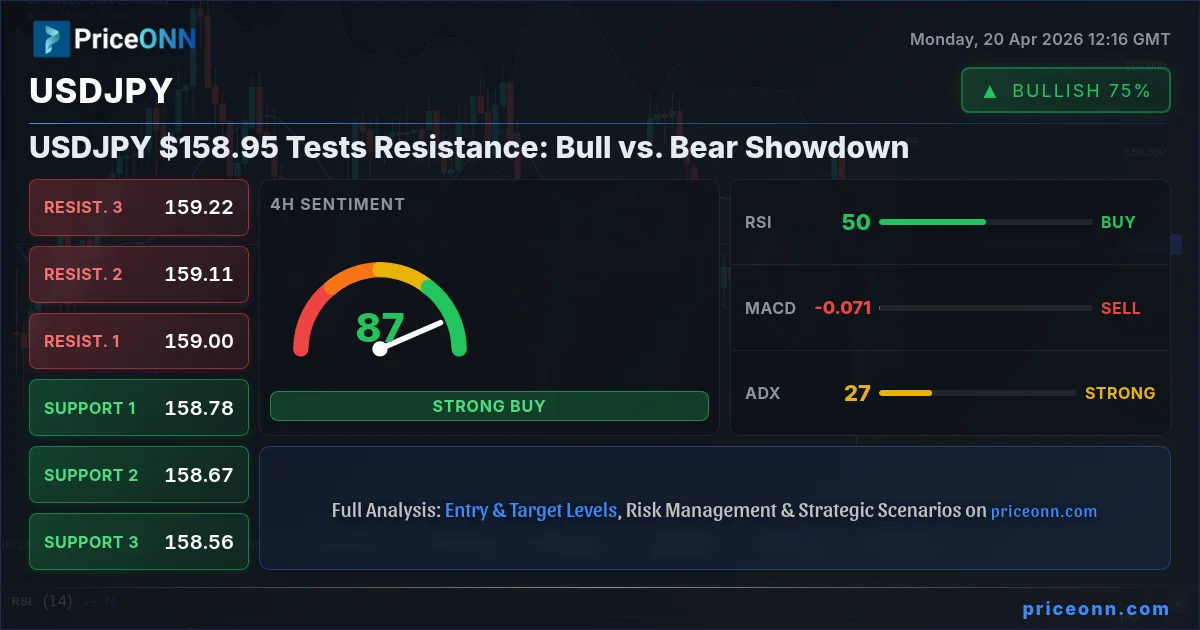
Is the dollar's recent rally sustainable, or are we on the cusp of a significant reversal for USDJPY? The pair is currently hovering around the critical $158.95 mark, a level that has repeatedly tested the resolve of both bulls and bears. Having climbed steadily, USDJPY now faces a formidable resistance zone, and the battle unfolding here will likely dictate the near-term direction for this major forex pair. The tension is palpable, with technical indicators flashing mixed signals and a complex web of geopolitical and macroeconomic factors vying for market attention. This is precisely where a deep dive into the nuances of the current market environment becomes crucial for any trader looking to navigate these choppy waters.
- USDJPY is currently trading at $158.95, testing a key resistance zone.
- The Dollar Index (DXY) is at 97.99, showing mixed signals on different timeframes, potentially limiting USD strength.
- On the 1-day chart, RSI is 51.5, suggesting a neutral-to-slightly-bullish sentiment, while ADX at 17.53 indicates a weak trend.
- Geopolitical easing and rising oil prices create conflicting narratives for USDJPY's direction.
The Bulls' Case: Dollar Strength Persists Amid Risk Appetite
The argument for continued dollar strength in USDJPY is built on several pillars, primarily revolving around the perceived resilience of the US economy and a shifting global risk sentiment. While geopolitical tensions in the Middle East have eased somewhat, providing a brief respite, the underlying strength of the US dollar remains a persistent theme. The Dollar Index (DXY), currently trading around 97.99, has shown periods of strength that directly correlate with USDJPY's upward movements. On the 1-hour timeframe, the DXY exhibits a downward trend, but the 4-hour chart shows a neutral trend with a strong ADX of 31.81, suggesting underlying power. This duality in the DXY's signals hints at a market that isn't entirely convinced of a dollar slide. Furthermore, the recent surge in Brent crude oil prices to $95.71 and WTI to $89.62, driven by supply fears, can paradoxically support the dollar if it's perceived as a safe-haven asset during times of commodity-driven inflation or geopolitical uncertainty. Traders are watching to see if this commodity strength translates into broader inflation concerns, which could prompt the Federal Reserve to maintain a hawkish stance, thereby bolstering the dollar.
From a technical standpoint, the 1-day chart for USDJPY, while showing a neutral trend with an ADX of 17.53, presents an RSI of 51.5. This indicates a market that is not yet overextended and still has room for upward momentum, especially considering the Stochastic crossover on the 1-hour chart (K=57.92, D=47.9), which suggests a bullish signal. The MACD on the 1-hour chart also shows positive momentum, with the MACD line above the signal line. While the longer-term daily MACD is negative, indicating a potential headwind, the intraday and 4-hour signals are leaning towards continued appreciation. The argument here is that the market is pricing in a 'higher for longer' interest rate environment in the US, or at least a slower path to rate cuts compared to other major economies, particularly Japan. This interest rate differential is a fundamental driver that has historically supported USDJPY, and until that narrative significantly changes, the bulls have a compelling case.
The Bears' Counter-Argument: Yen's Resilience and Dollar Headwinds
On the flip side, the bearish case for USDJPY hinges on the potential for Yen strength, driven by a combination of factors including shifting central bank policies, a potential cooling in US inflation, and a re-evaluation of risk appetite. While the Bank of Japan has maintained its ultra-accommodative stance, any hint of a policy shift, however subtle, could trigger significant Yen appreciation. Market participants are closely monitoring every statement from BoJ officials for signs of a pivot. Furthermore, the recent easing of Middle East tensions, although fragile, has reduced the immediate safe-haven demand for the dollar. The US Dollar Index (DXY) showing a downward trend on the 1-hour chart at 97.99, coupled with its neutral 4-hour trend, suggests that the dollar's upward momentum might be losing steam. If inflation data in the US begins to cool, as some early indicators suggest, it could open the door for the Federal Reserve to consider rate cuts sooner rather than later, narrowing the interest rate differential with Japan and pressuring USDJPY.
Technically, the bears point to the 1-day ADX reading of 17.53, which, despite its moderate strength, is associated with a neutral trend, implying that the current upward move might lack conviction. The Stochastic on the 1-day chart (K=53.22, D=54.21) shows a bearish crossover, with the %K line dipping below the %D line, indicating potential downward pressure. The MACD on the 1-hour chart, while positive, is hovering close to the signal line, suggesting that this bullish momentum could be waning. The 4-hour chart's RSI at 50.05 further reinforces the idea of a market at a crossroads, with no clear directional conviction. Moreover, the rising prices of Brent and WTI crude oil, while sometimes supporting the dollar, also signal inflationary pressures that could eventually lead to reduced consumer spending and economic slowdown in the US, a scenario that typically benefits safe-haven currencies like the Yen. The recent news about AUD projected to get stronger than Yen over the next week, though a cross-currency pair, hints at broader strength in Asian currencies that could eventually spill over to the Yen.
Navigating the Technical Landscape: $158.95 as the Battleground
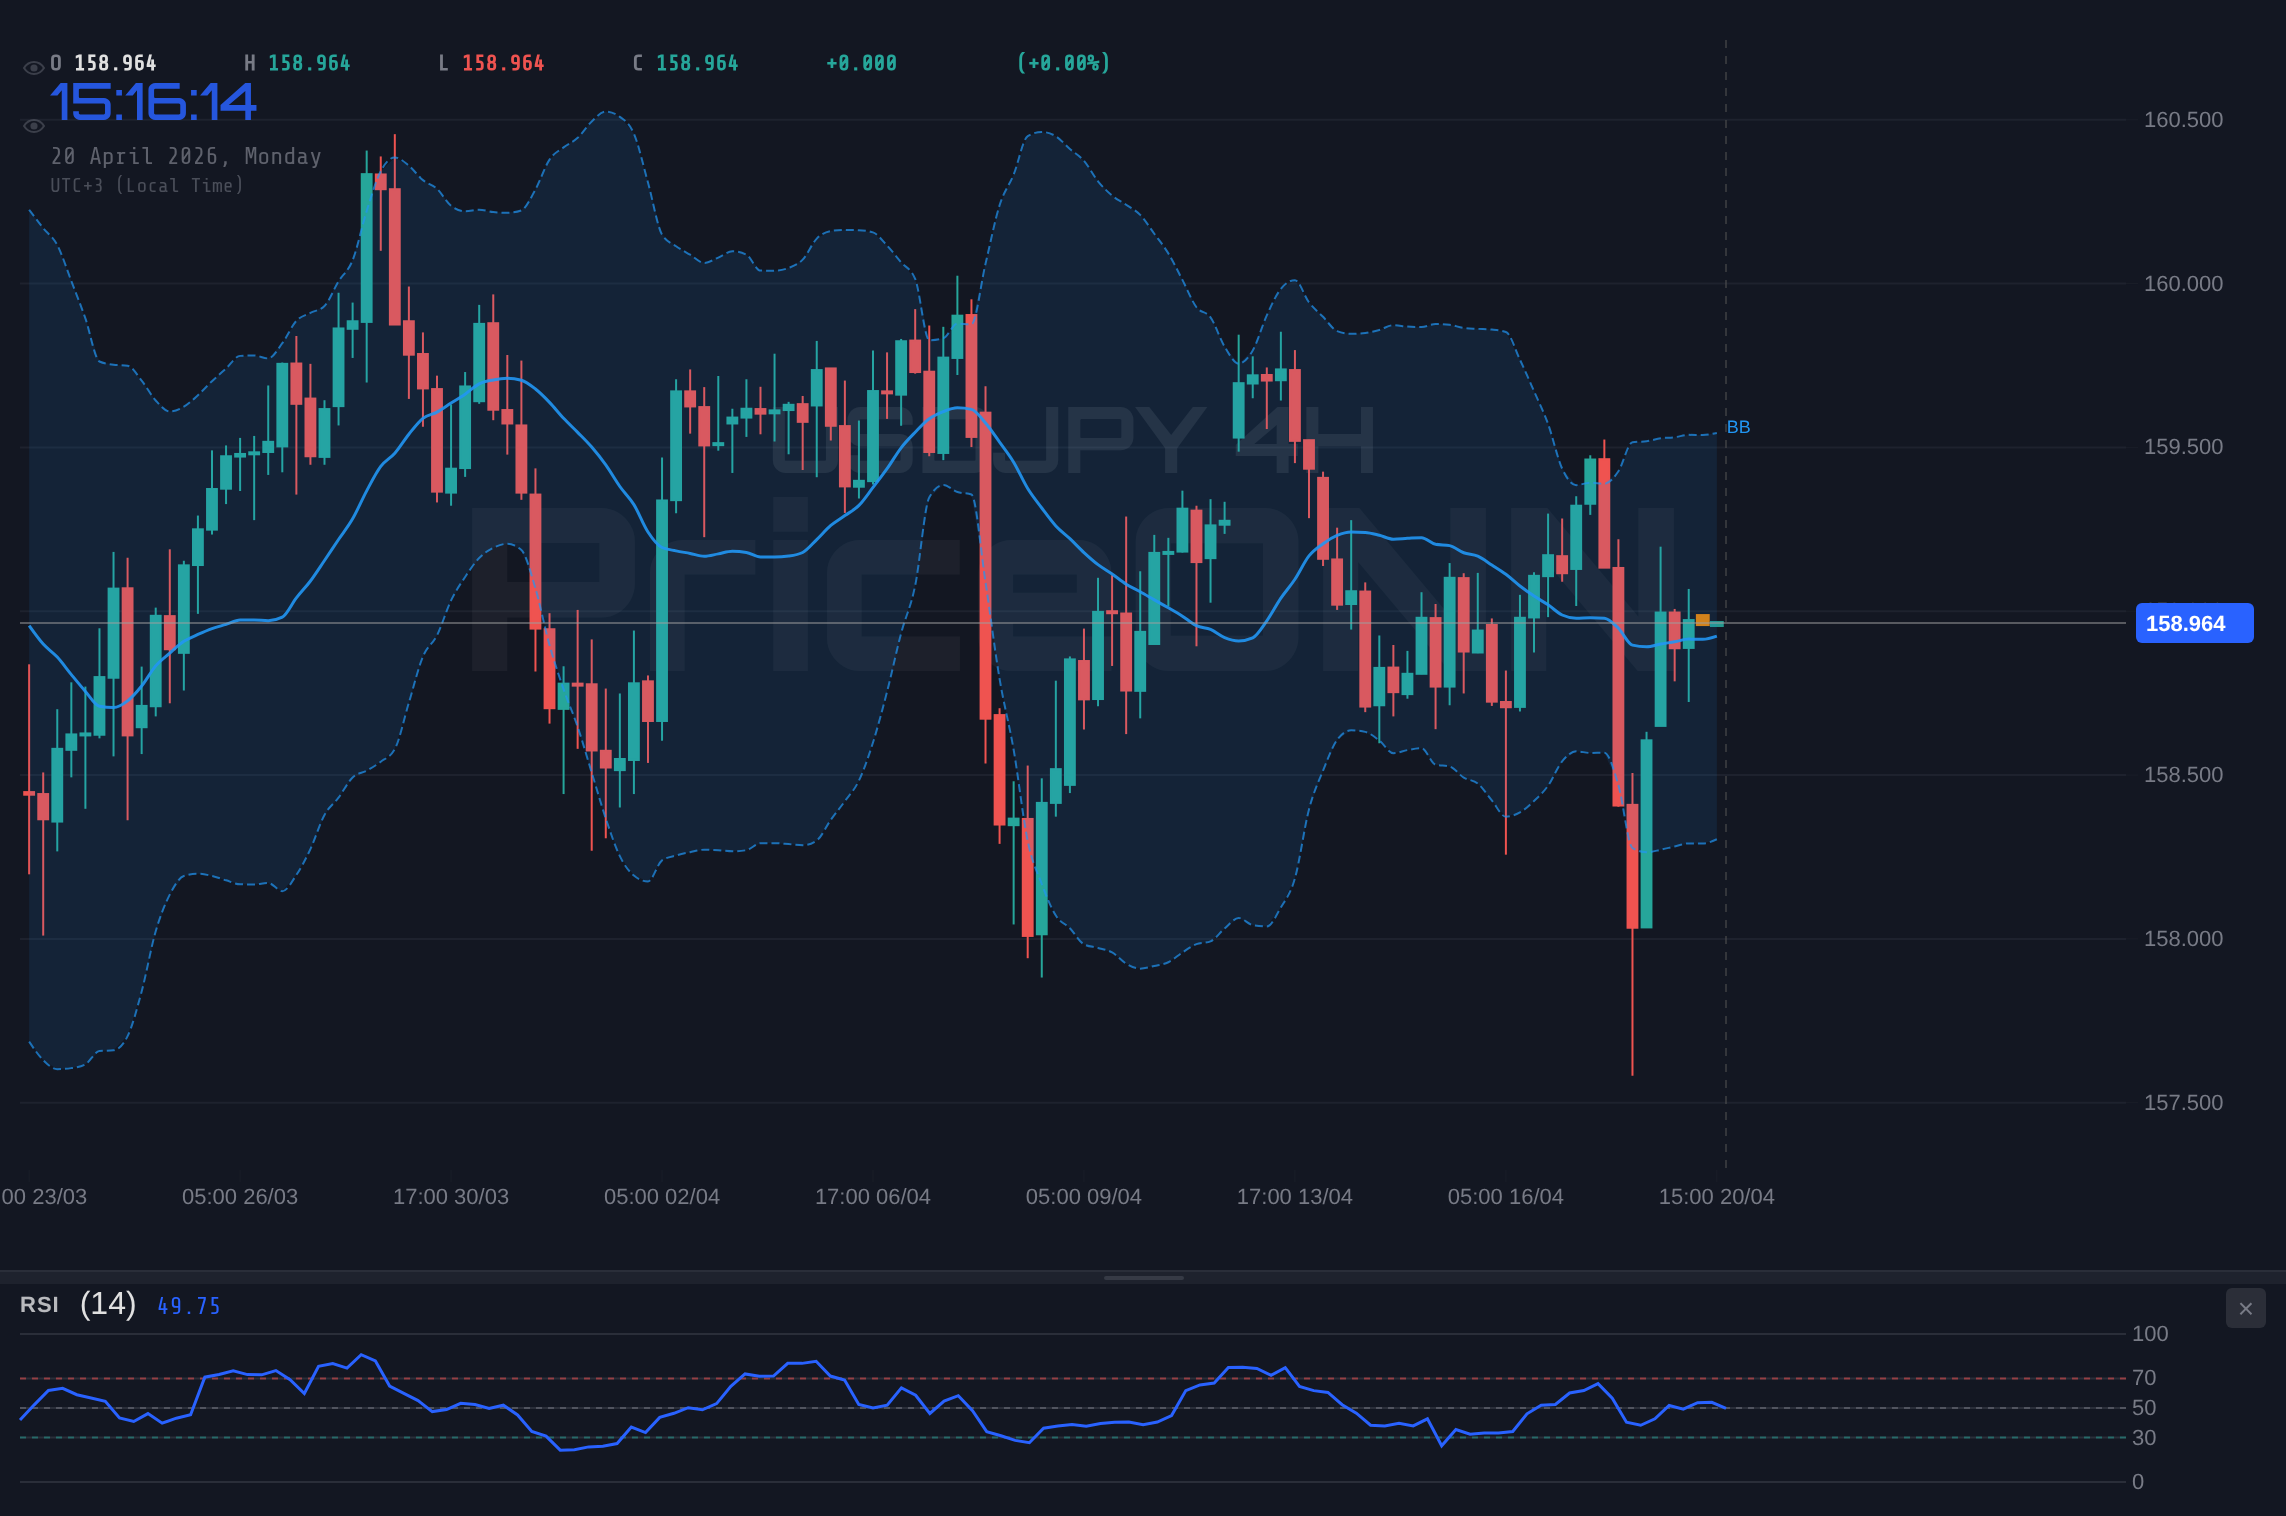
The current price action around $158.95 for USDJPY is a clear testament to the technical battle unfolding. On the 1-hour chart, the pair is testing immediate resistance at 158.961, with further levels at 159.019 and 159.072. Support is seen at 158.85, 158.797, and 158.739. The RSI(14) at 53.24 on this timeframe shows a slight upward bias, but the Stochastic crossover (K=57.92, D=47.9) is a more immediate bullish signal, suggesting a potential short-term push higher. However, the ADX at 17.27 indicates weak trend strength, implying that any move might be choppy and lack follow-through. This is where confirmation becomes key. A sustained break above 159.072, backed by increasing volume and positive momentum on the MACD, could signal a continuation towards the next resistance levels. Conversely, a failure to break higher and a subsequent move below the 158.739 support could signal a reversal.
Looking at the 4-hour timeframe, the picture becomes more complex. The trend is technically neutral, with an ADX of 27.16, suggesting a more established, albeit not overpowering, trend. Resistance is eyed at 159.001, 159.114, and 159.222, while support lies at 158.78, 158.672, and 158.559. The RSI at 50.05 is right at the neutral line, offering little directional clue. The Stochastic shows a bullish signal (K=70.11, D=51.33), but the MACD is currently negative, indicating a divergence. This conflict between indicators suggests a period of consolidation or a potential turning point. On the daily chart, the situation is similarly nuanced. The trend is neutral, ADX is 17.53, and RSI is 51.5. The Stochastic crossover (K=53.22, D=54.21) is bearish, contradicting the bullish signals seen on shorter timeframes. The key resistance levels on the daily chart are significantly higher, at 159.559, 160.513, and 161.501, but reaching them would require overcoming considerable immediate hurdles. The overall technical picture suggests a market waiting for a catalyst.
The Intermarket Context: DXY, Oil, and Risk Sentiment
Understanding USDJPY requires looking beyond the pair itself and examining its correlations with other major markets. The Dollar Index (DXY) is a primary driver. Currently, DXY is exhibiting mixed signals: a downtrend on the 1-hour chart (97.99) but a strong ADX (31.81) on the 4-hour chart, suggesting underlying power despite short-term weakness. If DXY falters, it would typically put downward pressure on USDJPY. Conversely, a DXY rally above 98.15 could provide the impetus for USDJPY to break higher. The correlation between USDJPY and DXY is generally positive, meaning a stronger dollar usually translates to a stronger USDJPY.
The recent surge in oil prices (Brent at $95.71, WTI at $89.62) adds another layer of complexity. Rising oil prices can signal increasing inflation expectations, potentially leading to a hawkish response from the Federal Reserve, which would support the dollar and USDJPY. However, sustained high oil prices can also dampen global economic growth and reduce risk appetite, which might benefit the Japanese Yen as a safe-haven currency, thus creating a counter-pressure on USDJPY. The market is currently grappling with this dichotomy: is the oil surge a signal of robust demand and inflation that favors dollar strength, or a precursor to economic slowdown that favors Yen strength? The recent news about the Strait of Hormuz closure sparking supply fears and crude oil prices eyeing $100 highlights the sensitivity of this market to geopolitical events, which directly impacts the safe-haven flows influencing both the dollar and the yen.
Equity markets also play a role. The S&P 500 is trading at 6572.87, showing a strong daily upward trend but with RSI in overbought territory (70.95) on the 1-hour chart, suggesting potential pullback. The Nasdaq 100 is at 26555.75, also showing a strong 4-hour uptrend but with RSI at 73.27 on the 4-hour and 72.62 on the daily, indicating overbought conditions. If major US indices experience a significant correction, it could trigger a flight to safety, potentially benefiting the Yen more than the dollar, especially if the decline is seen as a harbinger of US economic weakness. Conversely, continued equity strength would likely support riskier assets and potentially reinforce the dollar's strength against the Yen.
The Verdict: A Critical Juncture for USDJPY
USDJPY is at a pivotal point, with $158.95 acting as a crucial resistance level. The bulls have the momentum from recent price action and some supportive technical signals on shorter timeframes, bolstered by the possibility of continued dollar strength driven by interest rate differentials and potential inflation concerns. However, the bears have valid arguments rooted in the weakening DXY on intraday charts, bearish Stochastic and MACD signals on longer timeframes, and the potential for Yen appreciation if risk sentiment shifts or if US economic data deteriorates. The confluence of mixed technical indicators across different timeframes, conflicting intermarket signals (oil vs. equities), and geopolitical uncertainties means that a clear directional conviction is currently lacking.
The ADX readings across multiple timeframes (17.27 on 1H, 27.16 on 4H, 17.53 on 1D) consistently point towards a lack of strong trend, reinforcing the idea of a market in consolidation or at a turning point. This suggests that traders should exercise caution and wait for clearer signals. A decisive break above the immediate resistance cluster around $159.00-$159.20, confirmed by strong volume and positive follow-through on daily indicators, would lend credence to the bullish case, targeting higher levels. Conversely, a failure to break higher and a decisive move below the support at $158.739, especially if accompanied by a DXY decline and increased risk aversion, could signal a significant pullback towards daily support levels.
The upcoming economic data releases, particularly those related to US inflation and employment, will be critical in shaping the narrative. If these data points come in weaker than expected, they could fuel speculation of earlier Fed rate cuts, thereby weakening the dollar and USDJPY. On the other hand, strong inflation figures or resilient employment numbers could reinforce the 'higher for longer' interest rate narrative, providing a tailwind for USDJPY. Until then, price action around $158.95 will remain the primary focus, with traders looking for confirmation before committing to a significant directional trade. The market is currently balanced on a knife's edge, and the next few trading sessions will be crucial in determining whether USDJPY can break through resistance or is set for a retracement.
Bearish Scenario: Yen Strength Prevails
65% ProbabilityNeutral Scenario: Consolidation Around $158.95
25% ProbabilityBullish Scenario: Dollar Surge Continues
10% ProbabilityFrequently Asked Questions: USDJPY Analysis
What happens if USDJPY breaks above $159.222 resistance?
A sustained break above $159.222 on the 1-hour chart, confirmed by increasing volume, would likely signal a continuation of the bullish trend. This could open the door for USDJPY to target the daily resistance levels, with the first significant target being $159.559.
Should I buy USDJPY at current levels of $158.95 given the mixed signals?
Buying at current levels of $158.95 is a high-risk proposition given the mixed signals and strong resistance. A more prudent approach would be to wait for confirmation. A bullish scenario would be triggered by a close above $159.222, while a bearish scenario would be confirmed by a break below $158.739, offering clearer entry points with defined risk.
Is the RSI at 51.5 a buy signal for USDJPY on the daily chart?
An RSI reading of 51.5 on the daily chart is considered neutral, indicating neither strong overbought nor oversold conditions. While it suggests a slight upward bias, it's not a standalone buy signal. Confirmation from other indicators, like a bullish Stochastic crossover or MACD momentum, and a break of key resistance levels would be needed to validate a bullish trade.
How will upcoming US inflation data affect USDJPY this week?
Upcoming US inflation data will be crucial. Stronger-than-expected inflation could reinforce the 'higher for longer' Fed rate narrative, supporting the dollar and pushing USDJPY higher towards resistance levels like $159.559. Conversely, softer inflation could lead to expectations of earlier Fed rate cuts, weakening the dollar and potentially causing USDJPY to fall towards support around $158.559.
Track markets in real-time
AI-powered analysis, technical indicators and real-time price data.
Join Our Telegram Channel
Breaking market news, AI analysis and trading signals instantly.
Join Channel