Weekly Market Outlook - Week 17 (April 20, 2026 – April 24, 2026): Inflation Watch, Fed Speak, and Commodity Volatility
Week 17 (April 20, 2026 – April 24, 2026) market outlook: Key U.S. retail sales and U.K. inflation data are set to drive market sentiment. Analysis of DXY, Forex majors, commodities, crypto, and indices.
Weekly Market Outlook: April 20, 2026 – April 24, 2026 (Week 17)
Executive Summary
The upcoming trading week, April 20-24, 2026, will likely be dominated by key inflation data releases and central bank commentary. Traders will be closely monitoring U.S. Retail Sales on Tuesday and U.K. CPI on Wednesday for insights into consumer spending and inflationary pressures. Federal Reserve officials, including Governor Waller, are also scheduled to speak, potentially offering guidance on monetary policy. Commodity markets, particularly oil, may experience continued volatility following recent geopolitical developments. The overall market sentiment will be heavily influenced by these economic indicators and central bank pronouncements.
The US Dollar Index (DXY) is currently positioned with a mixed technical picture across timeframes. On the 1-hour chart, the DXY shows a BUY signal with RSI at 56.8 and CCI at 6.6. However, the 4-hour and daily charts present a SELL signal, with the daily RSI at 40.6 and MACD histogram negative at -0.21. The weekly sentiment leans towards SELL. The immediate focus will be on the 97.830 pivot level. A break above resistance at 98.600 could signal further upside, while a fall below support at 97.190 might indicate renewed dollar weakness. Key U.S. economic data, particularly retail sales, will be crucial in shaping the dollar's trajectory this week.
EUR/USD is showing conflicting signals across timeframes. The 1-hour chart indicates a SELL sentiment (RSI 38.7, Stochastics %K at 8.7), while the 4-hour and daily charts suggest BUY signals (RSI 58.2, RSI 60.9). The weekly sentiment is BUY. The pair will be closely watching the 1.17889 pivot. A decisive move above resistance at 1.18684 could open the door for further appreciation, potentially targeting the 1.19000 Fibonacci level. Conversely, a break below support at 1.16977 might lead to a test of the 1.17000 Fibonacci level.
GBP/USD exhibits a mixed short-term picture. The 1-hour chart leans SELL (RSI 41.9, Stochastics %K at 21.3), while the 4-hour and daily charts are neutral to BUY (RSI 57.0, RSI 58.5). The weekly sentiment is BUY. The key pivot level to monitor is 1.35445. Upside momentum could target resistance at 1.36519, potentially influenced by U.K. inflation data. A downside move might find support near 1.34170, aligning with the 61.8% Fibonacci retracement level at 1.35000.
USD/JPY presents a predominantly bearish technical outlook on shorter timeframes. The 1-hour, 4-hour, and daily charts all show a SELL signal, with the daily RSI at 48.7 and MACD histogram negative at -0.17. The weekly sentiment is BUY. The pair is trading below its 158.89 pivot. A sustained move below support at 157.44 could lead to further declines, potentially testing the 156.36 Fibonacci level. Resistance is seen at 159.93.
AUD/USD shows strength on the 4-hour and daily charts (RSI 64.6, RSI 64.9), with a BUY sentiment. The 1-hour chart, however, leans SELL (RSI 46.2). The weekly sentiment is BUY. The pair is currently hovering around the 0.71689 pivot. A break above resistance at 0.72314 could signal further upside, potentially targeting the 0.72000 Fibonacci resistance. Conversely, a retreat below support at 0.70967 might signal a bearish turn.
NZD/USD displays a mixed short-term technical picture. The 1-hour chart suggests a SELL signal (RSI 44.0), while the 4-hour and daily charts lean towards BUY (RSI 59.4, RSI 56.0). The weekly sentiment is BUY. The pair is trading near its 0.58964 pivot. A move above resistance at 0.59515 could extend gains, while a failure to hold support at 0.58321 might trigger a pullback towards the 0.59000 Fibonacci levels.
Gold exhibits a predominantly bullish sentiment across all timeframes (1H, 4H, 1D, 1W). Daily RSI is at 53.9, and MACD histogram is positive at +33.59, supporting upward momentum. The immediate focus will be on the 4,800.49 pivot. A break and hold above resistance at 4,893.08 could propel prices towards the 50% Fibonacci retracement at 4,758.92, though this seems counterintuitive to the bullish trend. More realistically, if the bullish trend continues, watch for a test of the 61.8% Fibonacci extension level at 4,914.68. Support is located at 4,763.00.
Silver presents a strong bullish technical setup across all monitored timeframes. The daily RSI is at 58.5, and the MACD histogram is positive at +1.25, indicating positive momentum. The pair is trading above its 79.080 pivot. Key resistance to watch will be at 82.920. A sustained break above this level could see prices extend towards the 38.2% Fibonacci retracement at 82.830. Support is established at 77.350.
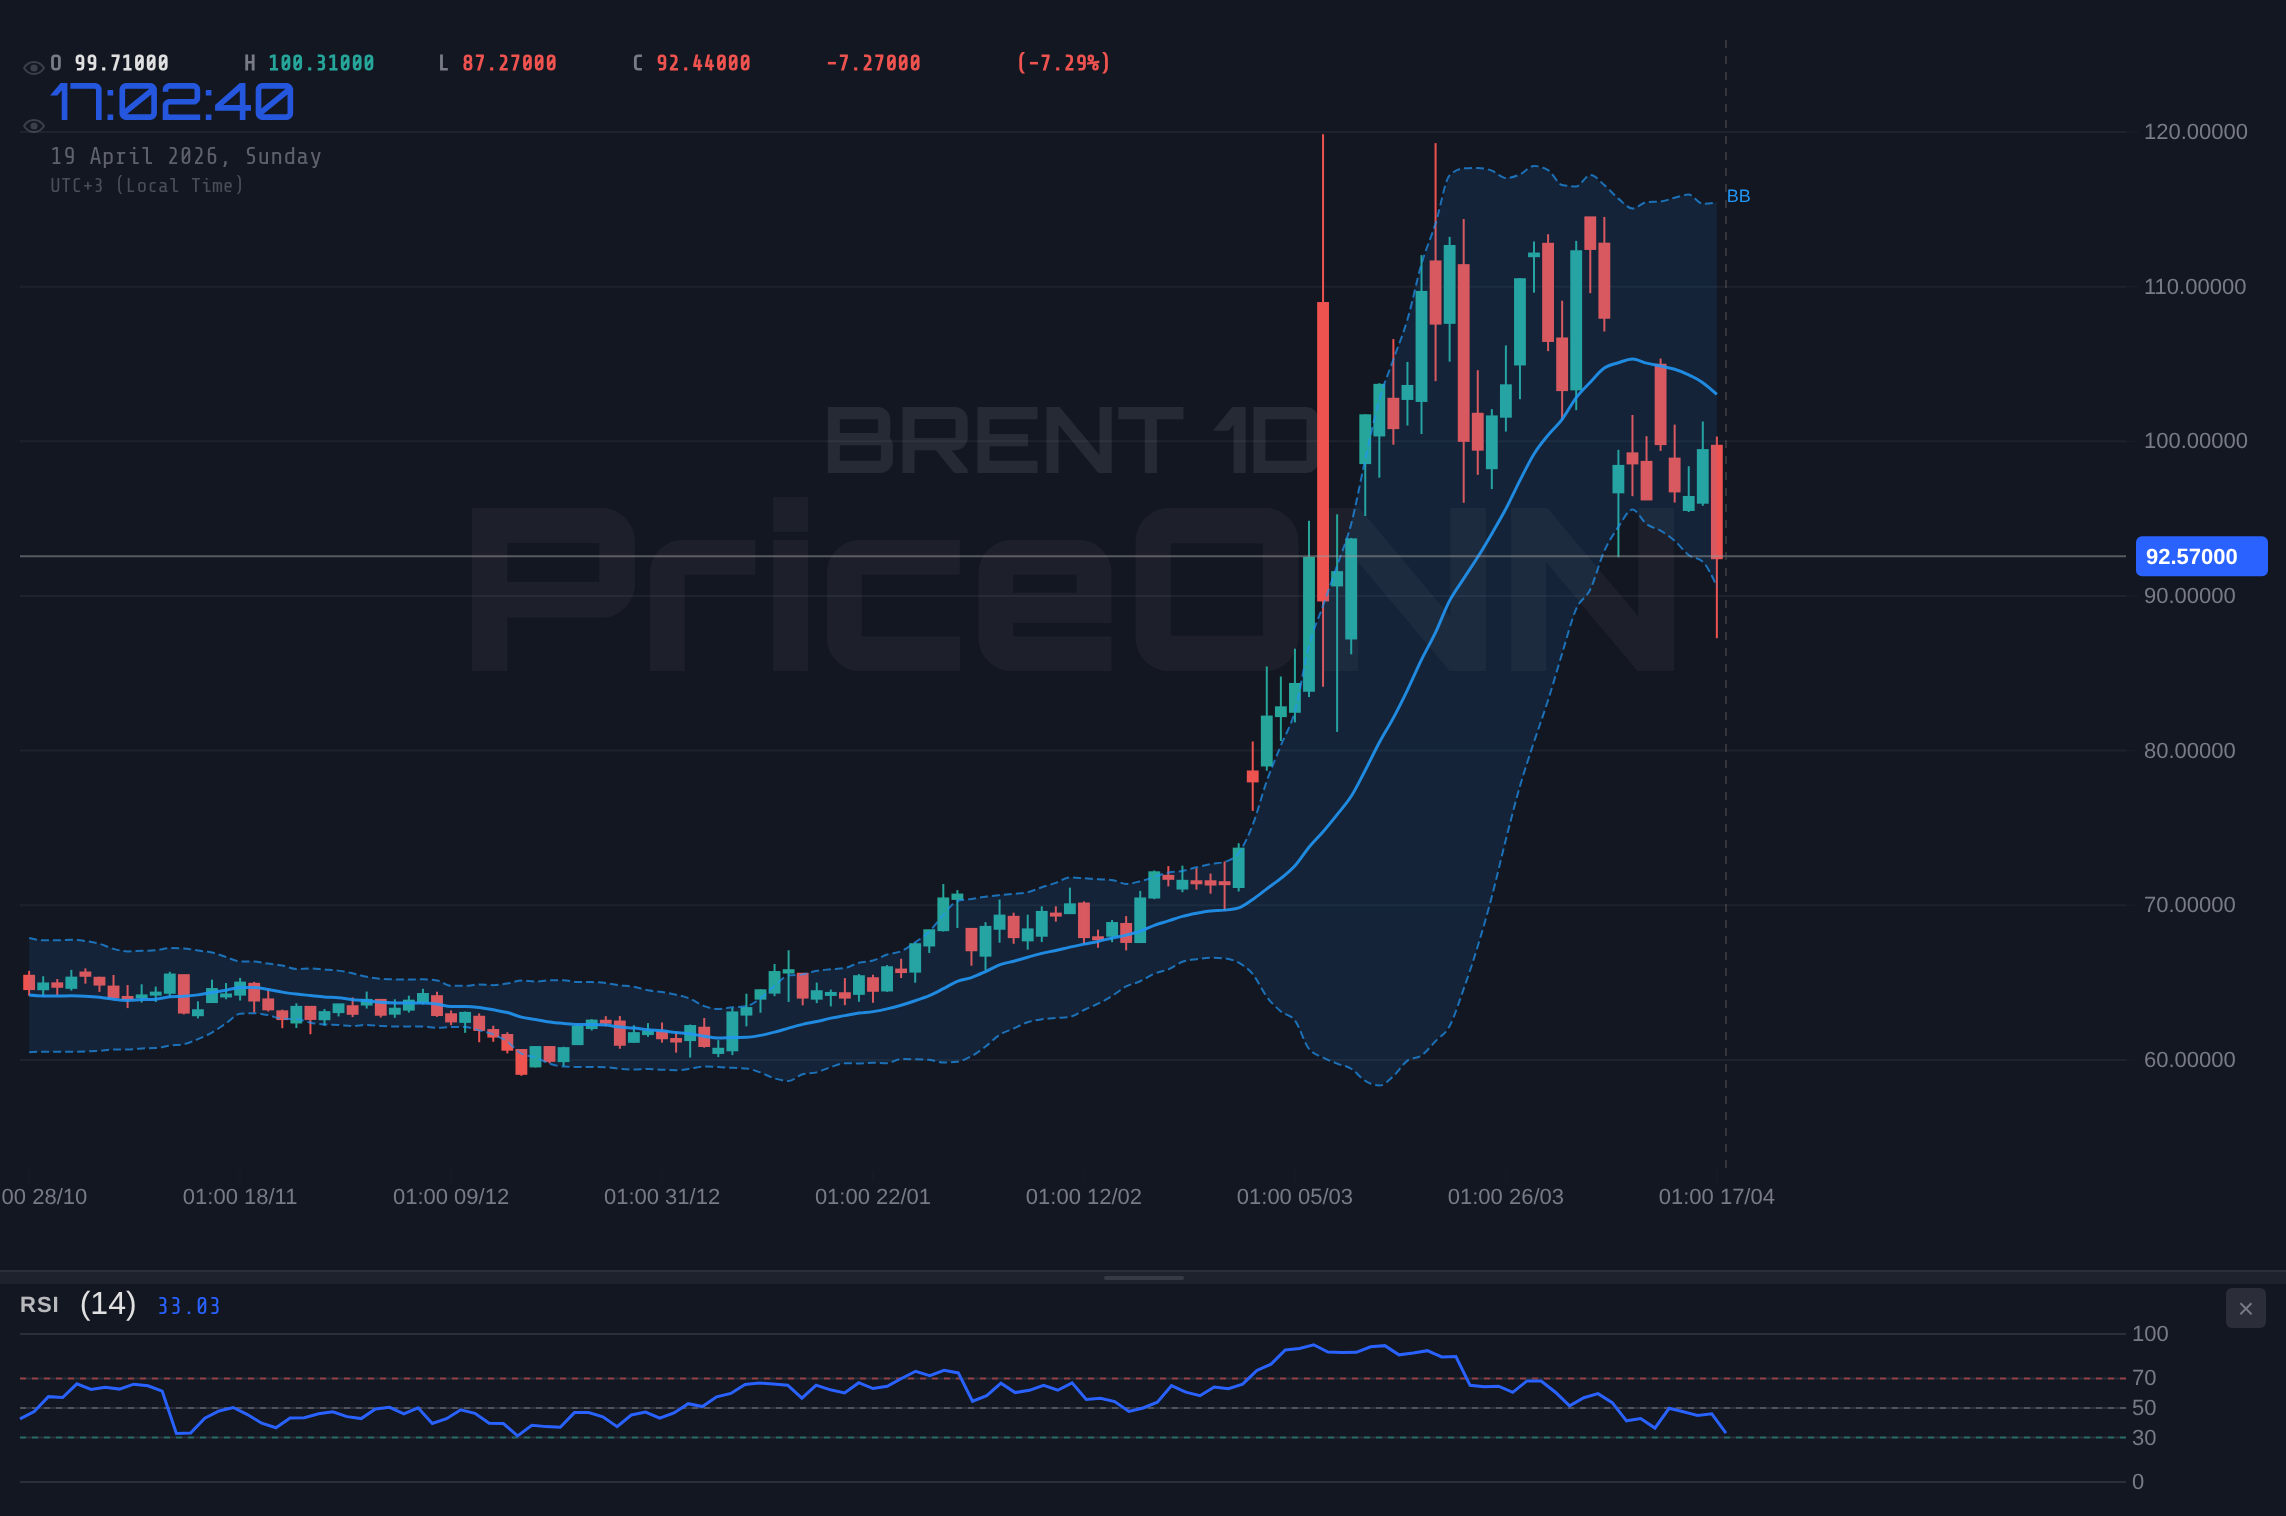
Brent Crude is showing a bearish sentiment across shorter timeframes (1H, 4H, 1D), with the daily RSI at 44.0 and MACD histogram negative at -2.33. The weekly sentiment is BUY, indicating a potential longer-term bullish bias. The price is trading below its 98.85 pivot. If the bearish short-term trend persists, a break below support at 90.96 could lead to further downside, targeting the 61.8% Fibonacci retracement at 87.24. Resistance is seen at 101.86.
WTI Crude mirrors Brent's bearish short-term technicals, with a SELL sentiment on the 1H, 4H, and 1D charts (Daily RSI 43.2, MACD histogram -2.69). The weekly sentiment remains BUY. The price is below the 92.61 pivot. Should the bearish momentum continue, a breach of support at 86.11 could lead to further declines towards the 61.8% Fibonacci retracement at 83.89. Resistance is situated at 96.95.
Bitcoin presents a predominantly bullish outlook across all timeframes, with a strong BUY sentiment indicated by daily RSI at 63.2 and a positive MACD histogram at +577.96. The price is trading above the 76,240 pivot. A continuation of the bullish trend could see Bitcoin challenge resistance at 79,094, potentially extending towards the 23.6% Fibonacci retracement at 75,183, although this level is below the current price and may represent a support rather than a target. Key support is observed at 72,905.
Ethereum shows a mixed technical picture, with BUY signals on the 1-hour and daily charts (Daily RSI 59.2, MACD histogram +16.42), but a SELL signal on the 4-hour timeframe. The weekly sentiment is SELL. The price is trading near the 2,375.12 pivot. A move above resistance at 2,518.10 could signal further upside, potentially testing the 23.6% Fibonacci retracement at 2,330.74. However, a sustained break below support at 2,206.58 might trigger a deeper correction.
The S&P 500 exhibits a strong bullish sentiment on shorter timeframes (1H, 4H), with RSI at 71.0 and 62.8 respectively, and positive MACD histograms. However, the daily chart shows a SELL signal (RSI 45.4, MACD histogram -6.48), and weekly sentiment is SELL. The index is trading above the 6,458 pivot. A push above resistance at 6,833 could see further gains, potentially targeting the 38.2% Fibonacci retracement at 6,579. Support is found at 6,377.
The Nasdaq 100 shows a strong bullish technical posture across all timeframes, with daily RSI at 75.3 and a significant positive MACD histogram at +303.01. The index is trading above the 26,272 pivot. A sustained rally could challenge resistance at 26,715, potentially extending towards the 38.2% Fibonacci retracement at 25,216. Key support is located at 25,859.
The Dow Jones 30 exhibits a strong bullish sentiment across all timeframes. The daily RSI is at 69.5, and the MACD histogram is strongly positive at +351.81. The index is trading above its 48,541 pivot. A continued upward move could see it test resistance at 49,091, potentially pushing towards the 61.8% Fibonacci retracement at 48,332. Support is found at 48,074.
Resistance
Price
R3
49,091
R2
48,880
R1
48,752
Pivot
48,541
Support
Price
S1
48,413
S2
48,202
S3
48,074
Fib 61.8%
48,332
Economic Calendar Preview
U.S. Retail Sales MoM - Tue, Apr 21 12:30 UTC
Forecast: 1.4% | Previous: 0.6%
Scenario
Condition
Expected Impact
Better than expected
Actual > 1.4%
USD strengthens - Higher consumer spending indicates a robust economy, potentially supporting a hawkish Fed stance.
In line with forecast
Actual ≈ 1.4%
Neutral reaction - Data confirms expectations, leading to limited market movement.
Worse than expected
Actual < 1.4%
USD weakens - Lower consumer spending suggests economic headwinds, possibly leading to a more dovish Fed outlook.
U.S. Core Retail Sales MoM - Tue, Apr 21 12:30 UTC
U.K. Consumer Price Index (CPI) YoY - Wed, Apr 22 06:00 UTC
Forecast: 3.3% | Previous: 3%
Scenario
Condition
Expected Impact
Better than expected
Actual > 3.3%
GBP strengthens - Higher inflation may prompt the Bank of England to consider a more hawkish monetary policy stance.
In line with forecast
Actual ≈ 3.3%
Neutral reaction - Data meeting expectations likely results in limited GBP volatility.
Worse than expected
Actual < 3.3%
GBP weakens - Lower-than-expected inflation could reduce pressure on the Bank of England to tighten policy.
U.S. Crude Oil Inventories - Wed, Apr 22 14:30 UTC
Forecast: -1M | Previous: -0.913M
Scenario
Condition
Expected Impact
Better than expected
Actual < -1M (e.g., -2M)
Oil prices strengthen - A larger-than-expected draw suggests higher demand or lower supply, potentially boosting prices.
In line with forecast
Actual ≈ -1M
Neutral reaction - Inventory changes aligning with forecasts are unlikely to cause significant price swings.
Worse than expected
Actual > -1M (e.g., -0.5M or build)
Oil prices weaken - A smaller draw or an inventory build indicates weaker demand or increased supply, potentially pressuring prices.
Weekly Trading Bias
The upcoming week presents a complex trading environment. The US Dollar may see volatility around key data releases, with its direction hinging on inflation and consumer spending figures. Major currency pairs like EUR/USD and GBP/USD will be sensitive to their respective inflation prints and central bank commentary. Precious metals, particularly Gold and Silver, are showing bullish technicals, suggesting potential for further upside should market sentiment remain stable or improve. Energy markets (Brent and WTI) are experiencing short-term bearish pressure despite longer-term bullish signals; geopolitical events and inventory data will be critical. Cryptocurrencies, led by Bitcoin, maintain a strong bullish bias, though any shifts in broader risk appetite could impact their trajectory. Stock indices are largely bullish, but traders should remain vigilant for any signs of a broader market correction, especially if inflation data surprises to the upside.
Disclaimer: This content is for informational and educational purposes only and does not constitute investment advice, financial recommendation, or an offer to buy or sell any financial instrument. Past performance does not guarantee future results. Always do your own research and consult a licensed financial advisor before making investment decisions.
Track markets in real-time
AI-powered analysis, technical indicators and real-time price data.
We are looking for writers who produce market analysis, macro commentary, and data-driven content. Reach readers in 10 languages through our multilingual publishing platform.