

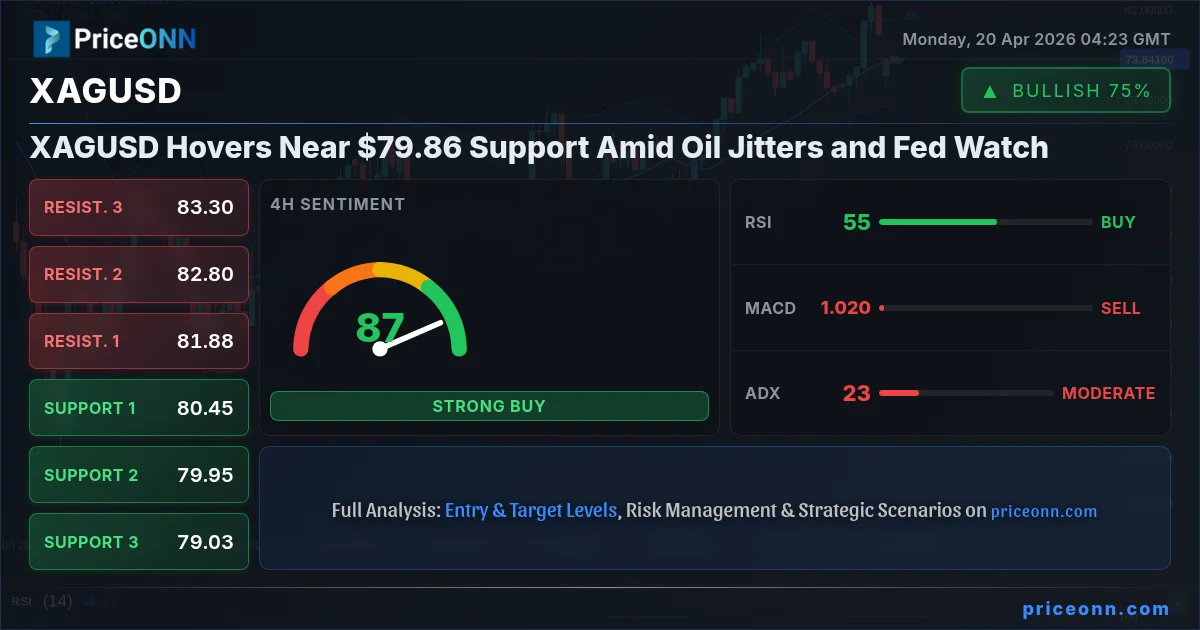
Is XAGUSD poised to hold its ground at $79.86, or will mounting oil price volatility and shifting Fed expectations drag the white metal lower? The battle between bulls and bears is intensifying as silver hovers precariously near a critical support zone, with traders seeking clarity amidst a complex web of global economic and geopolitical factors. This week's price action reveals a market on edge, where a single catalyst could trigger a significant move.
- XAGUSD is currently trading at $79.86, testing key support levels.
- RSI at 44.75 on the 1H chart indicates neutral momentum with a slight downward lean, while the 1D RSI is at 51.23, showing a potential for upside.
- Brent crude oil prices surged to $96.54, adding inflationary pressures and geopolitical risk premiums that could influence silver demand.
- Traders are closely monitoring upcoming Fed commentary for clues on interest rate policy, which heavily impacts dollar strength and commodity prices.
- The Dollar Index (DXY) is trading near 98.01, showing a strengthening trend that typically exerts downward pressure on precious metals.
The narrative surrounding silver is currently a tug-of-war between its role as an industrial metal and its traditional safe-haven appeal. On one hand, the robust performance of indices like the Nasdaq 100 (currently at 26511.51, though showing signs of overbought conditions on the 4H chart) suggests a degree of risk appetite in the broader market. However, this is countered by the persistent strength in the US Dollar Index (DXY), which has been climbing and is currently priced at 98.01. A stronger dollar inherently makes dollar-denominated commodities like silver more expensive for holders of other currencies, acting as a headwind.
The Bull Case for Silver: Industrial Demand and Inflation Hedge
Despite the headwinds, there are compelling arguments for silver to find its footing and potentially rally. Firstly, the underlying demand for silver in industrial applications remains strong. As economies continue to integrate technology, silver's crucial role in electronics, solar panels, and electric vehicles provides a solid fundamental floor. Analysts point to the ongoing trend of green energy investment, which directly benefits silver consumption. Furthermore, the spike in Brent crude oil prices to $96.54 injects a significant inflationary element into the global economic outlook. Historically, rising oil prices have often correlated with increased inflation expectations, which, in turn, can drive demand for precious metals like silver as an inflation hedge. While the 1D RSI for XAGUSD is hovering around 51.23, suggesting a neutral stance with a slight upward lean, this could be the calm before a storm if inflation concerns truly take root.
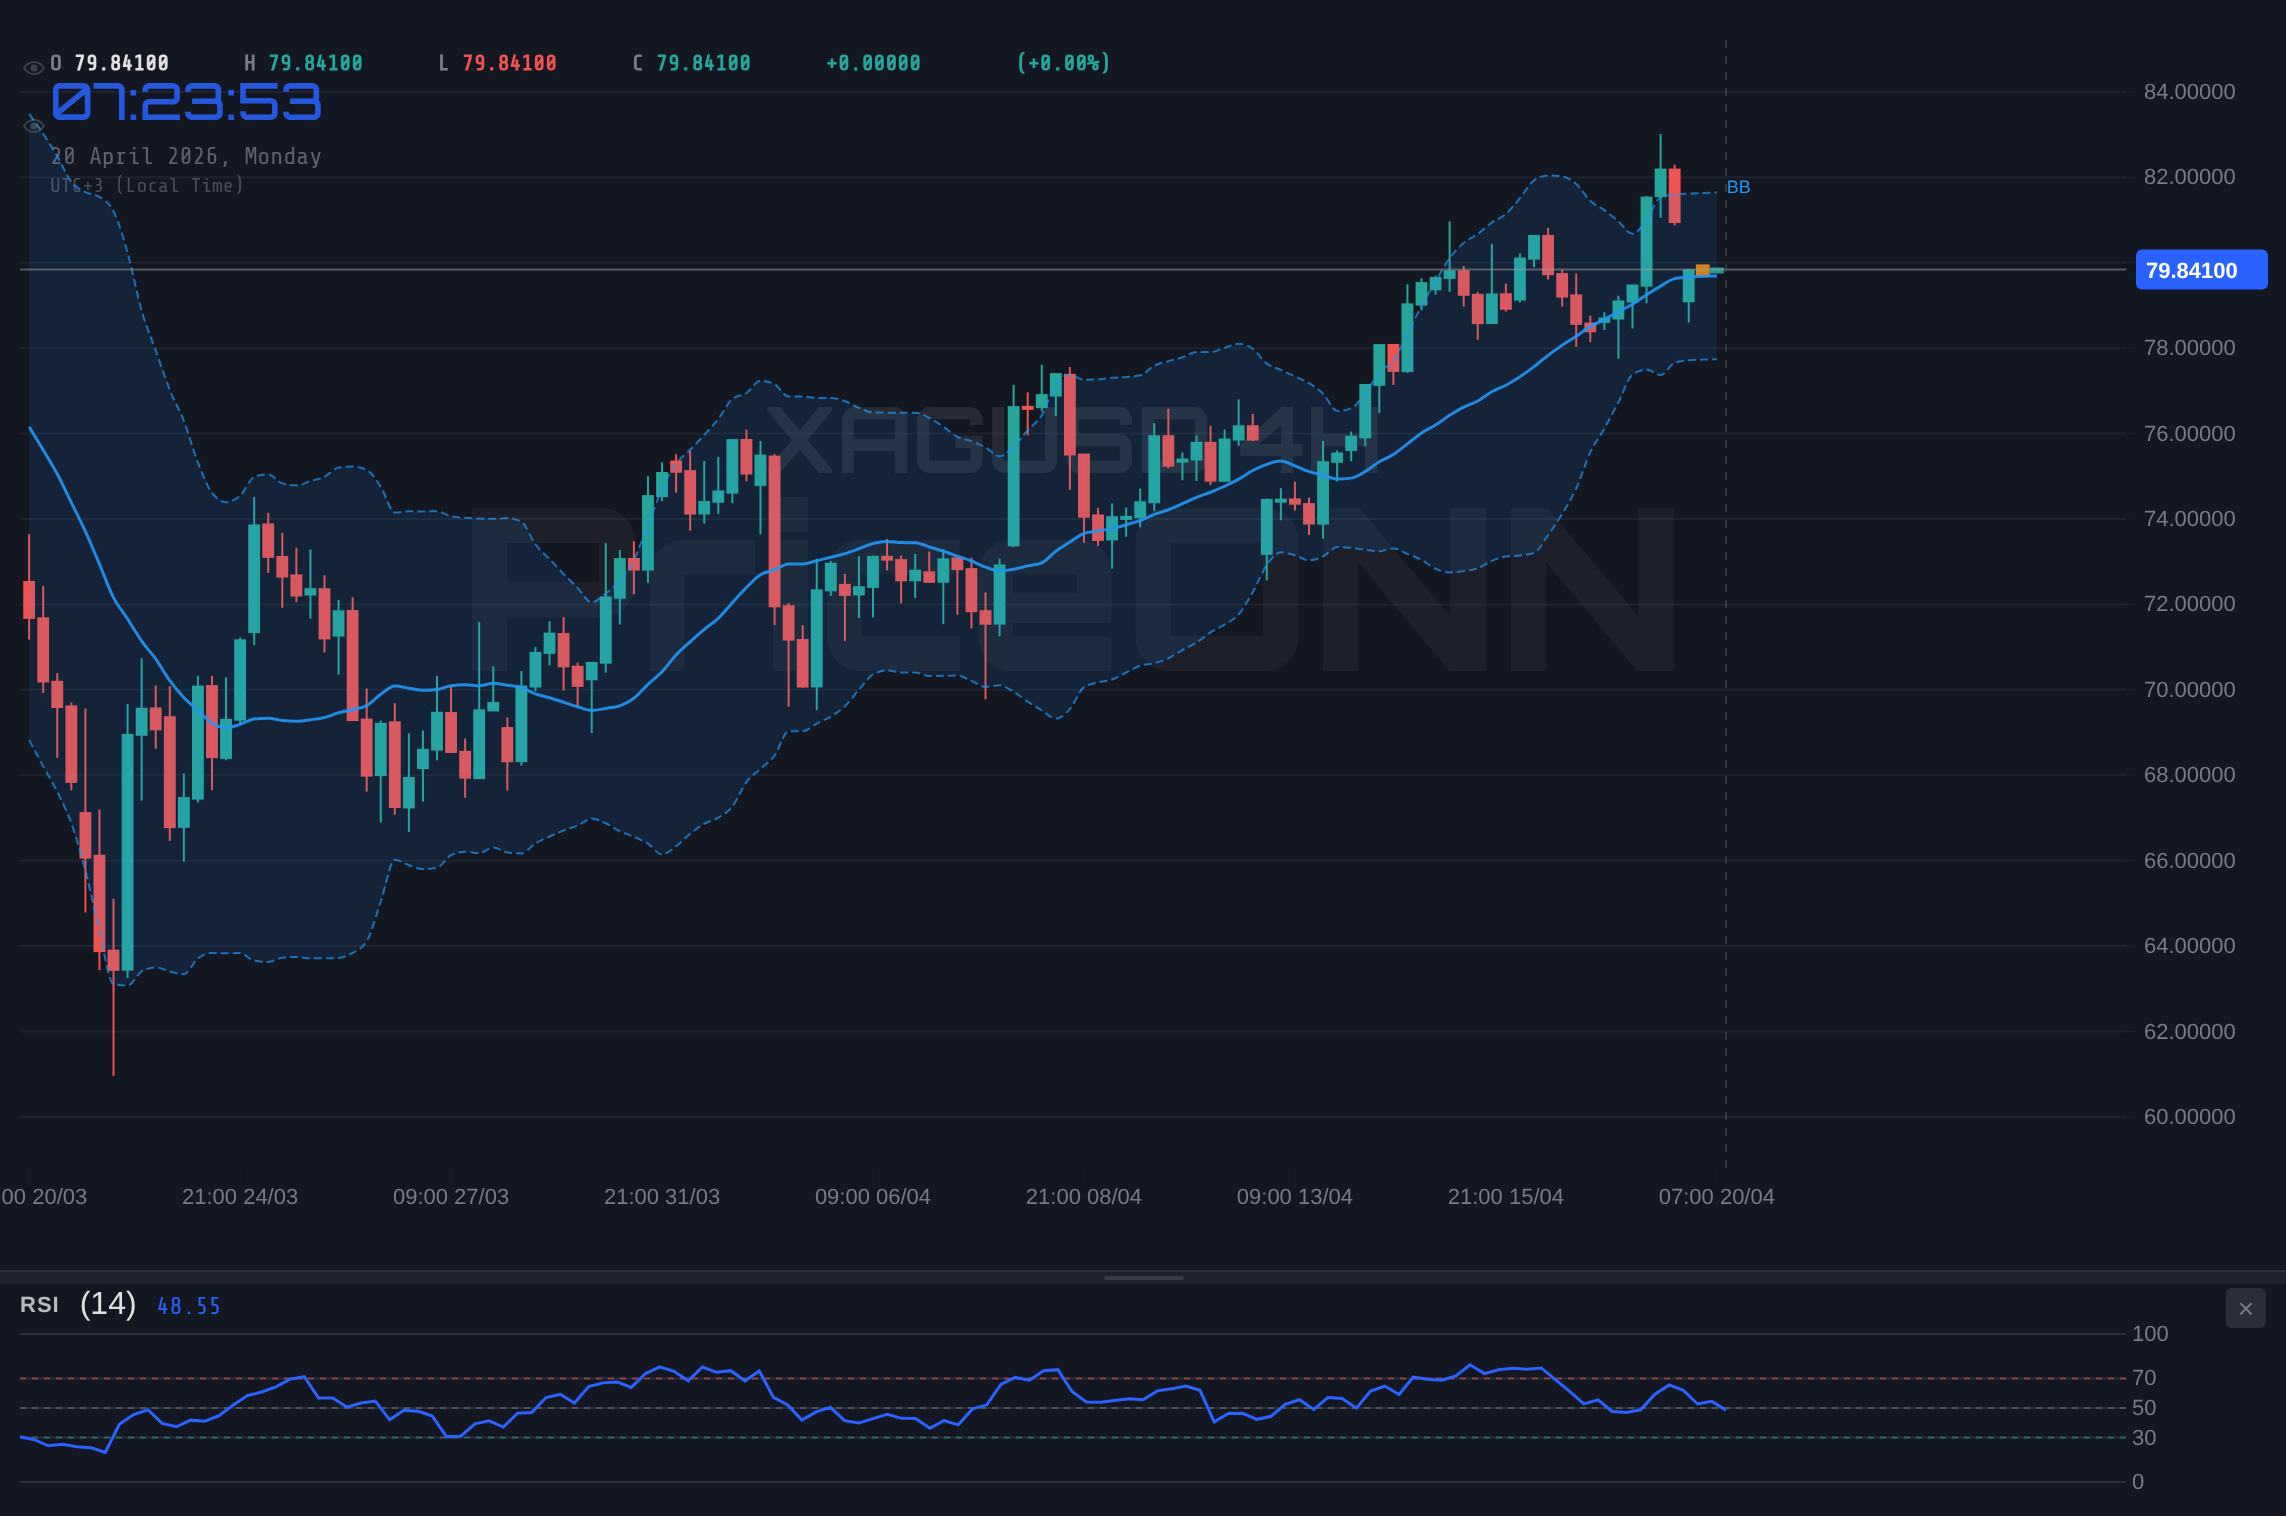
Technically, the 1D chart presents a more optimistic picture than the shorter timeframes. The 1D RSI at 51.23, while neutral, is showing an upward trend, and the MACD is above its signal line with positive momentum. Bollinger Bands on the daily chart are also above the middle band, indicating a potential for upward movement. The Stochastic Oscillator on the daily chart, with K=70.25 and D=76.82, is showing a potential pullback, but the overall daily trend strength, indicated by ADX at 21.26, suggests a moderate trend is in play. Investors looking for a long-term hedge against rising prices might see the current levels around $79.86 as an attractive entry point, anticipating a broader economic environment where inflation remains a concern and industrial demand continues to grow.
The Bear Case: Dollar Strength, Fed Uncertainty, and Risk-Off Sentiment
However, the bearish arguments are equally potent, if not more immediate. The relentless ascent of the DXY, currently at 98.01, is a significant deterrent. When the dollar strengthens, it typically puts pressure on assets priced in dollars, including silver. The 1H chart for XAGUSD clearly reflects this, with the RSI at 44.75 showing a bearish trend and the MACD in negative territory. The ADX at 27.05 on the 1H chart confirms a strong downward trend in the short term. This suggests that immediate selling pressure could dominate, pushing silver towards its immediate support levels, such as $79.49 and $79.03.
Adding to the bearish sentiment is the uncertainty surrounding Federal Reserve policy. While recent data might be mixed, any hint of continued hawkishness or a delayed pivot on interest rate policy would likely bolster the dollar further, exacerbating the pressure on silver. Geopolitical tensions, particularly those impacting oil prices like the situation around the Strait of Hormuz, can also create a complex risk environment. While typically boosting safe-haven assets, a sudden escalation could also trigger a broader risk-off sentiment that leads to a flight to the safety of cash or US Treasuries, rather than commodities. The SP500, despite its recent gains, is showing signs of struggle on the daily chart (ADX 47.51, strong downtrend), and a significant risk-off event could easily spill over into other markets, including silver. The 4H chart indicators also lean bearish, with ADX at 20.42 indicating a moderate downtrend, and Stochastic showing a crossover signaling potential further weakness.
Navigating the $79.86 Level: What the Indicators Say
The current price of $79.86 for XAGUSD sits at a critical juncture. On the 1-hour chart, the trend is neutral but leaning bearish, with the RSI at 44.75 and MACD showing negative momentum. This suggests that short-term traders might be looking to sell into rallies or fade strength. However, the daily chart paints a different picture. The 1D RSI at 51.23 indicates a neutral stance, but the upward trend and positive MACD momentum hint at underlying strength. The Stochastic on the daily chart is in overbought territory (K=70.25, D=76.82), which often precedes a pullback, but this can persist in strong uptrends. The ADX values across different timeframes are particularly interesting: 27.05 (1H), 20.42 (4H), and 21.26 (1D). These readings suggest that while there's a trend in play, its strength varies, and confirmation from other indicators is crucial.
The divergence between the short-term bearish signals and the longer-term neutral-to-bullish signals creates a challenging environment for traders. The key will be how price reacts to the immediate support around $79.49 and the resistance near $80.52. A decisive break below $79.49, especially on increasing volume, could signal a deeper correction, targeting the $79.03 support. Conversely, a strong move above $80.52, confirmed by rising RSI and MACD on the 1H chart, could signal a resumption of the bullish trend, with eyes potentially turning towards the $81.04 resistance level. The influence of oil at $96.54 and the DXY at 98.01 cannot be overstated; these external factors will likely dictate the short-term direction.
Intermarket Analysis: DXY, Oil, and the Fed's Shadow
Understanding XAGUSD's price action requires a look at its key correlations. The strengthening DXY at 98.01 is a primary concern for silver bulls. This inverse relationship is well-documented; as the dollar gains, silver tends to lose value. This is particularly true when the Fed maintains a hawkish stance, making dollar-denominated assets more attractive. Traders are dissecting every word from Fed officials, searching for clues about future monetary policy. Any indication of sustained higher interest rates would likely keep the dollar strong and cap silver's upside potential.
The surge in Brent crude oil to $96.54 adds another layer of complexity. Higher oil prices can signal rising inflation, which often benefits gold and silver as inflation hedges. However, they can also dampen economic growth prospects and increase risk aversion, which might not be entirely positive for industrial metals. The recent news about potential Strait of Hormuz disruptions adds geopolitical risk, which could support oil prices and, by extension, silver. Yet, the market's reaction to such news can be unpredictable, sometimes leading to short-term volatility that overwhelms fundamental drivers. The current data shows a mixed picture: ADX values suggest trends exist, but the conflicting signals from RSI and Stochastic across timeframes indicate a lack of clear consensus.
The broader equity markets also play a role. While the Nasdaq 100 shows a strong 4H uptrend (ADX 55.61), the daily chart (ADX 47.51, strong downtrend) and the 1H chart (ADX 26.77, strong downtrend) present a more cautious outlook. This internal conflict within the tech-heavy index mirrors the indecision seen in silver. If risk sentiment shifts decisively, driven by inflation fears or geopolitical escalation, it could lead to a broad sell-off, impacting silver negatively despite its potential inflation-hedge qualities.
Trade Scenarios for XAGUSD Near $79.86
Bearish Scenario: Testing the Lower Bounds
60% ProbabilityNeutral Scenario: Consolidation Around $79.86
25% ProbabilityBullish Scenario: Holding the Line at $79.86
15% ProbabilityUpcoming economic data releases and central bank speeches could introduce significant volatility. Traders should exercise caution and employ robust risk management strategies, especially if positions are held overnight. The correlation with oil prices ($96.54 Brent) and the DXY (98.01) remains a key factor to monitor.
The Verdict: Cautious Optimism Below $80
The technical indicators present a conflicting narrative for XAGUSD at $79.86. While the 1-hour and 4-hour charts show bearish leanings, with ADX values suggesting trends are present, the daily chart offers a more constructive outlook. The RSI at 51.23 on the daily chart, coupled with positive MACD momentum, suggests that underlying demand might be building. However, the strength of the US Dollar (DXY at 98.01) and the volatility in oil prices ($96.54 Brent) create significant short-term risks.
Given the current data, the most probable scenario involves continued consolidation or a slight pullback before a potential upward move. The immediate support at $79.49 is crucial. If this level holds, and the DXY shows signs of weakening or oil prices continue to fuel inflation concerns, silver could find the strength to challenge resistance levels towards $80.52 and beyond. However, a break below $79.49, especially if accompanied by a stronger dollar and falling oil prices, could quickly invalidate the bullish case, pushing XAGUSD towards $79.03 and potentially lower. The market is at a pivotal point, and confirmation from price action and external factors will be key.
Frequently Asked Questions: XAGUSD Analysis
What happens if XAGUSD breaks below the $79.49 support level?
If XAGUSD closes decisively below $79.49, particularly on increased volume, it signals a bearish continuation. This could trigger a move towards the next key support at $79.03, with the potential to extend towards the $78.60 low seen earlier in the daily range. Such a move would likely be exacerbated by a strengthening dollar and waning risk appetite.
Should I buy XAGUSD at current levels around $79.86 given the mixed signals?
Buying at $79.86 presents a risk due to conflicting short-term indicators and a strong DXY. A more prudent approach might be to wait for confirmation: either a hold above $79.49 with a confirmed dollar pullback, or a decisive break above $80.52. The probability of a short-term dip remains significant.
Is the RSI at 44.75 on the 1H chart a sell signal for XAGUSD?
An RSI of 44.75 on the 1-hour chart indicates neutral momentum with a slight bearish lean, suggesting selling pressure is present. While not an extreme oversold or overbought signal, it aligns with the short-term bearish trend and suggests that rallies might face resistance, making it a cautious signal rather than a definitive sell.
How will the rising Brent crude oil price ($96.54) impact XAGUSD's trajectory?
The surge in Brent crude to $96.54 fuels inflation concerns, which can historically support precious metals like silver as an inflation hedge. However, it also raises the specter of slower economic growth and could embolden central banks to maintain tighter policies, strengthening the dollar. The net impact on XAGUSD will depend on whether inflation fears or dollar strength dominates market sentiment.
Navigating the current market requires patience and a keen eye on key levels and correlations. While silver faces headwinds from dollar strength and short-term technical weakness, its role as an industrial metal and a potential inflation hedge provides a fundamental counter-balance. The coming days will likely be defined by how XAGUSD interacts with the critical $79.86 level and the broader macro-economic narrative unfolding around inflation, interest rates, and geopolitical stability. Traders who remain disciplined and wait for clear signals will be best positioned to capitalize on the eventual direction.
| Indicator | Value | Signal | Interpretation |
|---|---|---|---|
| RSI (14) | 44.75 | Bearish | Neutral momentum, slight downward lean on 1H |
| MACD | Neg. Momentum | Bearish | Below signal line on 1H, negative momentum |
| Stochastic | K:46.42, D:32.94 | Bullish | %K > %D crossover on 1H, potential reversal |
| ADX | 27.05 | Bearish | Strong downtrend on 1H |
| Bollinger Bands | Under Mid Band | Bearish | Price below middle band on 1H, indicating downward pressure |
Track markets in real-time
AI-powered analysis, technical indicators and real-time price data.
Join Our Telegram Channel
Breaking market news, AI analysis and trading signals instantly.
Join Channel