

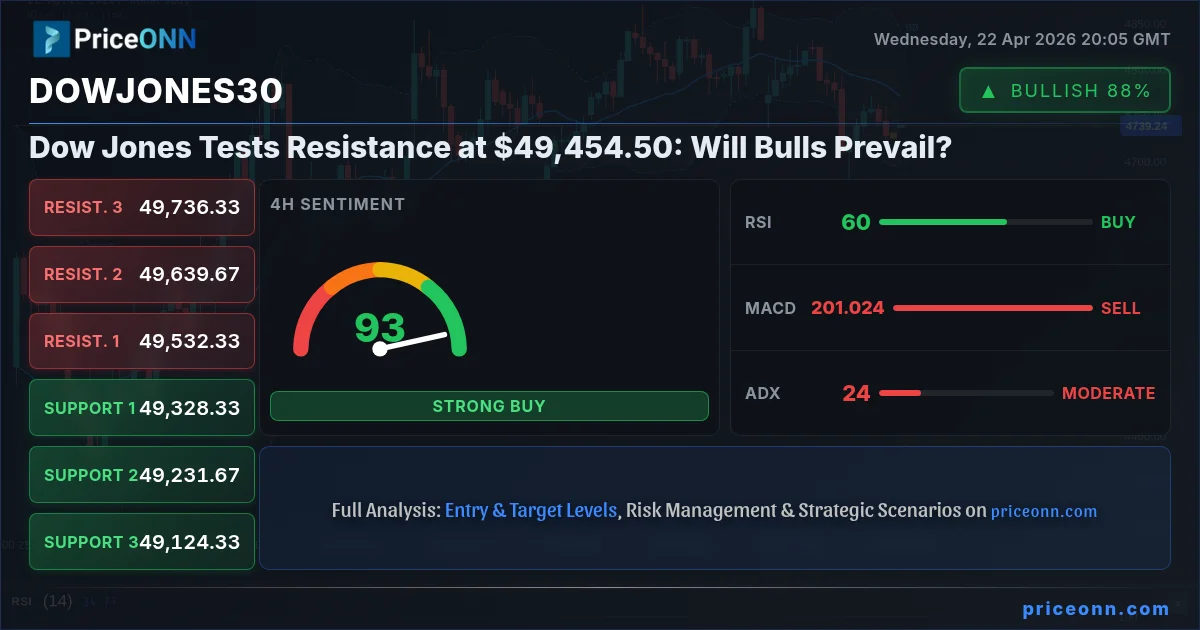
The Dow Jones Industrial Average is currently locked in a critical battle at the $49,454.50 mark, probing resistance levels that could dictate its short-term trajectory. As traders eye this pivotal zone, the question isn't just whether the index will push higher, but what underlying market forces are truly at play. My take, after poring over the latest data, is that while bulls are showing resilience, the path ahead is fraught with technical hurdles and macroeconomic crosscurrents that demand careful navigation. This isn't a straightforward rally; it's a market testing its resolve, and we need to understand the nuances to position ourselves effectively.
- The Dow Jones Industrial Average is currently trading at $49,454.50, testing resistance near $49,486.67.
- A crucial support level for the Dow Jones sits at $49,326.67, tested multiple times this week.
- The 1-hour RSI at 52.34 suggests neutral momentum, while the 1D RSI at 67.84 indicates a bullish tendency, showing conflicting signals.
- Broader market sentiment, influenced by DXY movements and upcoming economic data, will be critical for the Dow Jones's next move.
The sheer persistence of the upward trend in the Dow Jones Industrial Average, pushing it towards significant resistance, is a testament to underlying strength, but it's also a signal for caution. We've seen a remarkable climb, with the index currently hovering around $49,454.50. However, the immediate hurdle at $49,486.67 is not just a number; it represents a psychological and technical barrier that has previously capped rallies. Understanding the interplay between the intraday price action and the longer-term daily trend is paramount. The 1-hour chart shows a more neutral momentum, with RSI hovering around 52.34, hinting at a potential pause or consolidation. Conversely, the daily RSI at 67.84 still points towards bullish sentiment, though it's approaching the overbought territory where pullbacks become more likely. This divergence in signals across timeframes is precisely where savvy traders find their edge – by dissecting these conflicting indicators, we can anticipate potential shifts before they fully materialize.
Navigating the Technical Landscape: Levels and Indicators
Intraday Dynamics: The 1-Hour Chart's Story
Looking at the 1-hour chart for the Dow Jones Industrial Average, the picture is one of cautious optimism rather than outright bullish conviction. The index is currently priced at $49,454.50, having found immediate resistance near $49,486.67. The ADX at 16 on this timeframe suggests a weak trend, indicating that the current upward momentum might be losing steam or that the market is consolidating before its next significant move. This aligns with the RSI(14) reading of 52.34, which sits comfortably in neutral territory, offering no strong indication of either overbought or oversold conditions. However, the Stochastic Oscillator presents a mixed signal: the %K line at 24.83 is below the %D line at 46.55, suggesting a potential downward bias or bearish divergence, even as the overall trend indicator (ADX) remains weak. This complex interplay means that while intraday traders might see opportunities for short-term gains if resistance breaks, the lack of strong trend conviction on this timeframe suggests that any move higher could be met with significant profit-taking.
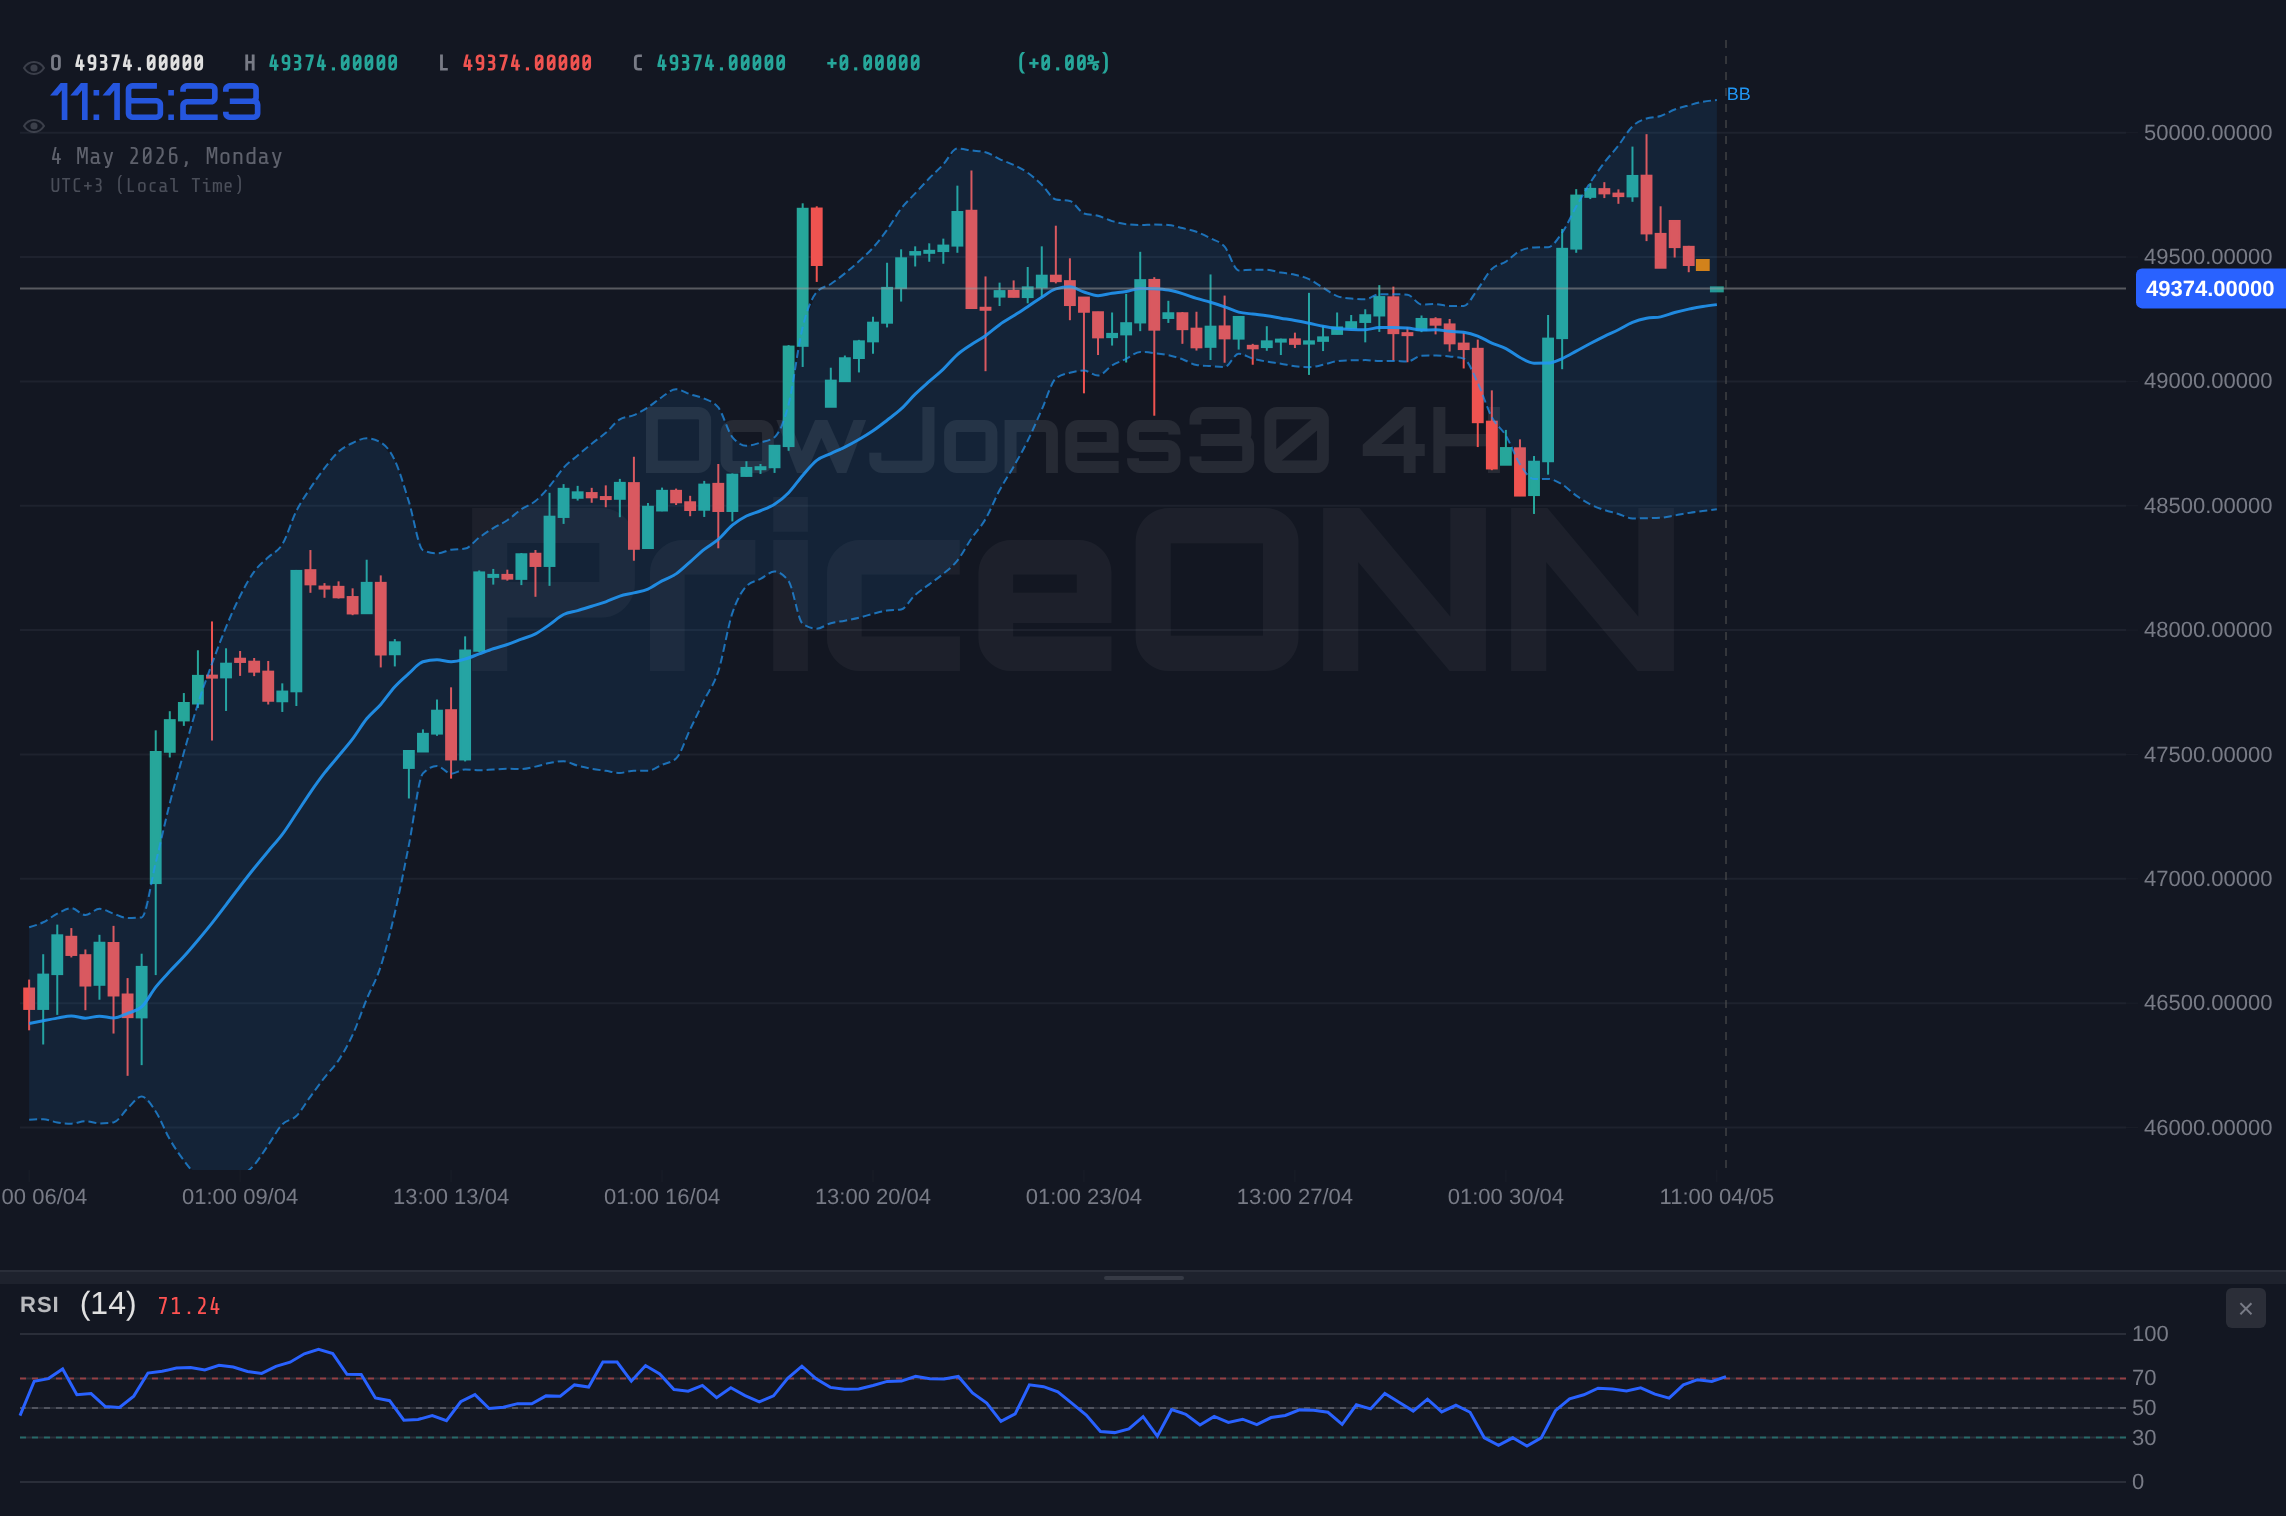
The MACD on the 1-hour chart also paints a picture of caution. It's showing negative momentum, with the MACD line below its signal line. This isn't an outright sell signal, but it does indicate that the buying pressure that propelled the index to these levels might be waning. For scalpers and day traders, this suggests that holding long positions through significant resistance without clear confirmation of a breakout could be risky. The Bollinger Bands, while showing the price above the middle band, are not indicating an explosive move; they suggest a steady, albeit potentially slowing, ascent. The key takeaway here is that the intraday setup is not screaming 'buy'; it's whispering 'be aware of resistance and potential consolidation'. The support level at $49,326.67 remains critical on this timeframe; a decisive break below it could signal a short-term pullback towards $49,289.33.
Key Level to Monitor: A close below $49,326.67 on the 1-hour chart could trigger a short-term sell-off, targeting $49,289.33. Conversely, a sustained break above $49,486.67 is needed to confirm bullish continuation.
The Bigger Picture: Daily Chart Perspective
Shifting our focus to the daily chart, the Dow Jones Industrial Average presents a more bullish narrative, though not without its caveats. At $49,454.50, the index is certainly in a strong uptrend. The daily RSI(14) at 67.84 is firmly in bullish territory, indicating healthy buying interest without being excessively overbought – a level that often precedes further upward movement rather than an immediate reversal. This contrasts with the intraday RSI's more neutral stance, highlighting the importance of considering multiple timeframes. The MACD on the daily chart is also showing positive momentum, with the MACD line above its signal line, reinforcing the bullish sentiment. This suggests that the longer-term trend remains intact and that the current push towards resistance is part of a broader upward move.
However, the ADX on the daily chart at 26.02 indicates a strong uptrend, reinforcing the bullish case. The Stochastic Oscillator, with %K at 85.1 and %D at 92.28, is showing a bearish divergence signal, having recently crossed over and heading downwards from overbought territory. This is the primary counter-argument to the purely bullish outlook from the daily RSI and MACD. It suggests that while the overall trend is up, the momentum might be starting to cool, and a period of consolidation or a minor pullback could be on the horizon before the index attempts to break through the significant resistance levels. The primary support on the daily chart lies at $49,246.67, with further key levels at $48,940 and $48,587. These are substantial buffers that would need to be breached for the bullish thesis to be invalidated on a longer timeframe.
Macroeconomic Currents and Geopolitical Crosswinds
The Dow Jones's performance cannot be viewed in isolation; it's deeply intertwined with broader macroeconomic trends and geopolitical developments. The Dollar Index (DXY) is currently trading at 98.33, showing a strengthening dollar. Historically, a rising DXY often exerts downward pressure on major currency pairs and can sometimes correlate with a cooling-off in risk assets like equities, although this relationship isn't always direct. The current DXY strength, supported by positive momentum signals on its 1-hour and 4-hour charts, suggests that global liquidity might be favoring the US dollar, potentially creating headwinds for riskier assets or those priced in other currencies. This makes the Dow Jones's resilience even more noteworthy.
On the equity front, the S&P 500 is trading at 6572.87, showing a 0.74% daily gain, and the Nasdaq 100 is up 1.44% at 26951.71. This broad-based strength in US equities provides a supportive backdrop for the Dow Jones. However, the daily RSI for the S&P 500 at 45.35 and Nasdaq at 75.83 (1-hour) and 75.67 (4-hour) show conflicting signals. The S&P 500's daily chart suggests room for further downside or consolidation, while the tech-heavy Nasdaq shows significant bullish momentum on shorter timeframes, albeit nearing overbought conditions on the 1-hour and 4-hour charts. This divergence within the equity market itself adds another layer of complexity. If the Nasdaq's bullish momentum falters, it could drag the Dow Jones lower, especially if the DXY continues its ascent.
Geopolitical tensions, particularly in the Middle East, continue to be a significant factor. Brent crude is trading at $102.36, up 2.21%, and WTI at $94.98, up 2.48%. Rising oil prices can fuel inflation concerns, which might influence central bank policy expectations. While the Federal Reserve's stance remains a key driver for US markets, the current data doesn't provide immediate clarity on their next move. Upcoming economic data releases, such as the employment figures and inflation reports, will be crucial in shaping Fed policy expectations and, consequently, market sentiment towards the Dow Jones. The market is currently pricing in a delicate balance, and any unexpected economic surprise could trigger a significant repricing of risk assets.
The narrative around interest rates is also a constant undercurrent. While the Fed's immediate policy path might seem stable, subtle shifts in market expectations, driven by inflation data or employment figures, can cause significant volatility. For instance, if upcoming inflation data comes in hotter than expected, it could reignite fears of delayed rate cuts, potentially pressuring risk assets like the Dow Jones. Conversely, weaker inflation or employment numbers might be interpreted as a sign of economic cooling, which could also lead to caution. The current ADX readings across different timeframes for the Dow Jones suggest that while there's an underlying upward trend, the market hasn't fully committed to a strong directional move yet, making it susceptible to shifts in macroeconomic sentiment.
Trading Scenarios: What Could Happen Next?
Given the current technical setup and macroeconomic backdrop, several scenarios could unfold for the Dow Jones Industrial Average. The interplay between intraday caution and daily bullishness, coupled with external factors like DXY strength and oil prices, creates a complex trading environment. It's crucial to have a plan for each potential outcome.
Bearish Reversal: The Resistance Holds Firm
35% ProbabilityConsolidation Phase: Sideways Action Prevails
40% ProbabilityBullish Breakout: Resistance Shattered
25% ProbabilityThe probability assigned to each scenario reflects the current technical indicators and the broader market context. The consolidation scenario holds the highest probability because the conflicting signals across timeframes and the proximity to key resistance suggest indecision. However, a breakout scenario, though less probable currently, cannot be dismissed, especially if driven by strong economic data or a shift in risk sentiment. The bearish scenario becomes more likely if the index fails to hold its immediate support levels or if macroeconomic headwinds intensify. Risk management is paramount in such a choppy environment; traders should be prepared for any of these outcomes by having defined entry, exit, and invalidation points.
Frequently Asked Questions: Dow Jones Analysis
What happens if the Dow Jones breaks above the $49,486.67 resistance level?
A sustained break above $49,486.67, confirmed by increased volume, would invalidate the current consolidation and likely target the daily resistance level at $49,747.00. This bullish scenario would be supported by positive macroeconomic news or a shift in risk sentiment.
Should I buy the Dow Jones at current levels of $49,454.50 given the conflicting RSI signals?
Buying at current levels requires caution due to conflicting RSI signals (1-hour at 52.34 vs. 1-day at 67.84) and proximity to resistance. A higher-probability entry would be on a confirmed breakout above $49,486.67 or a pullback to support near $49,326.67, depending on your risk tolerance.
Is the Stochastic Oscillator's bearish divergence at 85.1/92.28 a sell signal for the Dow Jones?
The Stochastic Oscillator showing bearish divergence from overbought levels (K=85.1, D=92.28) on the daily chart suggests that upward momentum may be waning. While not an immediate sell signal on its own, it indicates a higher probability of consolidation or a pullback before the uptrend can resume.
How will upcoming US economic data affect the Dow Jones around $49,454.50 this week?
Upcoming data releases, particularly inflation and employment figures, will be critical. Stronger-than-expected data could strengthen the dollar and pressure the Dow Jones, while weaker data might support a Fed pivot narrative, potentially boosting the index. Watch for reactions around the key support level of $49,326.67.
The path forward for the Dow Jones Industrial Average hinges on its ability to overcome immediate resistance at $49,454.50 and navigate the complex web of technical signals and macroeconomic influences. While the daily trend remains bullish, the intraday picture and certain indicators like the Stochastic Oscillator suggest that a period of consolidation or a minor pullback is a distinct possibility. Traders must remain vigilant, respect the key support and resistance levels, and be prepared to adapt their strategies as new information emerges. Patience and disciplined risk management will be the keys to successfully navigating this critical juncture in the market.
Track markets in real-time
AI-powered analysis, technical indicators and real-time price data.
Join Our Telegram Channel
Breaking market news, AI analysis and trading signals instantly.
Join Channel