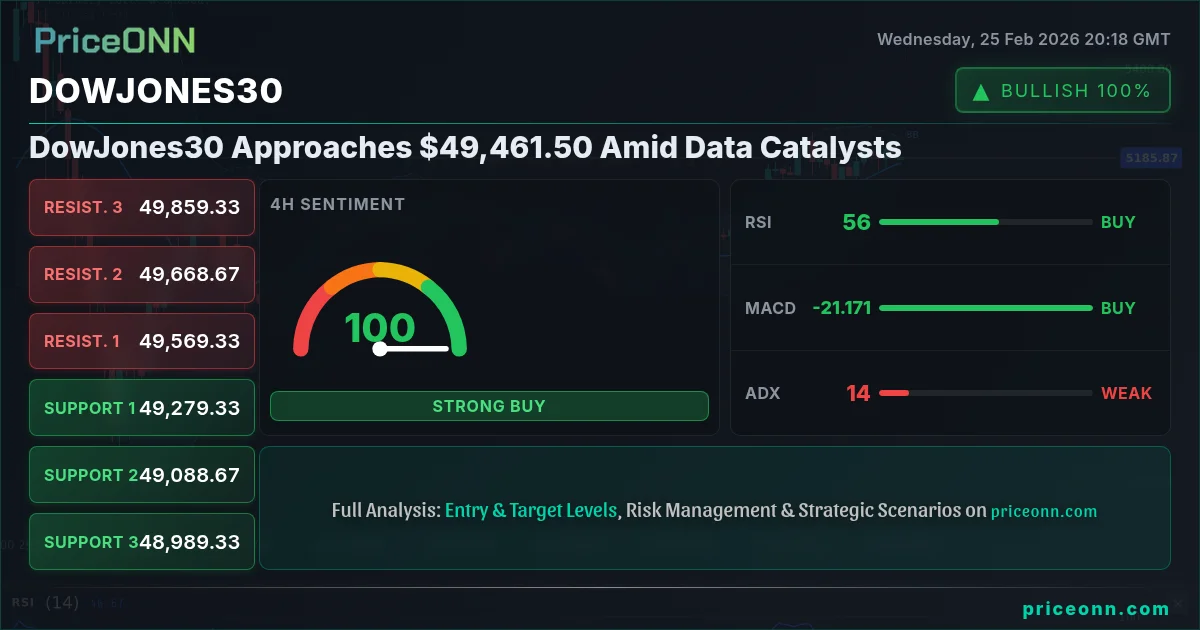
The Dow Jones Industrial Average (DowJones30) is currently hovering around $49,461.50, reflecting a delicate balance between bullish momentum and potential headwinds. As traders digest recent economic data and anticipate upcoming releases, a clear direction remains elusive. This analysis delves into the technical landscape, dissecting key indicators and price levels to provide a comprehensive outlook for the DowJones30.
- RSI at 69.18 suggests potential for overbought conditions in the short term.
- Key support level identified at 49,414, tested multiple times in the last hour.
- MACD histogram indicates positive momentum, supporting the current bullish trend.
- Anticipation of upcoming USD economic data is driving DowJones30 volatility.
Technical Overview
On the 1-hour chart, the DowJones30 exhibits a strong bullish trend, with an ADX of 25.77 confirming the trend's strength. However, the RSI at 69.18 is nearing overbought territory, suggesting that the upward momentum may be losing steam. The Stochastic oscillator, with K=90.58 and D=76.19, further reinforces the overbought signal, indicating a potential pullback in the near term. It's important to note that the MACD histogram remains positive, signaling continued bullish sentiment, but traders should be wary of a potential reversal given the overbought conditions.
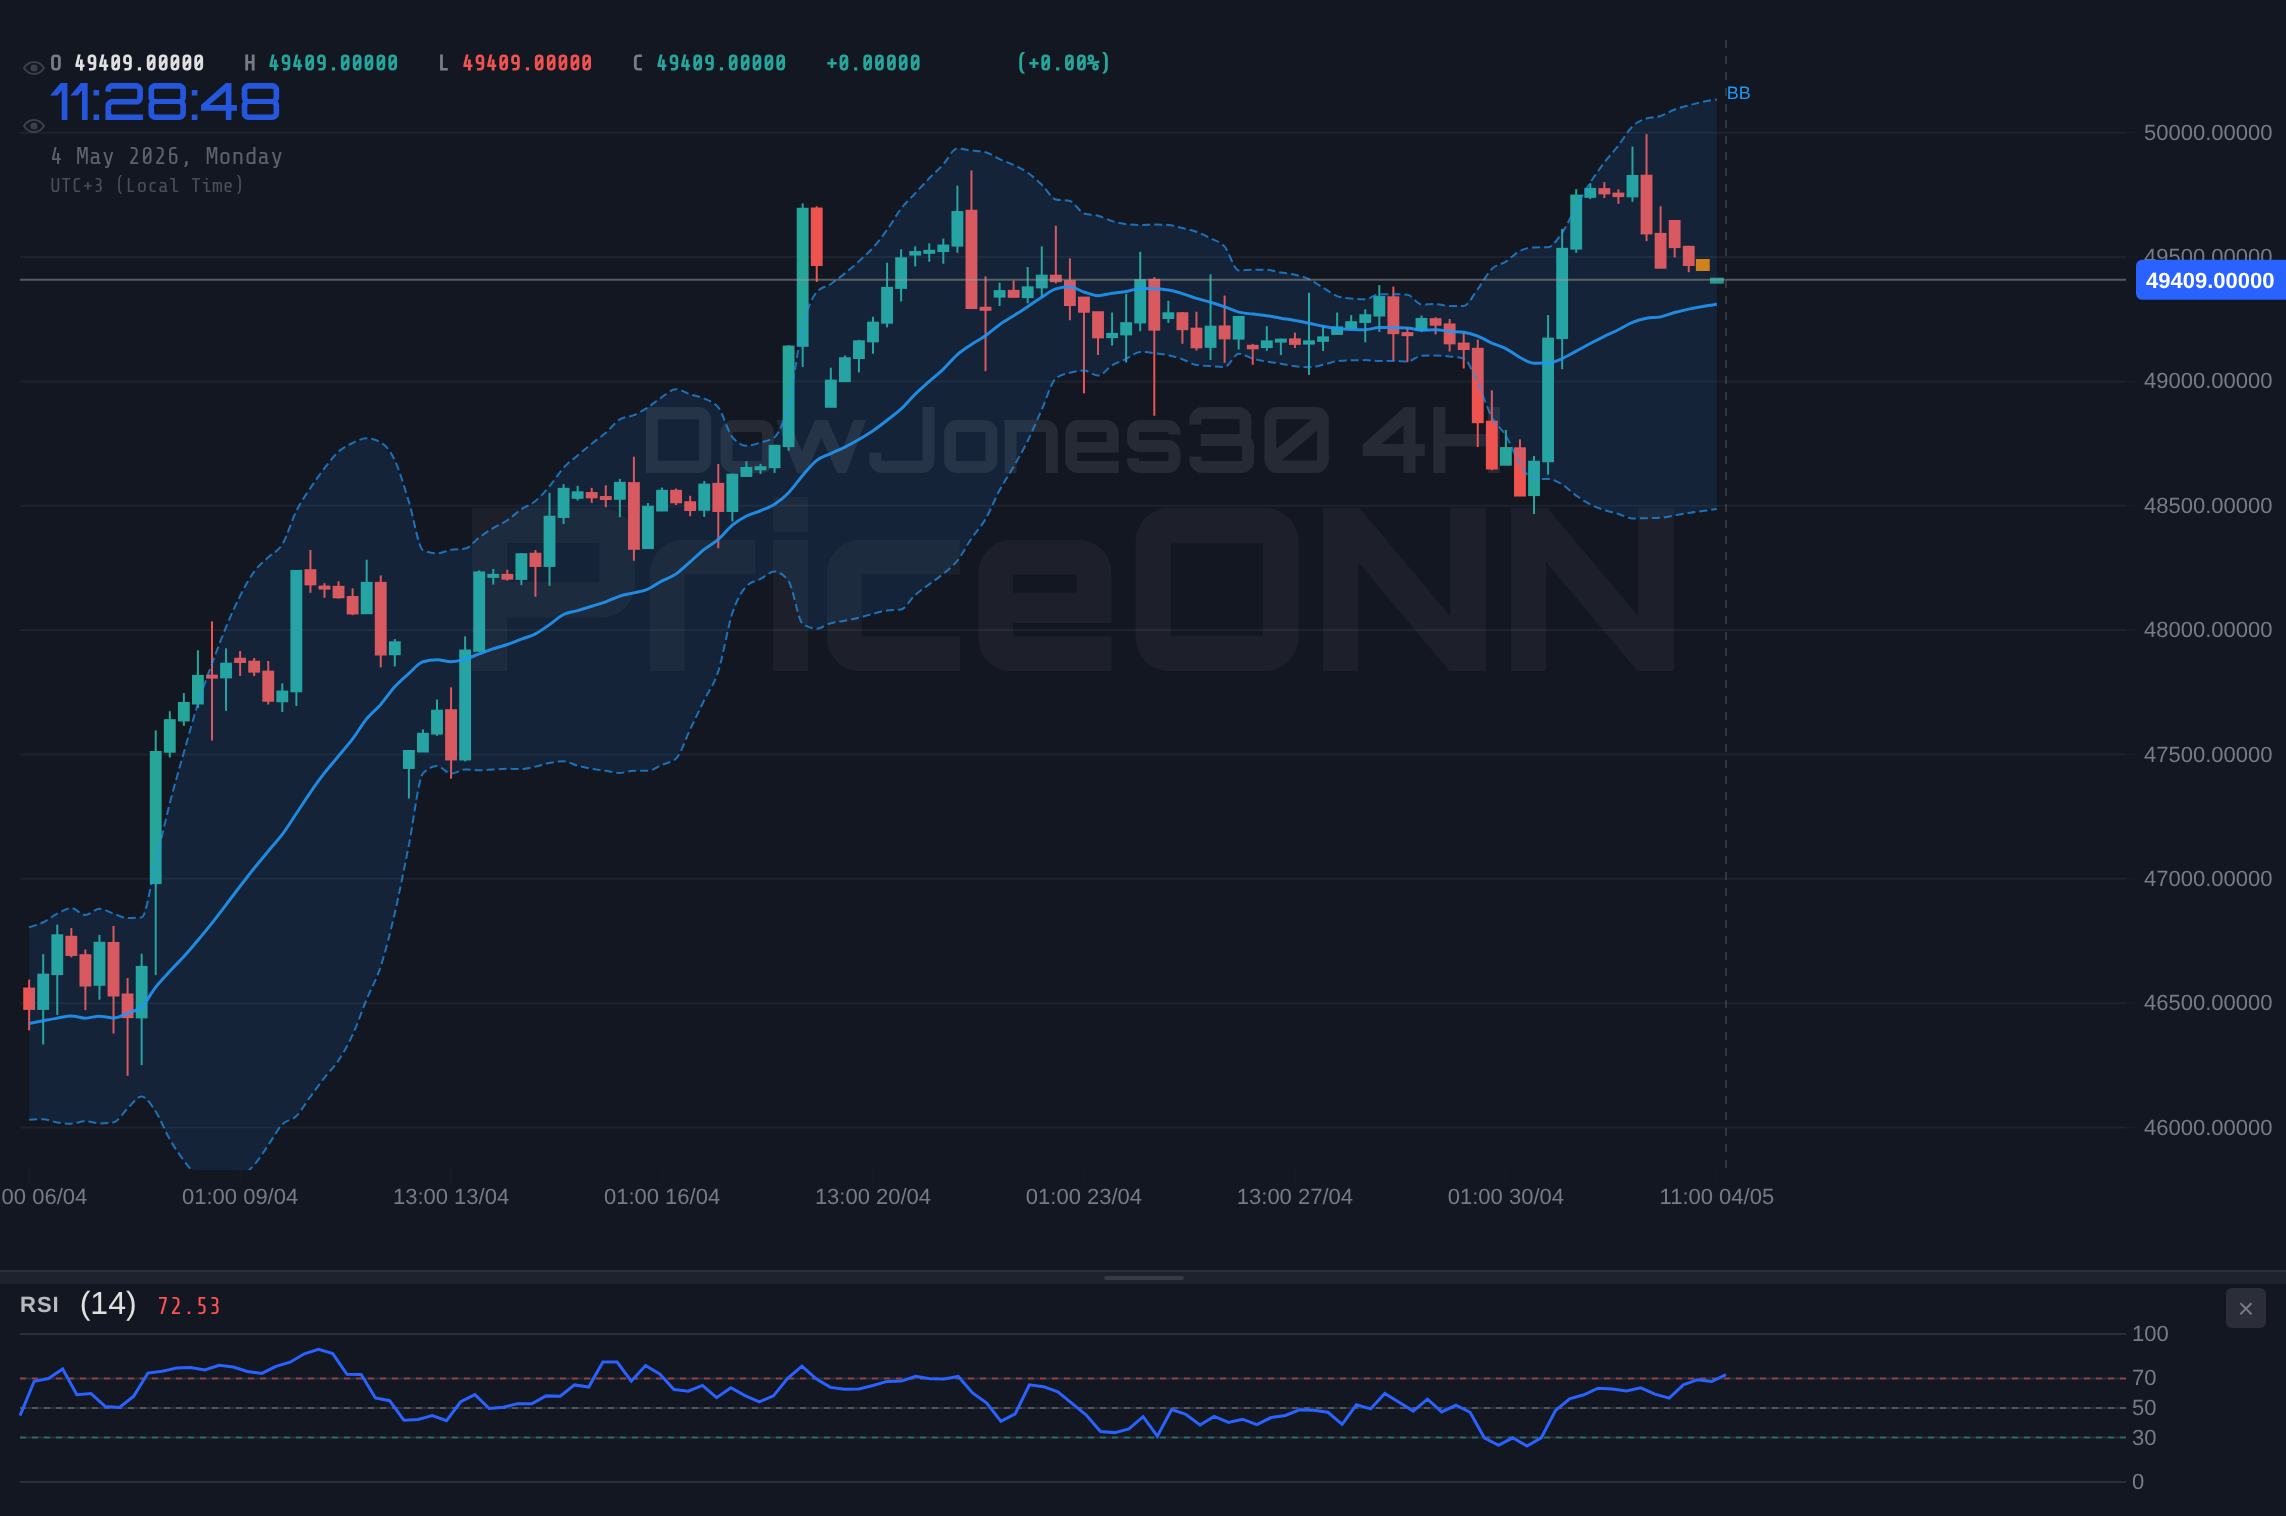
Zooming out to the 4-hour timeframe, the trend shifts to neutral, highlighting the market's indecisiveness. The ADX drops to 13.76, indicating a weak trend and sideways movement. The RSI at 56.69 resides in neutral territory, providing no clear directional bias. The Stochastic oscillator, however, remains elevated with K=96.52 and D=67.66, suggesting that the market may be poised for a correction. The MACD continues to show positive momentum, creating a mixed signal that requires careful interpretation. The index is struggling to break above the $49,475 resistance level.
The daily chart paints a similar picture of neutrality, with the ADX at 15.17 confirming the absence of a strong trend. The RSI at 51.95 is also neutral, providing no clear directional guidance. Interestingly, the Stochastic oscillator displays a bearish signal, with K=31.5 and D=34.12, hinting at potential downside pressure. The MACD histogram, while negative, is showing signs of convergence, suggesting that the bearish momentum may be waning. The overall signal is mixed, requiring traders to exercise caution and await further confirmation before committing to a directional trade.
Key Price Levels to Watch
Identifying key support and resistance levels is crucial for navigating the DowJones30's current market conditions. On the hourly chart, immediate support can be found at 49,414, followed by 49,390 and 49,353. These levels could act as potential bounce zones for the index. On the upside, immediate resistance lies at 49,475, followed by 49,512 and 49,536. A breakout above these resistance levels could pave the way for further gains.
On the 4-hour chart, key support levels are located at 49,259.33, 49,164.67 and 49,113.33. These levels represent significant areas of demand that could provide strong support for the index. On the resistance side, critical levels are found at 49,405.33, 49,456.67 and 49,551.33. A sustained break above these levels would signal a potential shift in market sentiment and could trigger a more significant rally.
The daily chart reveals broader support levels at 48,833, 48,522 and 48,295. These levels represent long-term areas of demand that could provide substantial support for the index. On the upside, key resistance levels are situated at 49,371, 49,598 and 49,909. A decisive break above these levels would indicate a strong bullish trend and could lead to a sustained upward move. Keep in mind that these levels are dynamic and may shift as new data emerges.
Economic Data and Market Impact
The DowJones30's price action is currently influenced by expectations surrounding upcoming economic data releases. According to the economic calendar, several high-impact events are on the horizon, including USD data. These releases have the potential to significantly impact market sentiment and volatility.
Recent USD data with an actual of 91.2 versus a forecast of 87.4, exceeding expectations, typically strengthens the dollar, potentially weighing on the DowJones30. Traders are also closely watching for upcoming USD data, which is expected to provide further clues about the Federal Reserve's monetary policy outlook. A stronger-than-expected number could reinforce expectations for further interest rate hikes, potentially dampening investor sentiment and putting downward pressure on the index.
EUR data is expected to remain stable, with forecasts aligning with previous figures. However, any surprises in these releases could trigger significant market movements. Traders should also pay close attention to geopolitical developments, as these events can also have a significant impact on market sentiment and the DowJones30's price action. Any escalation of tensions could lead to increased risk aversion, potentially driving investors towards safe-haven assets and away from equities.
Correlation Analysis
The DowJones30's price action is closely correlated with other financial instruments, providing valuable insights for traders. The DXY (Dollar Index) currently sits at 97.37, a slight decrease of -0.21%. A weaker dollar typically provides a tailwind for the DowJones30, as it makes U.S. exports more competitive and boosts corporate earnings. Conversely, a stronger dollar tends to weigh on the index. With DXY at 97.37, the DowJones30 is receiving a slight boost.
The SP500, currently trading at 6946.55, exhibits a strong positive correlation with the DowJones30. A rising SP500 typically indicates improving risk appetite and positive market sentiment, which tends to support the DowJones30. However, it is important to note that this correlation is not always perfect, and divergences can occur due to sector-specific factors or idiosyncratic events. The Nasdaq100, currently at 25318.25, also shows a positive correlation with the DowJones30, reflecting the overall health of the technology sector and its impact on the broader market. The price of Brent crude oil is $65.73, and WTI is $65.84. Rising oil prices can signify inflation which can affect the Dow.
Risk Management Considerations
Given the mixed technical signals and the potential for volatility stemming from upcoming economic data releases, prudent risk management is essential. Traders should carefully assess their risk tolerance and adjust their position sizes accordingly. Setting appropriate stop-loss orders is crucial for limiting potential losses in the event of adverse market movements. It is also advisable to diversify portfolios across different asset classes to mitigate the impact of any single investment. The market is choppy, so be cautious when trading.
Frequently Asked Questions: DowJones30 Analysis
Is DowJones30 a good buy right now?
Given the neutral trend and mixed signals, it's prudent to wait for more confirmation before buying. Watch for a break above 49,475 with strong volume. The current price is $49,461.50.
What is the DowJones30 price forecast for this week?
The forecast for this week is cautiously optimistic, with a potential target of 49,598 if bullish momentum sustains. However, failure to hold above 49,414 could lead to a test of 48,833.
What are the key support and resistance levels for DowJones30?
Key support levels are at 49,414, 49,390 and 49,353. Key resistance levels are at 49,475, 49,512 and 49,536. These levels are based on the 1-hour chart.
Why is DowJones30 moving today?
DowJones30 is moving today due to anticipation of upcoming economic data releases and overall market sentiment. The current bullish trend is also supported by the positive momentum.
Technical Outlook Summary
| Indicator | Value | Signal |
|---|---|---|
| RSI (14) | 69.18 | Watch |
| MACD Histogram | Positive | Bullish |
| Stochastic | K=90.58, D=76.19 | Overbought |
| ADX | 25.77 | Strong Trend |
| Bollinger | Upper Band | Watch |
Key Levels
Support Levels
Resistance Levels
Track markets in real-time
AI-powered analysis, technical indicators and real-time price data.
Join Our Telegram Channel
Breaking market news, AI analysis and trading signals instantly.
Join Channel