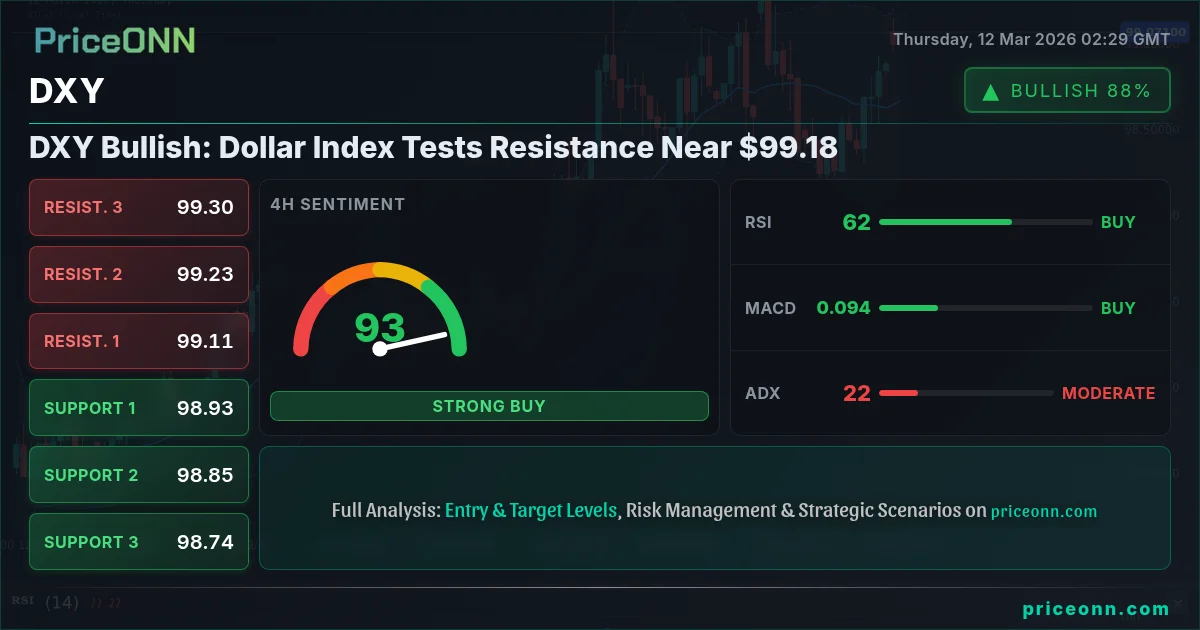
The Dollar Index (DXY) finds itself at a critical juncture, testing resistance near $99.18 as bulls and bears engage in a tug-of-war. The outcome of this battle will likely dictate the short-term trajectory of the dollar and have ripple effects across various asset classes, including gold, equities, and forex pairs. The market is closely watching, trying to decipher whether this resistance will hold, leading to a pullback, or if a breakout is imminent, signaling further dollar strength.
- RSI at 72.68 on the 1H chart indicates overbought conditions, suggesting potential for a short-term pullback.
- Critical resistance lies at $99.12, a level that needs to be decisively broken for further upside.
- MACD histogram shows positive momentum on the 1H chart, supporting the bullish case.
- Geopolitical tensions and upcoming USD data releases are key drivers influencing DXY's direction.
The Bull Case for DXY: Momentum and Safe Haven Demand
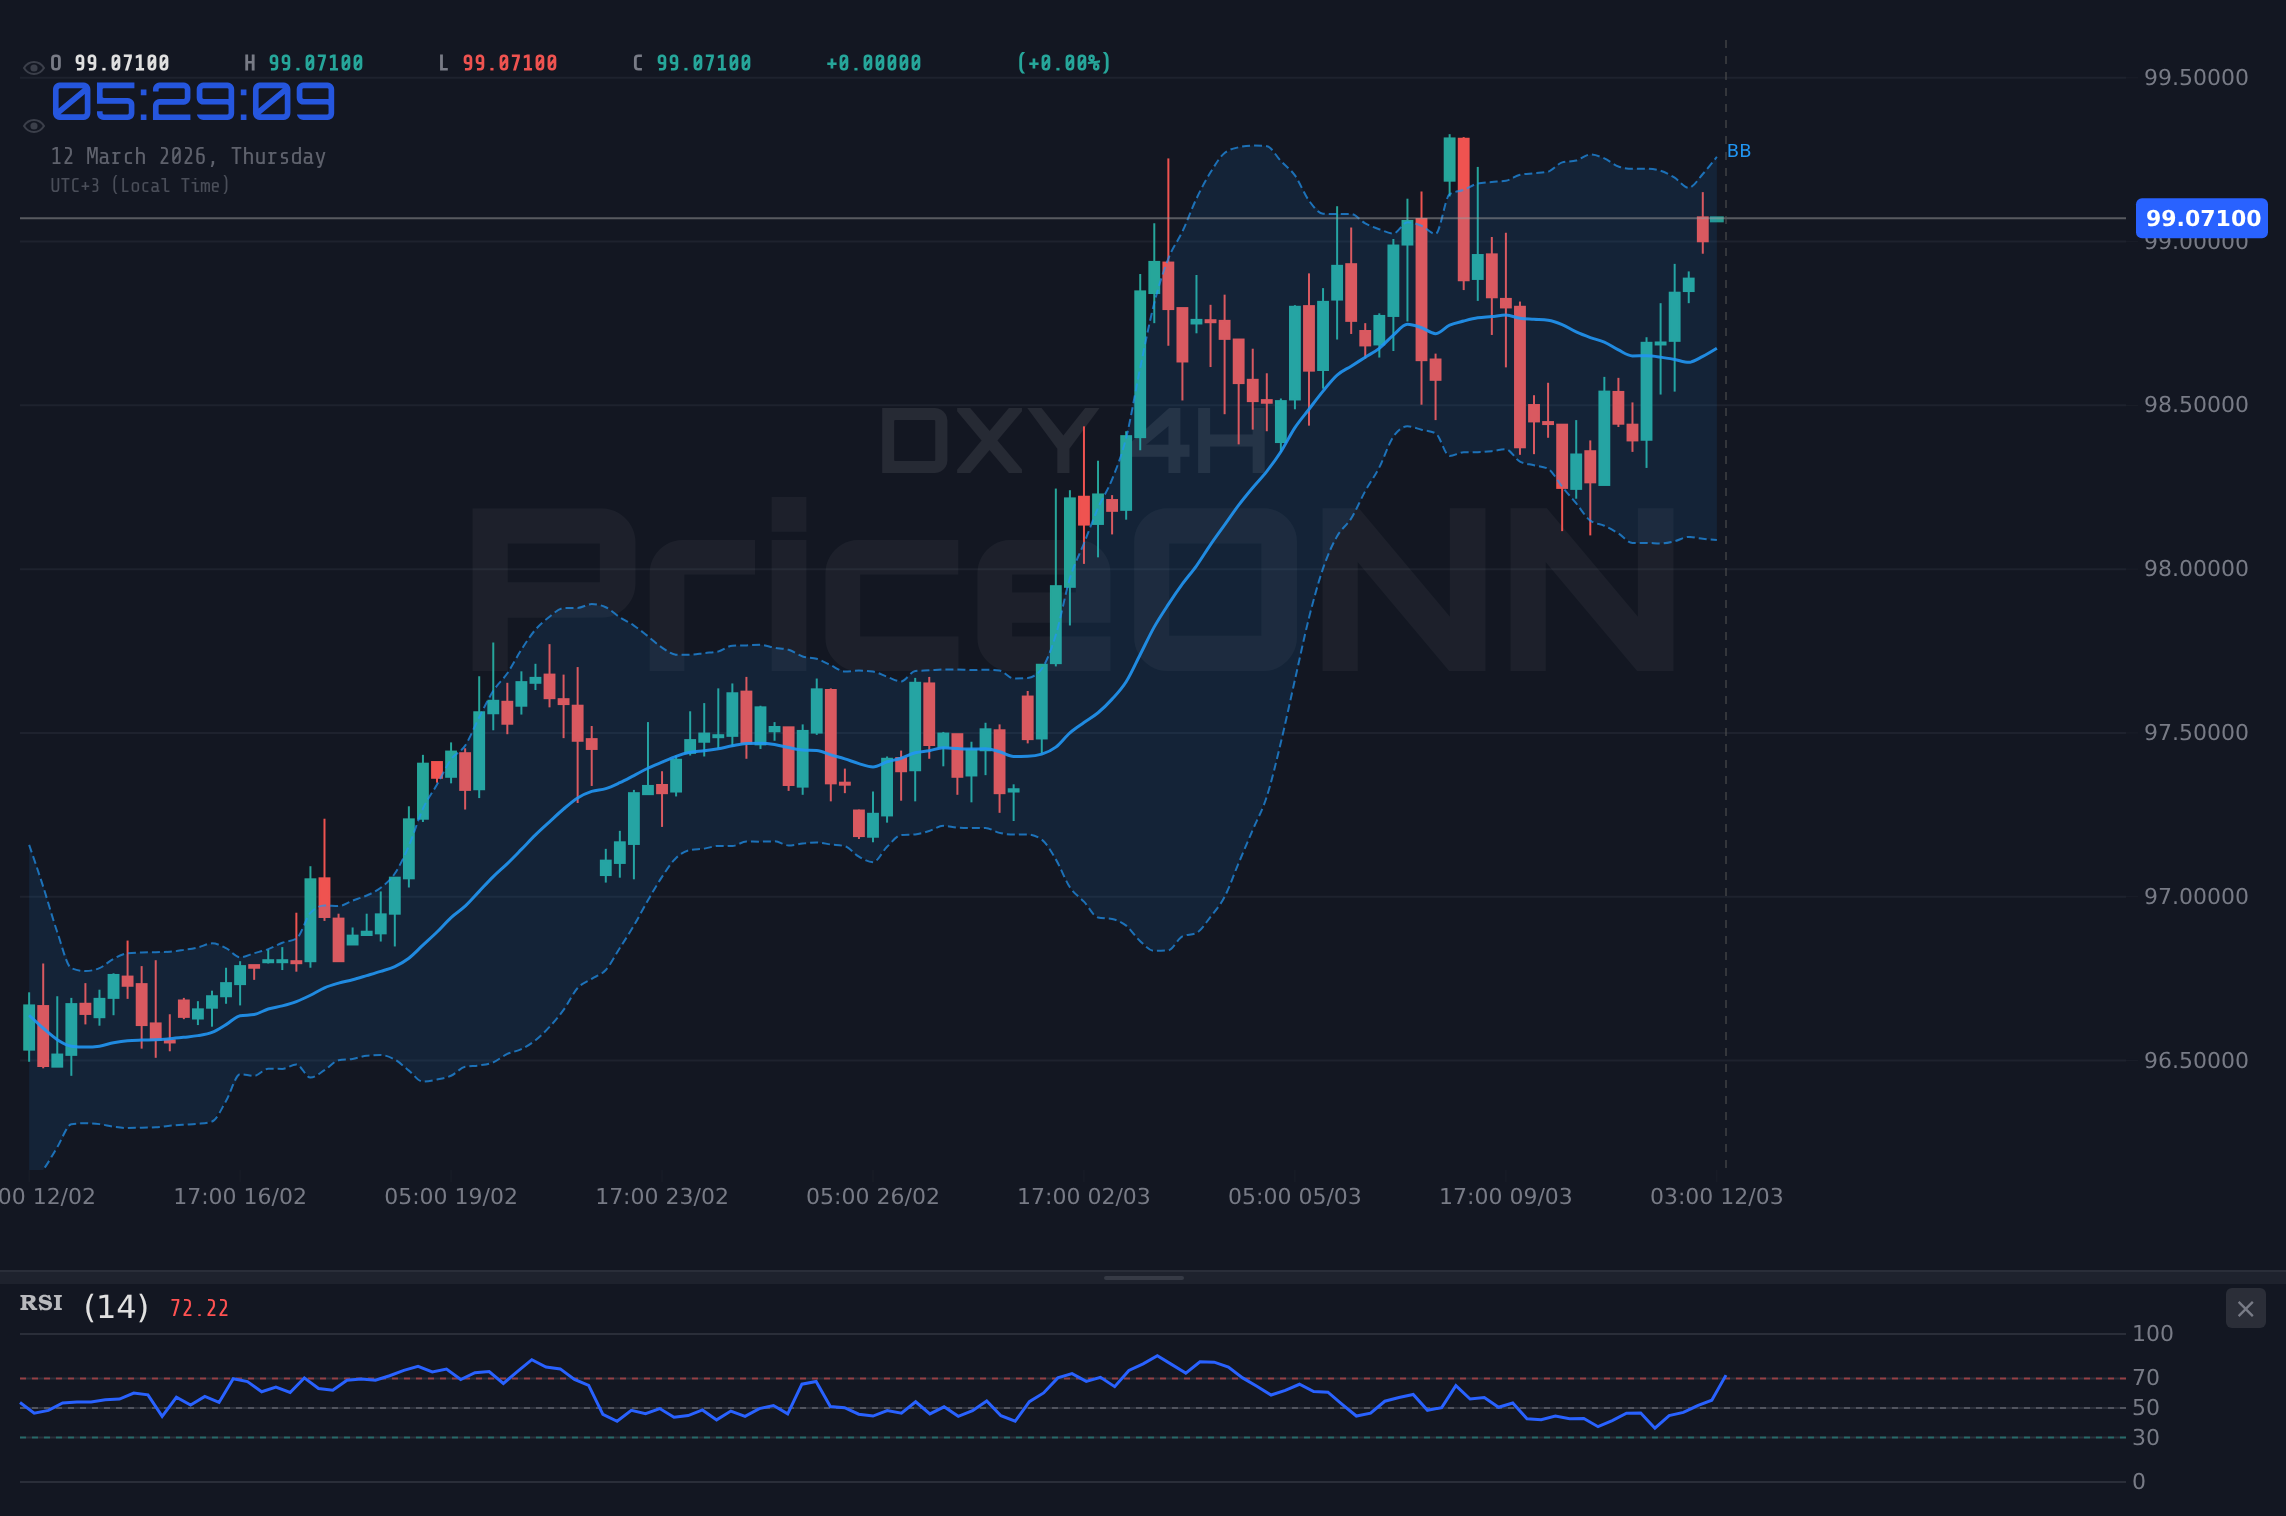
The bullish argument for the DXY hinges on several factors. Firstly, the overall trend across multiple timeframes (4H and 1D) is still pointing upwards, indicating underlying strength. The DXY is currently trading at $99.18 and has shown resilience despite some recent volatility. The 4H chart shows a strong uptrend with an ADX of 21.13, suggesting that the bullish momentum is still in play. Furthermore, the RSI on the 4H chart is at 63.01, indicating that there is still room for further upside before the DXY reaches overbought territory. This bullish momentum is further supported by the positive MACD histogram on the 4H chart, which suggests that the buying pressure is still strong.
Secondly, geopolitical tensions, particularly those involving Iran and their potential impact on Eurozone stability, are fueling safe-haven demand for the dollar. As highlighted in recent news, crude oil is eyeing the $90 mark due to these tensions, which in turn stokes inflation fears. This environment tends to favor the dollar as investors seek a safe store of value. With the SP500 showing a daily change of -1.12%, and the Nasdaq100 showing a daily change of -0.98%, the risk-off sentiment is palpable, further supporting the dollar's appeal as a safe haven.
The Bear Case for DXY: Overbought Signals and Economic Uncertainty
Despite the bullish arguments, there are also compelling reasons to be cautious. The DXY's 1H chart shows an RSI reading of 72.68, indicating overbought conditions. This suggests that the recent rally may be overextended and a pullback is likely. The Stochastic oscillator on the 1H chart, with K=90.13 and D=83.29, further reinforces this overbought signal, suggesting that the DXY is due for a correction. This is where patience becomes key; waiting for a confirmed reversal pattern before initiating short positions can be a prudent strategy.
Furthermore, upcoming USD data releases, specifically the GBP data release on March 13th, introduce an element of uncertainty. While previous data may have been supportive, any negative surprises could trigger a sharp reversal in the DXY. Traders should also be mindful of comments from ECB officials regarding inflation risks, as highlighted in recent news. Any hawkish signals from the ECB could weaken the dollar and strengthen the euro, putting downward pressure on the DXY. The EUR/USD is currently trading at 1.1545, and any significant move above this level could signal a weakening dollar.
Technicals as the Tiebreaker: A Multi-Timeframe Analysis
To gain a clearer picture of the DXY's likely trajectory, a multi-timeframe analysis is essential. On the 1H chart, the DXY is facing immediate resistance at 99.12. A decisive break above this level could pave the way for further gains towards 99.21 and 99.26. However, the overbought RSI and Stochastic readings suggest that this breakout may be short-lived. Support on the 1H chart lies at 98.99, 98.93, and 98.85. A break below 98.99 could signal a deeper pullback towards the 98.80 level. On the 4H chart, the DXY is currently trading above its middle Bollinger Band, indicating a bullish trend. However, the Stochastic oscillator, with K=94.65 and D=74.51, is nearing overbought territory, suggesting that the upside potential may be limited.
Looking at the daily chart, the DXY is trading above its middle Bollinger Band, confirming the overall bullish trend. However, the RSI at 67.17 is approaching overbought territory, suggesting that the rally may be losing steam. Key resistance on the daily chart lies at 98.72, 98.89, and 99.2. Support on the daily chart lies at 98.23, 97.93, and 97.75. The ADX on the daily chart is at 26.27, indicating a strong uptrend, but the Stochastic oscillator, with K=70.73 and D=69.59, is signaling a potential pullback.
Correlation Analysis: DXY's Impact on Other Markets
Understanding the DXY's correlation with other markets is crucial for traders. As the DXY strengthens, gold (XAUUSD) typically comes under pressure. Currently, gold is trading at $5,171.03, showing a daily change of -0.42%. The strengthening dollar, driven by geopolitical tensions and safe-haven demand, is likely weighing on gold prices. A further rise in the DXY could push gold towards its support levels at $5,131.84, $5,111.01, and $5,096.31. The inverse relationship between the DXY and EUR/USD is also worth noting. As the DXY rises, the EUR/USD tends to fall. The EUR/USD is currently trading at 1.1545, and a further strengthening of the dollar could push the EUR/USD towards its support levels at 1.15358, 1.15264, and 1.15197.
The DXY also has an indirect impact on equities. A stronger dollar can weigh on the earnings of US companies that generate a significant portion of their revenue from overseas. With the SP500 showing a daily change of -1.12% and the Nasdaq100 showing a daily change of -0.98%, the strengthening dollar could exacerbate the downward pressure on equities. Finally, oil prices tend to be inversely correlated with the dollar. As the DXY rises, oil prices tend to fall. However, in the current environment, geopolitical tensions are overriding this inverse relationship, with oil prices rising despite the strengthening dollar. WTI crude oil is currently trading at $93.6, showing a daily change of 8.46%.
Trade Plan: DXY Breakout or Pullback?
Based on the technical and fundamental analysis, here's a potential trade plan for the DXY:
The DXY breaks above $99.12 resistance, confirming the bullish trend. The next targets are $99.21 and $99.26. This scenario is likely if upcoming USD data releases are positive and geopolitical tensions remain elevated.
The DXY fails to break above $99.12 and pulls back towards support at $98.99. A break below $98.99 could trigger a deeper correction towards $98.93 and $98.85. This scenario is likely if upcoming USD data releases are negative or geopolitical tensions ease.
What Scalpers, Swing Traders, and Long-Term Investors Should Watch
Different types of traders will approach the DXY's current situation with varying strategies. Scalpers, who focus on short-term price movements, will be closely monitoring the 1H chart for breakout and breakdown opportunities. The key levels to watch are the resistance at 99.12 and the support at 98.99. Swing traders, who hold positions for several days or weeks, will be more interested in the 4H and daily charts. They will be looking for confirmation of the overall bullish trend before initiating long positions. Long-term investors, who hold positions for months or years, will be focusing on the fundamental drivers of the DXY, such as central bank policies, economic growth, and geopolitical risks. They will be looking for opportunities to accumulate the dollar at attractive levels.
For scalpers, the immediate focus is on the $99.12 level. A quick break above this level, confirmed by a surge in volume, could present a short-term buying opportunity. However, scalpers should be mindful of the overbought RSI and Stochastic readings on the 1H chart, which suggest that the upside potential may be limited. Swing traders should wait for a confirmed breakout above $99.12 on the 4H chart before initiating long positions. They should also be aware of the upcoming USD data releases, which could trigger significant volatility. Long-term investors should focus on the fundamental drivers of the DXY and look for opportunities to accumulate the dollar at attractive levels. They should also be prepared for periods of volatility and be patient in their approach.
Historical Perspective: DXY at This Level Before
Looking back at the DXY's historical performance when trading around the $99 level, patterns emerge. Previous instances have often been characterized by periods of consolidation followed by decisive breakouts or breakdowns. For example, in early 2025, the DXY consolidated around the $99 level for several weeks before breaking out to the upside, fueled by hawkish comments from the Federal Reserve. Similarly, in late 2024, the DXY consolidated around the $99 level before breaking down to the downside, triggered by dovish comments from the European Central Bank. These historical patterns highlight the importance of monitoring central bank policies and economic data releases when trading the DXY.
Frequently Asked Questions: DXY Analysis
What happens if DXY breaks above $99.12 resistance?
A decisive break above $99.12 could pave the way for further gains towards $99.21 and $99.26, confirming the bullish trend. However, the overbought RSI and Stochastic readings on the 1H chart suggest that this breakout may be short-lived.
Should I buy DXY at current levels of $99.18 given the RSI at 72.68?
The high RSI suggests caution, as the DXY may be overbought in the short term. Waiting for a pullback towards support at $98.99 or a confirmed breakout above $99.12 could be a more prudent approach.
Is the positive MACD histogram on the 1H chart a reliable buy signal for DXY?
While the positive MACD histogram supports the bullish case, it should be used in conjunction with other indicators. The overbought RSI and Stochastic readings suggest that the upside potential may be limited, so confirmation is needed.
How will the upcoming GBP data release on March 13th affect DXY this week?
A positive GBP data release could weaken the dollar and put downward pressure on the DXY, while a negative release could strengthen the dollar and support the DXY's bullish trend. Traders should monitor the data closely.
Technical Outlook Summary
| Indicator | Value | Signal |
|---|---|---|
| RSI (14) | 72.68 (1H) | Overbought |
| MACD Histogram | Positive (1H) | Bullish |
| Stochastic | 90.13/83.29 (1H) | Overbought |
| ADX | 26.27 (1D) | Strong Uptrend |
| Bollinger | Upper Band (1H) | Watch |
Key Levels
Support Levels
Resistance Levels
Track markets in real-time
AI-powered analysis, technical indicators and real-time price data.
Join Our Telegram Channel
Breaking market news, AI analysis and trading signals instantly.
Join Channel