

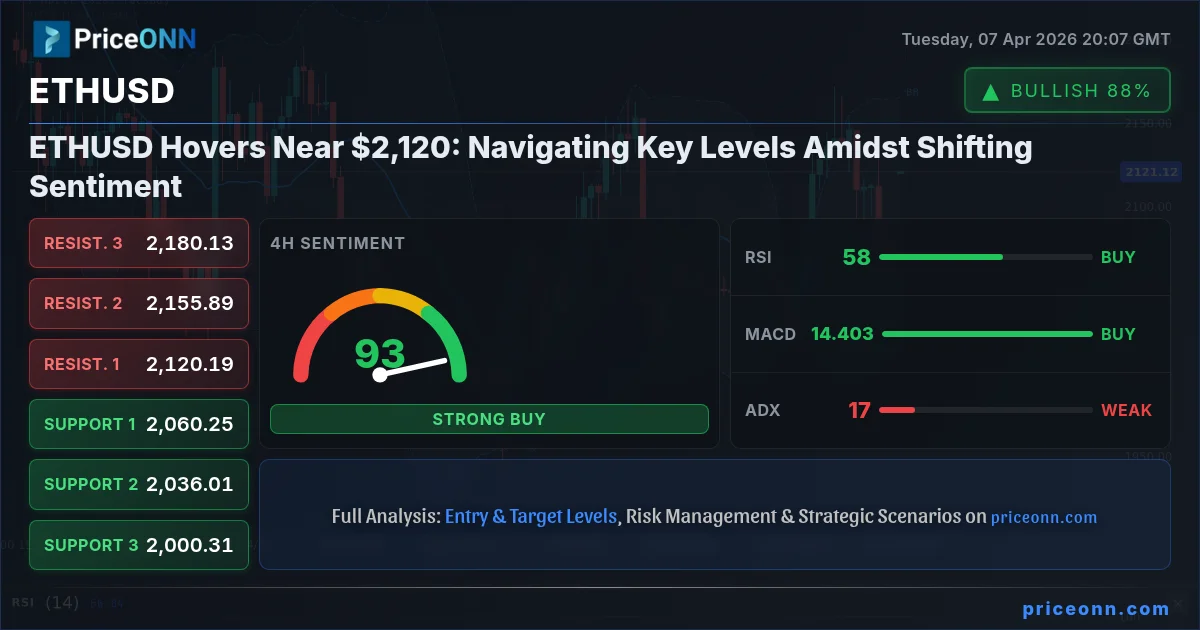
Alright, let's cut to the chase. Ethereum (ETHUSD) is currently sitting at $2,120.09, and frankly, the chart is painting a picture of indecision right now. We're seeing a delicate balance between bullish momentum on shorter timeframes and a more cautious, almost bearish, undertone on the daily. This isn't a clear 'buy the dip' or 'sell the rally' scenario; it’s a WATCH_ZONE. The market is waiting for a catalyst, a definitive break in one direction or the other, before committing. Having tracked ETHUSD through various market cycles, this kind of consolidation often precedes a significant move, but the question is, which way will it break?
- Ethereum's RSI is hovering around 57.32 on the 4H chart, signaling neutral momentum with a slight upward bias, but caution is advised as it approaches overbought territory on shorter frames.
- Critical support for ETHUSD sits at $2,060.25, a level that has held multiple times on the 4H chart; a break below this could signal a deeper correction.
- The MACD histogram shows mixed signals, positive on the 1H but negative on the 4H, indicating a lack of strong directional conviction from momentum indicators.
- The correlation with the US Dollar Index (DXY), currently at 99.42, is a key factor; a strengthening dollar typically exerts downward pressure on crypto assets like ETH.
The Tightrope Walk: ETHUSD Between Support and Resistance
Ethereum's current price action around $2,120.09 is a classic example of market participants grappling with conflicting signals. On the 1-hour timeframe, the sentiment appears cautiously optimistic. The trend is strong (88% power), the ADX at 18.49 suggests a nascent trend is trying to form, and the overall signal leans towards 'BUY' with 8 out of 8 indicators suggesting upward movement. The RSI(14) at 59.6 is in neutral territory but trending up, and the Stochastic (%K=70.89, %D=35.99) clearly shows a bullish crossover. This shorter-term bullishness is tempting, suggesting that dips might be bought aggressively in the immediate hours.
However, as we zoom out to the 4-hour and daily charts, the picture becomes far more nuanced, even leaning bearish. The 1D ADX at 43.76 indicates a strong downtrend is in play, despite the weaker ADX readings on shorter timeframes. The daily RSI sits at 52.03, which is neutral but showing a downward eğilim. More critically, the MACD on the daily chart is positive but its histogram is showing waning momentum. The 1D Stochastic, while showing a bullish crossover (%K=78.26, %D=50.61), is rapidly approaching overbought conditions, which historically on the daily chart has sometimes preceded a pullback. The overall signal on the daily is still 'BUY' (7 out of 8), but the strength of the trend readings (ADX 43.76) suggests that the current price action might be a temporary pause within a larger bearish structure, or perhaps the beginning of a significant reversal. This conflict is precisely why we're in a 'WATCH_ZONE'.
Decoding the Indicators: A Tale of Two Timeframes
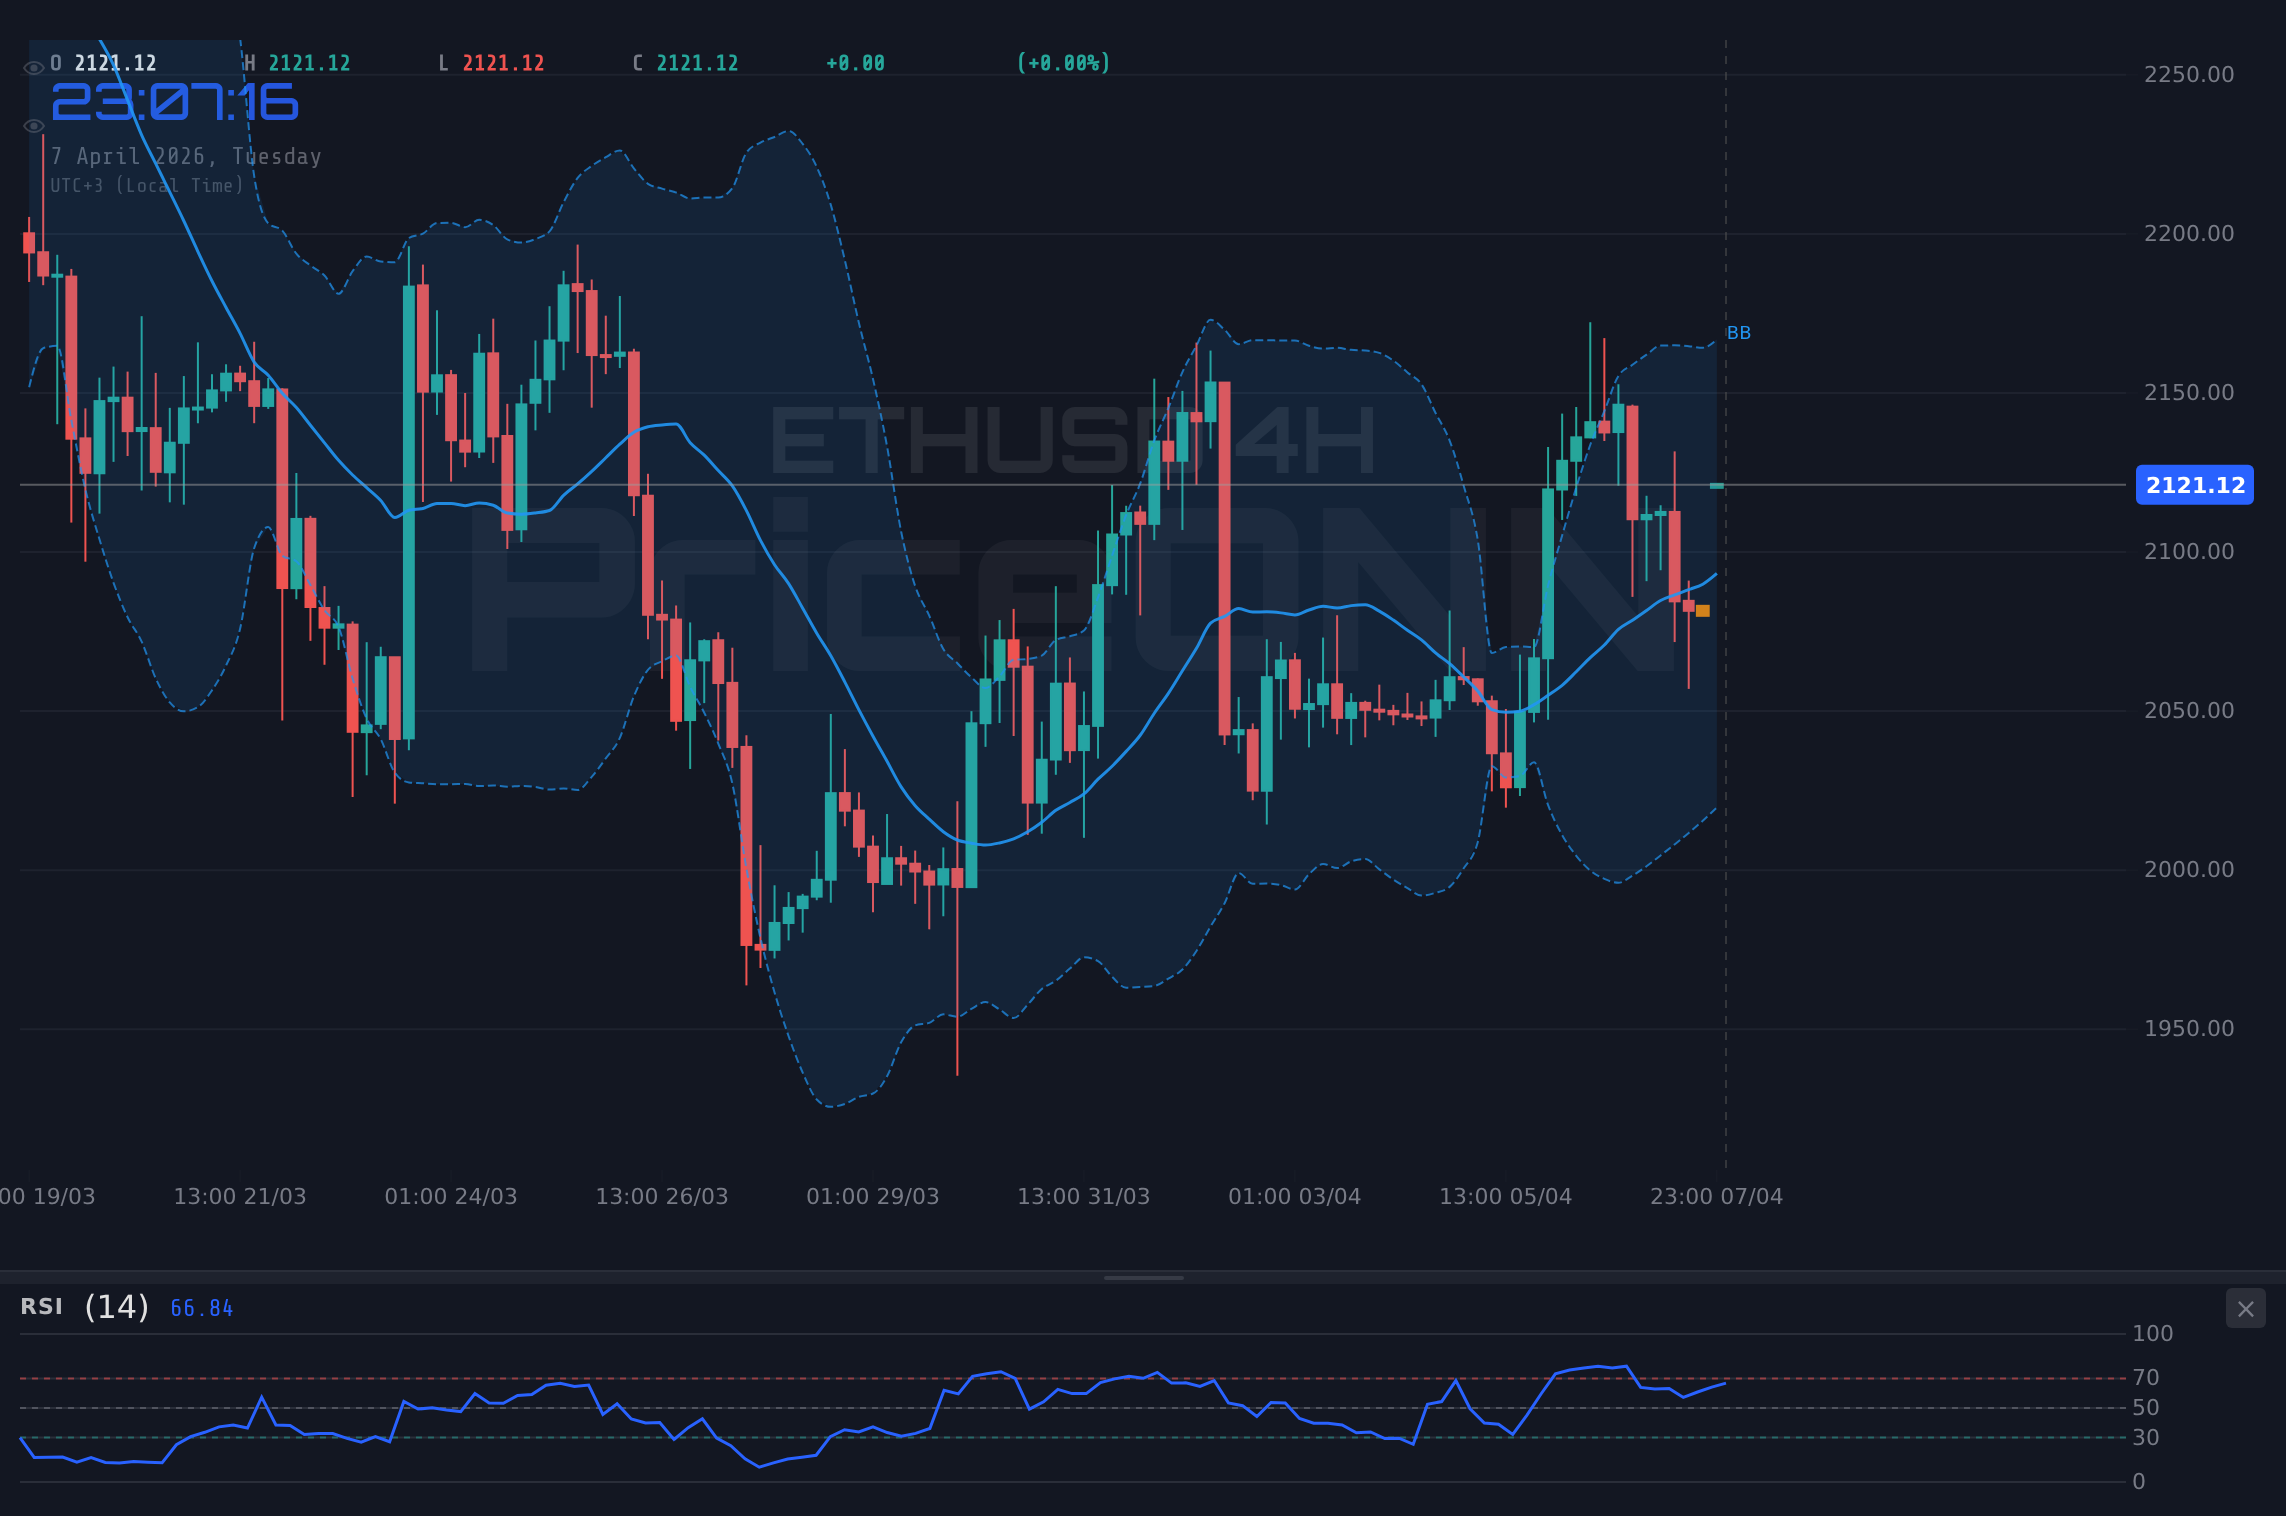
Let's delve deeper into these conflicting signals. On the 1H chart, the bullish sentiment is undeniable. The MACD is above its signal line, and the histogram is positive, indicating increasing buying pressure. The Stochastic's rapid rise and crossover are textbook 'buy' signals for short-term traders. However, the Bollinger Bands are pushing above the upper band, a situation that can sometimes signal an overextended move that's due for a correction, especially if broader market sentiment doesn't support further upside. The ADX at 18.49, while showing a trend, is far from indicating a runaway bull market; it suggests that momentum could easily shift.
Contrast this with the 1D chart. Here, the ADX at 43.76 is the dominant factor. This signifies a strong, established downtrend. For context, an ADX reading above 40 is considered a very strong trend. While the MACD is positive, its histogram is narrowing, and the RSI, though just above 50, shows a slight downward eğilim. The Stochastic's bullish crossover is interesting, but it's starting from a lower base and is already pushing towards overbought territory. This divergence between the strong daily downtrend signal (ADX) and the shorter-term bullish indicators is the crux of the current ETHUSD dilemma. It suggests that while short-term scalpers might find opportunities on the buy side, the longer-term trend remains under pressure, and any rallies could face significant selling.
The Macro Backdrop: DXY, Equities, and the Inflation Conundrum
No analysis of ETHUSD is complete without considering the broader macroeconomic environment. The Dollar Index (DXY) is currently trading at 99.42, showing a slight bearish bias on the 1H and 4H charts but a strong bullish trend on the daily. This is a critical correlation to watch. Historically, a rising DXY puts pressure on risk assets like Ethereum, as a stronger dollar makes dollar-denominated assets more expensive for foreign buyers and can signal tighter global liquidity. The current DXY weakness on shorter timeframes might be providing some temporary relief for ETHUSD, but the daily strength remains a headwind.
Equities provide another crucial lens. The S&P 500 is at 6572.87, showing a mixed picture with a strong 1H trend but a dominant daily downtrend. The Nasdaq 100, at 24208.74, also exhibits a similar pattern – bullish on shorter timeframes, but a strong daily downtrend is indicated by its ADX of 43.76. If these major indices continue to struggle or reverse, it will likely spill over into the crypto market, which has shown increasing correlation with tech stocks. Furthermore, the persistent inflation narrative, hinted at by the recent surge in oil prices (Brent at $109.86, WTI at $112.25), continues to be a wildcard. If inflation proves stickier than expected, it could complicate central bank policy, potentially leading to higher-for-longer interest rates, which is generally bearish for risk assets.
On-Chain Metrics: Whispers from the Network
Beyond technicals and macroeconomics, the on-chain data offers valuable insights into Ethereum's fundamental health. While specific real-time on-chain data isn't provided in the market context, we can infer general trends. A healthy network typically shows increasing active addresses, robust transaction volumes, and significant Total Value Locked (TVL) in DeFi protocols. Conversely, declining active addresses, a drop in transaction fees (gas fees), and a shrinking TVL would signal reduced network activity and potentially lower demand for ETH. Whale movements - large holders moving significant amounts of ETH - are also critical. A large accumulation by whales could be a bullish sign, while significant outflows to exchanges might precede selling pressure.
The recent news about South Korea mandating 5-minute crypto holdings checks is a regulatory development that warrants attention. Increased regulatory scrutiny, while potentially creating short-term uncertainty, can also foster long-term trust and institutional adoption if handled transparently. For Ethereum, this could impact exchange flows and investor sentiment. Furthermore, the ongoing developments around potential spot Ethereum ETFs in other jurisdictions remain a significant factor. Positive regulatory clarity or approvals could drive institutional inflows, providing a fundamental tailwind. Conversely, any setbacks in regulatory progress could dampen sentiment and weigh on price.
Navigating the Current Landscape: What Traders Need to Watch
Given the conflicting signals, a patient approach is paramount. For short-term traders, the 1H chart provides the immediate action. A sustained close above the 1H resistance at $2,115.23, coupled with bullish confirmation from indicators like the Stochastic and MACD, could signal a short-term scalp opportunity targeting the next resistance at $2,130. However, the risk is a rejection here, leading to a quick fall back towards the 1H support at $2,095.77. This requires tight stop-losses and active risk management.
For swing traders and longer-term investors, the 4H and 1D charts are more relevant. The key level to watch is the daily support at $2,060.25. A failure to hold this level, especially on a decisive daily close below it, would invalidate the short-term bullish signals and likely trigger further downside towards the next support at $2,000.31. Conversely, for the bulls to regain control, they need to convincingly break and hold the daily resistance at $2,196.61. This would require a significant shift in market sentiment, potentially driven by positive news on the regulatory front, a dovish turn from the Fed, or a sustained rally in major equity indices. Until then, expect choppy conditions.
Scenario Analysis: Mapping Potential Paths Forward
Bearish Scenario: The Downtrend Persists
65% ProbabilityNeutral Scenario: Consolidation Continues
25% ProbabilityBullish Scenario: A Breakout Higher
10% ProbabilityThe Path Ahead: Patience and Precision
The current market environment for ETHUSD demands a disciplined approach. While shorter timeframes flirt with bullish signals, the daily chart's strong downtrend indication via the ADX at 43.76 cannot be ignored. The key is to wait for confirmation. A daily close below $2,060.25 would be a strong bearish signal, opening the door for a move towards $2,000. Conversely, a decisive break and hold above the daily resistance at $2,196.61, supported by positive macro news or a significant shift in on-chain metrics, would be needed to signal a genuine trend reversal. Until then, managing risk and waiting for a higher probability setup is the most prudent strategy.
Frequently Asked Questions: ETHUSD Analysis
What happens if ETHUSD breaks below the $2,060.25 support level?
A daily close below $2,060.25 would invalidate short-term bullish signals and likely trigger a move towards the $2,000.31 support. This would confirm the persistent downtrend indicated by the daily ADX of 43.76, suggesting further downside potential.
Should I consider buying ETHUSD at current levels around $2,120 given the mixed signals?
Buying at current levels carries significant risk due to conflicting indicators. A more prudent approach would be to wait for confirmation: either a decisive break above $2,196.61 resistance with strong volume, or a clear bounce from the $2,060.25 support. Risk management is key, with tight stops below key levels.
Is the RSI at 57.32 on the 4H chart a buy or sell signal for ETHUSD?
An RSI of 57.32 on the 4H chart is in neutral territory but trending upwards, suggesting some buying momentum. However, it's not an extreme overbought or oversold signal. It indicates a neutral-to-slightly-bullish bias on this timeframe, but should be considered alongside other indicators and longer-term trends.
How will the DXY's current level of 99.42 affect ETHUSD's price action this week?
The DXY at 99.42 shows weakness on shorter timeframes, which can provide temporary relief for ETHUSD. However, the daily trend for DXY is strong and bullish, suggesting potential headwinds for ETHUSD if the dollar strengthens further. Traders should monitor DXY's ability to hold its current levels or break lower.
Track markets in real-time
AI-powered analysis, technical indicators and real-time price data.
Join Our Telegram Channel
Breaking market news, AI analysis and trading signals instantly.
Join Channel