EURUSD is currently trading around $1.15, facing renewed downside pressure as the US Dollar Index (DXY) strengthens. With the DXY at 99.38, the pair is struggling to maintain its footing, highlighting the strong inverse correlation between the two assets. Investors are closely watching key support levels to gauge the potential for further declines. The focus for today's analysis is to determine whether the current dip presents a buying opportunity or signals the start of a deeper correction.
The EURUSD's current price action is largely dictated by the strength of the US dollar, as evidenced by the DXY's continued ascent. The 1-hour chart reveals a clear downtrend, with the price consistently trading below its 200-period moving average. The Relative Strength Index (RSI) at 38.34 indicates that the pair is approaching oversold territory, but has not yet reached levels that would typically signal a strong buying opportunity. This suggests that there may be further room for the downside in the short term. The ADX on the 1H chart reads 32.29, confirming a strong trend. This tells us to respect the current trajectory, rather than betting on a contrarian move.
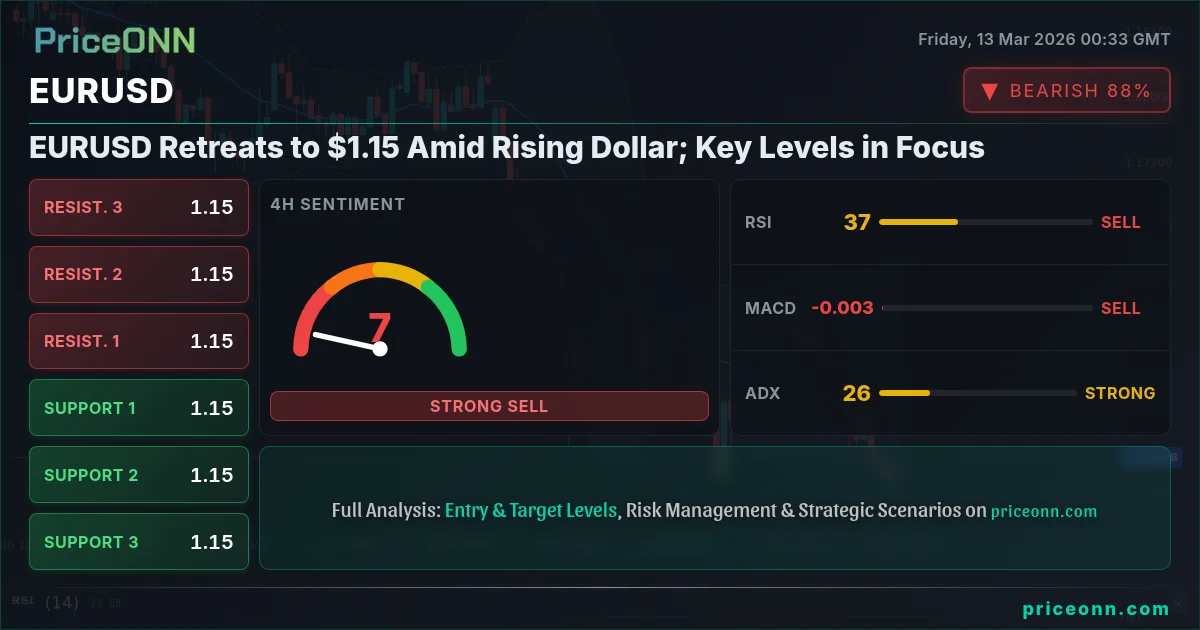
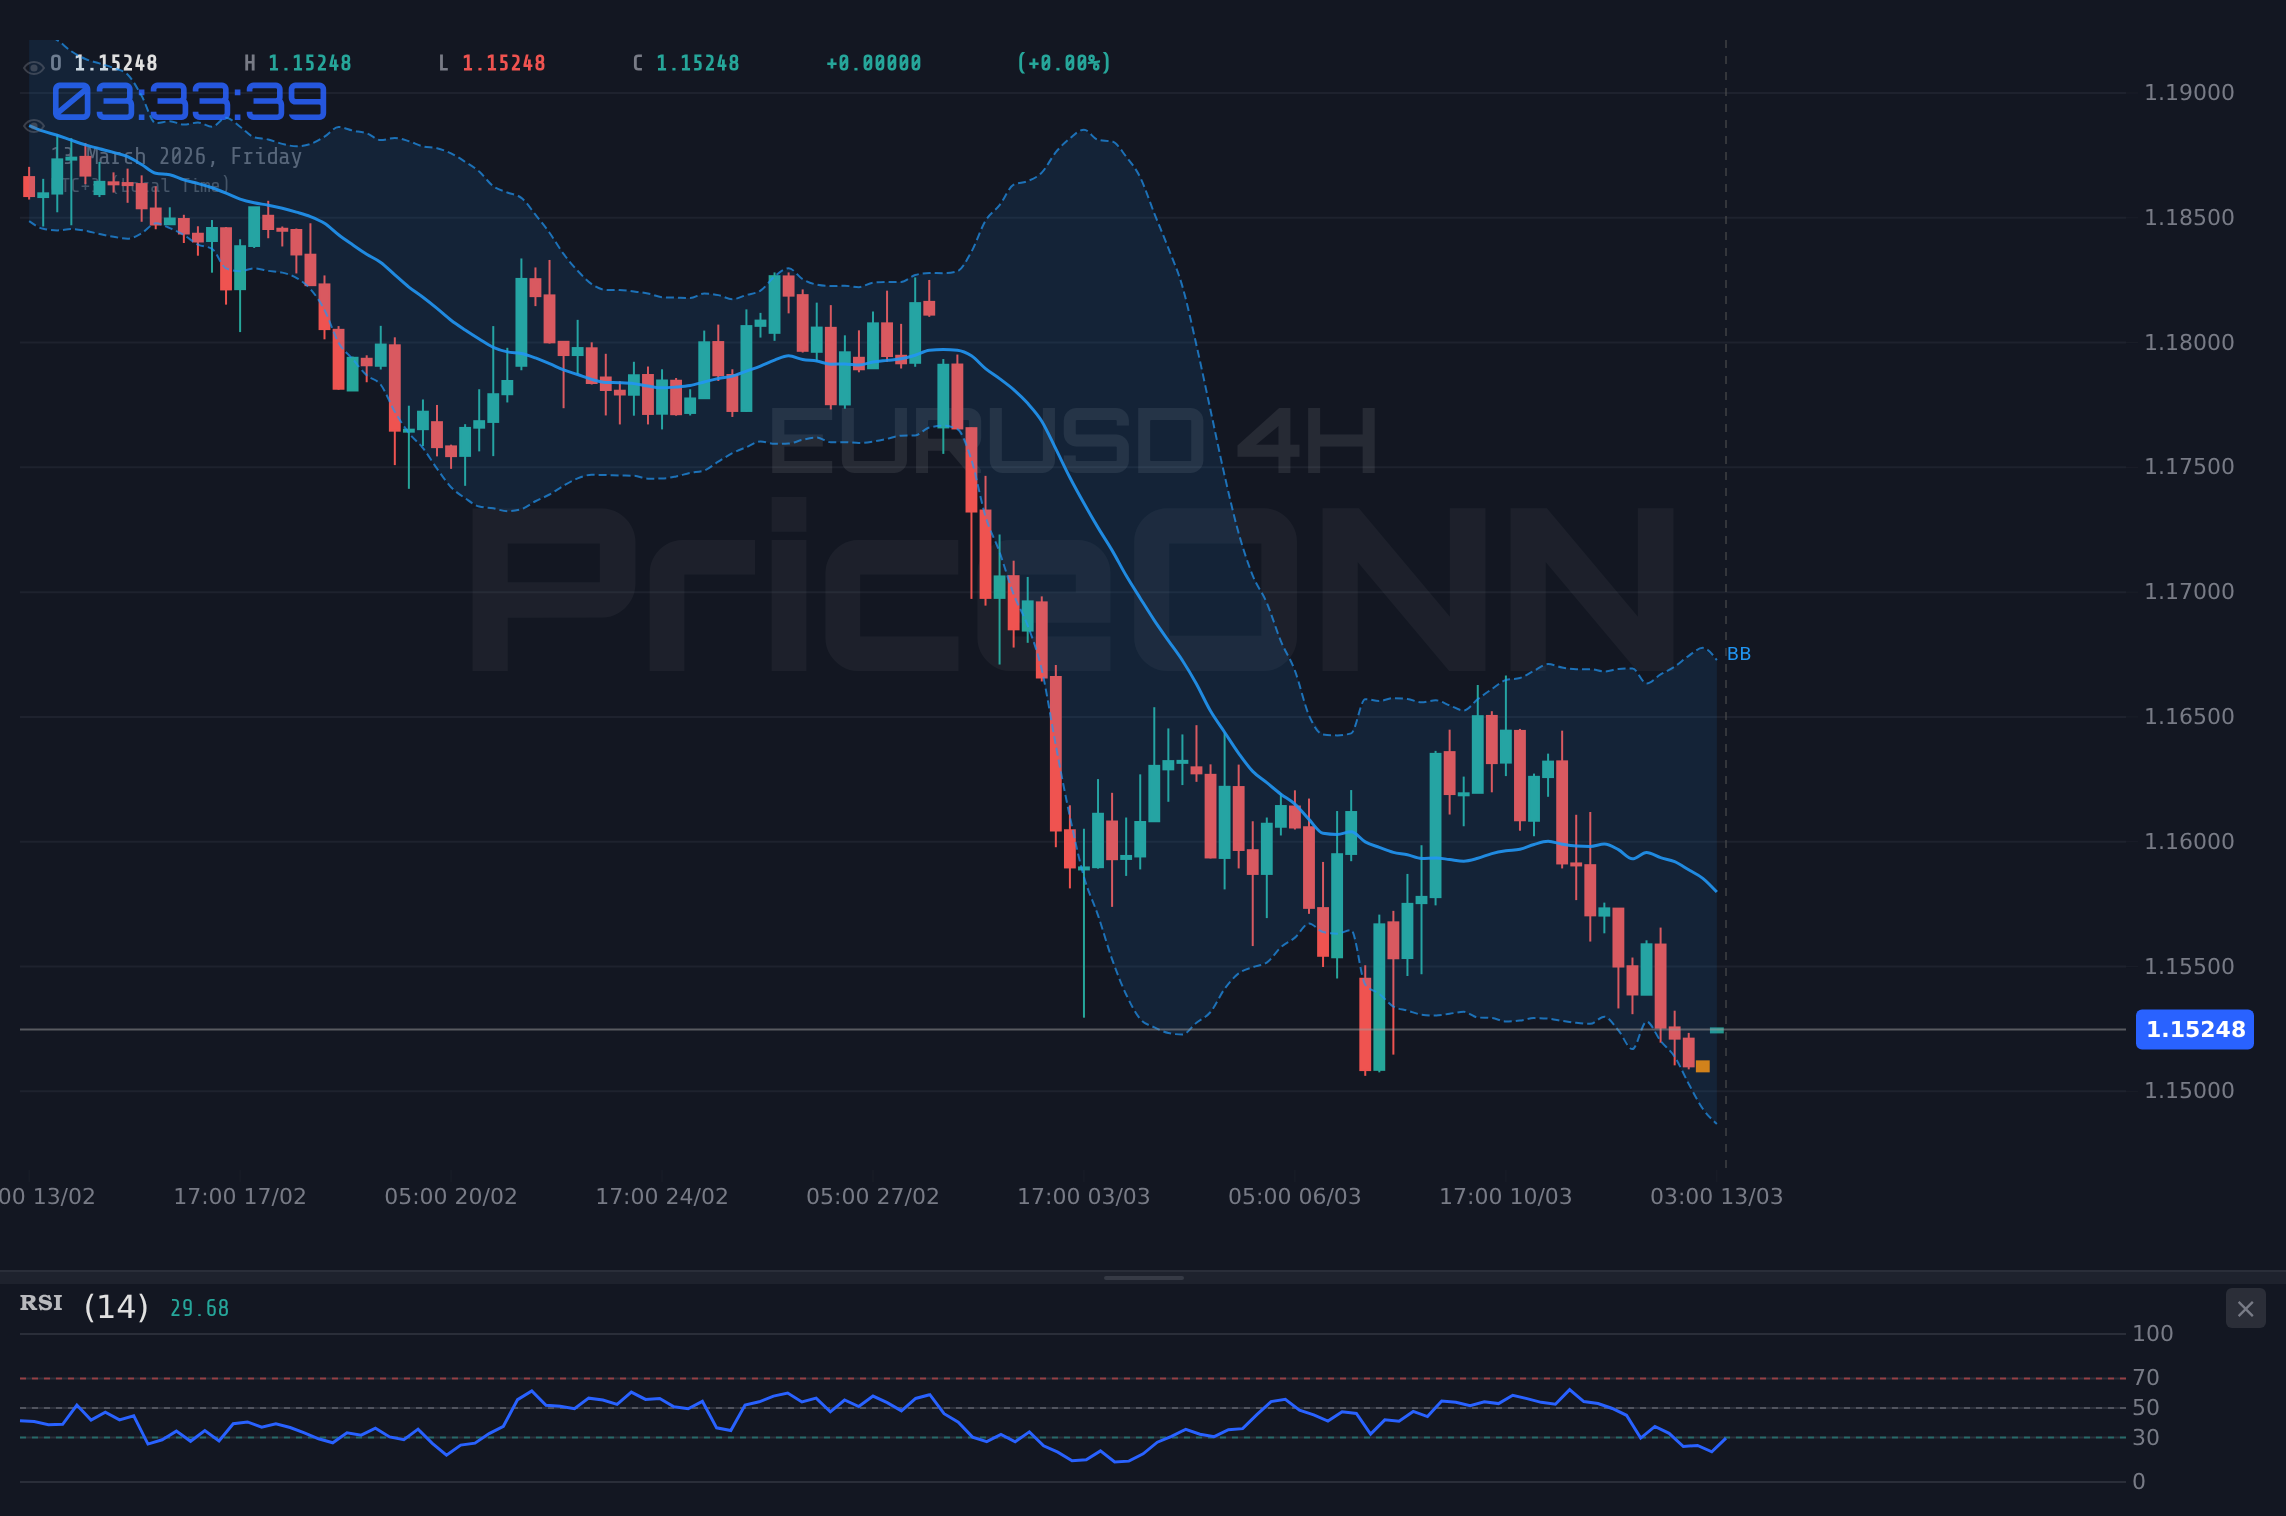
Examining the 4-hour timeframe provides a broader perspective on the EURUSD's trajectory. The RSI on this timeframe stands at 35.7, reinforcing the bearish sentiment. The MACD histogram is also in negative territory, indicating that selling pressure remains dominant. A key level to watch on the 4-hour chart is 1.15102, which represents the immediate support. A decisive break below this level could open the door for a test of the next support at 1.14994. The Stochastic oscillator is deep in oversold territory at 4.65, but as any seasoned trader knows, oversold conditions can persist for extended periods during strong downtrends.
Stepping back to the daily chart, the EURUSD's outlook appears even more precarious. The RSI is at a concerning 28.47, firmly in oversold territory. This might tempt some traders to call a bottom, but the ADX reading of 30.69 signals a strong trend. The price is trading well below the 200-day moving average, further underscoring the bearish trend. Key support on the daily chart lies at 1.15407. A break below this level would confirm the bearish trend and potentially pave the way for a move towards 1.15081. Given that all timeframes are suggesting further downside, the macroeconomic factors will need to be closely monitored.
From a macroeconomic perspective, several factors are weighing on the EURUSD. The strength of the US dollar is being fueled by expectations of continued hawkishness from the Federal Reserve. As Reuters reported, "Fed officials have emphasized that inflation remains 'stubbornly high,' signaling a willingness to maintain restrictive monetary policy." This hawkish stance is attracting capital flows into the US dollar, putting pressure on the EURUSD. Furthermore, concerns about the Eurozone economy are also contributing to the pair's weakness. Data released on Wednesday showed a slowdown in industrial production, raising concerns about the region's growth prospects. As the Australian Financial Review points out, "EURUSD macroeconomic factors 2026 are pointing towards continued downward pressure as the economic outlook in Europe remains uncertain."
The upcoming economic calendar is filled with potential catalysts that could further impact the EURUSD. Friday brings a series of high-impact USD data releases, including [USD] which has a previous value of 4.3. These releases could provide further clues about the direction of the Federal Reserve's monetary policy and either support or negate the current bearish thesis. Given the current technical picture and macroeconomic backdrop, a bearish bias appears warranted for the EURUSD. However, traders should be prepared for potential volatility around the upcoming data releases. The Dow Jones Industrial Average took a significant hit, falling 1.56% as U.S. markets closed on Thursday, this risk-off sentiment has been supporting the dollar.
Considering the technical and fundamental factors, a short position on EURUSD appears to offer a compelling risk-reward profile. The strong downtrend, coupled with the hawkish Fed outlook and concerns about the Eurozone economy, suggests that further downside is likely. However, it's crucial to implement a well-defined trade plan to manage risk effectively. The key is to identify a clear entry trigger, set realistic price targets, and establish a stop-loss level to protect against unexpected market reversals.
EURUSD continues its downtrend, breaking below 1.1512 support and targeting 1.14994. Sustained dollar strength and weak Eurozone data fuel further selling pressure. Expect a test of 1.14883 if momentum persists.
EURUSD reverses its downtrend, bouncing from 1.1512 support and targeting 1.15321 resistance. A weaker dollar and positive Eurozone data drive buying interest. A move above 1.15432 would confirm the reversal.
Trade Plan:
Entry Trigger: Short EURUSD on a break below 1.1512 with a 65% probability.
Target 1: 1.14994
Target 2: 1.14883
Stop Loss/Invalidation: 1.15321
The market sentiment surrounding EURUSD remains bearish. The ongoing geopolitical tensions in the Middle East are fueling safe-haven demand for the US dollar, further exacerbating the pair's weakness. As Bloomberg data shows, "The US Dollar Index is approaching the key 100 level as escalating tensions in the Middle East, particularly involving Iran, drive investors towards safe-haven assets." This flight to safety is likely to persist in the near term, keeping EURUSD under pressure. Oil prices soar as the IEA reported a historic supply disruption in the Strait of Hormuz compounded by the Ukraine conflict. Oil prices have jumped to $101.85 per barrel.
Looking ahead, the EURUSD's trajectory will depend on a confluence of factors, including the Federal Reserve's monetary policy decisions, the Eurozone's economic performance, and the evolving geopolitical landscape. Traders should closely monitor these developments and adjust their strategies accordingly. While the current technical picture favors further downside, it's important to remain flexible and be prepared to adapt to changing market conditions. Patience and disciplined risk management will be key to navigating the choppy waters ahead.
Frequently Asked Questions: EURUSD Analysis
What happens if EURUSD breaks below 1.1512 support?
If EURUSD breaks below the 1.1512 support level, the next downside target becomes 1.14994, as indicated by the 4-hour chart analysis. Sustained selling pressure could then pave the way for a test of 1.14883, potentially triggering a deeper correction.
Should I short EURUSD at current $1.15 levels given RSI at 28.47 on the daily chart?
While an RSI of 28.47 indicates oversold conditions, shorting EURUSD at $1.15 could be risky without further confirmation. The ADX reading of 30.69 on the daily chart signals a strong trend. It's best to wait for a clear break below 1.1512 before initiating a short position to confirm the bearish momentum, with a 65% probability.
Is the MACD signal on the 1-hour chart a reliable indicator for EURUSD?
The MACD histogram on the 1-hour chart is currently in negative territory, suggesting that selling pressure remains dominant. However, traders should also consider other factors, such as the RSI and key support levels, before making trading decisions. A confluence of bearish signals would increase the reliability of the MACD.
How will the upcoming USD data releases affect EURUSD this week?
The upcoming USD data releases could act as a significant catalyst for EURUSD volatility. Stronger-than-expected data could further strengthen the US dollar, putting additional downward pressure on EURUSD. Conversely, weaker-than-expected data could lead to a dollar pullback and a potential bounce for EURUSD.
Technical Outlook Summary
| Indicator | Value | Signal |
|---|---|---|
| RSI (14) | 38.34 | Bearish |
| MACD Histogram | Negative | Bearish |
| Stochastic | 31.41 | Bullish |
| ADX | 32.29 | Strong Trend |
| Bollinger | Middle Band | Bearish |
Key Levels
Support Levels
Resistance Levels
Track markets in real-time
AI-powered analysis, technical indicators and real-time price data.
Join Our Telegram Channel
Breaking market news, AI analysis and trading signals instantly.
Join Channel