GBPUSD is currently trading near $1.337, where bulls and bears are locked in a tense battle. After a period of relative stability, the pair is now under renewed pressure, raising questions about the sustainability of this key support level. Will the bears succeed in pushing the price lower, or will the bulls manage to defend this critical juncture?
- GBPUSD faces bearish pressure as the DXY strengthens, currently trading at 99.22.
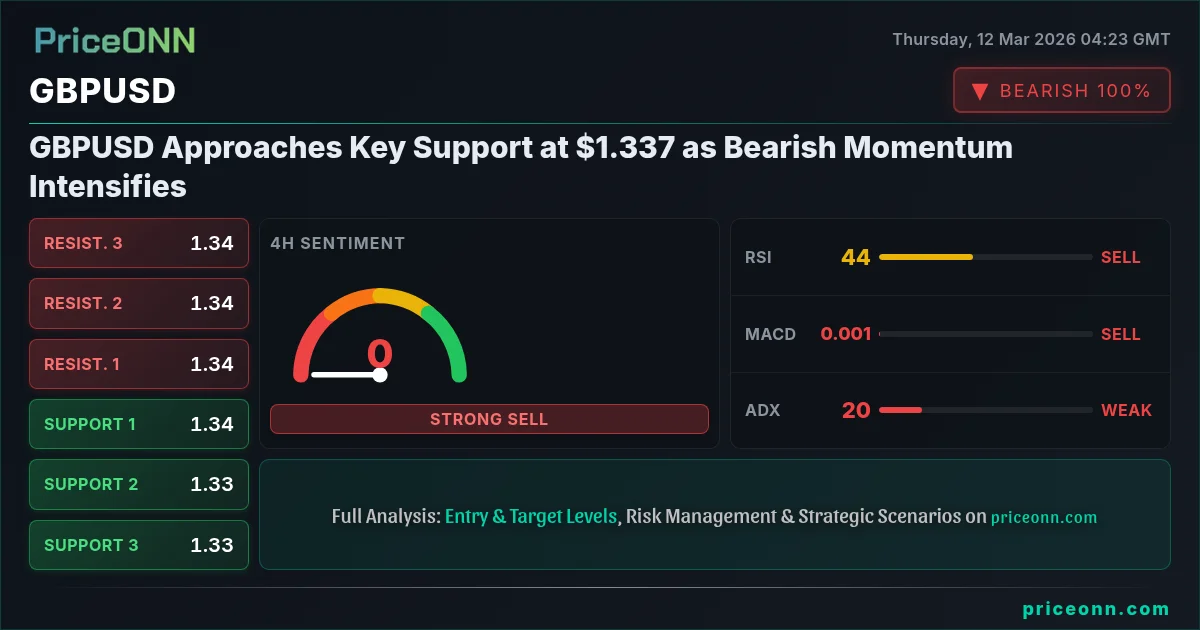
- Immediate support lies at 1.33583; a break below could accelerate declines.
- RSI at 35.39 on the 1H chart suggests oversold conditions, but the overall trend remains bearish.
- Geopolitical tensions and upcoming economic data releases will likely drive GBPUSD volatility.
The Bullish Argument: Is a Reversal Possible?
Despite the prevailing bearish sentiment, some factors suggest a potential for a bullish reversal. The first lies in oversold conditions on shorter timeframes. On the 1H chart, the RSI is at 35.39, signaling that the pair may be due for a relief rally. Furthermore, the Stochastic oscillator, with K=19.01 and D=19.01, is deeply in oversold territory, historically indicative of a potential bounce. However, these signals must be viewed with caution, as oversold conditions can persist in a strong downtrend. It's also important to see if the RSI can break above 50, a condition for a possible bullish reversal.
Additionally, the AUDUSD chart is showing a potential for a bullish reversal. Even with the current DXY strength, there is a chance that GBPUSD can mirror the AUDUSD chart and experience a short-term rally.

The Bearish Argument: Is $1.330 in Sight?
The bearish case for GBPUSD is primarily driven by the strength of the US dollar and a risk-off environment fueled by geopolitical tensions. The DXY (Dollar Index) is currently trading at 99.22, with a strong bullish trend across multiple timeframes. This DXY strength puts significant pressure on GBPUSD, as a stronger dollar typically translates to a weaker pound. The 1D trend for GBPUSD is bearish with 100% strength. The ADX on the daily timeframe is at 27.59, indicating a strong downtrend. The Stochastic oscillator (K=53.59, D=45.63) shows a bullish signal but this signal is likely to be short lived given the overall bearish signals. As long as the DXY remains strong, GBPUSD faces an uphill battle.
Furthermore, escalating tensions in the Middle East are contributing to a risk-off sentiment, driving investors towards safe-haven assets like the US dollar. This flight to safety further exacerbates the bearish pressure on GBPUSD. The recent news regarding oil prices testing $100 as Mideast tensions escalate adds another layer of complexity, as higher oil prices can fuel inflation and prompt central banks to adopt more hawkish stances, further supporting the dollar.
Technical Breakdown: A Battle at Key Levels
From a technical perspective, GBPUSD is currently testing a critical support level around 1.33583. A decisive break below this level could open the door for further declines towards the next support levels at 1.3347 and 1.33299. The 4H chart shows a bearish trend with an ADX of 19.23, suggesting that the downtrend has moderate strength. The Stochastic oscillator (K=17.08, D=34.93) is showing a bearish signal. With the 4H trend being neutral, it is more likely that GBPUSD will trade within a range.
However, it's important to note that the 1H chart shows the Stochastic Oscillator at a low level, which could signal a short term bullish retracement. The 1H chart also has an ADX of 22.33, a stronger trend than the 4H chart. All these mixed signals point to a choppy, range bound market.
On the upside, immediate resistance lies at 1.33867, followed by 1.34038 and 1.34151. The MACD on the 1H and 4H timeframes both show negative momentum, reinforcing the bearish outlook. Traders should pay close attention to price action around these key levels to gauge the strength of either the bulls or the bears.
Correlation Analysis: DXY, Equities, and Oil
Understanding the correlations between GBPUSD and other asset classes can provide valuable insights into potential market movements. As previously mentioned, the DXY (Dollar Index) has a strong inverse correlation with GBPUSD. A rising DXY typically puts downward pressure on GBPUSD, and vice versa. Currently, the DXY is exhibiting a strong bullish trend, further reinforcing the bearish outlook for GBPUSD.
Equities, particularly the S&P 500, can also influence GBPUSD. A risk-off environment, characterized by declining equity prices, often leads to increased demand for safe-haven currencies like the US dollar, further weighing on GBPUSD. The SP500 has a bearish daily trend, further reinforcing the bearish signals. Oil prices, currently surging due to geopolitical tensions, can also impact GBPUSD. Higher oil prices can fuel inflation, prompting central banks to adopt more hawkish policies, which can strengthen the dollar and pressure GBPUSD.
Economic Calendar: Key Events to Watch
Several high-impact economic data releases are scheduled for the coming days, which could significantly impact GBPUSD. On Friday, March 13th, the UK will release its latest GDP figures, which will provide insights into the health of the British economy. A stronger-than-expected GDP print could offer some support to the pound, while a weaker-than-expected reading could exacerbate the bearish pressure. Also on Friday, the US will release its latest employment data, including the Non-Farm Payrolls (NFP) report. A strong NFP number could further strengthen the dollar, while a weak number could provide some relief to GBPUSD. In addition, there is a USD event scheduled for March 10 with a previous value of 3.91, and a EUR event scheduled for March 11 with a previous value of 0.2.
Long-Term Investors: Patience is Key
For long-term investors, the current volatility in GBPUSD presents both risks and opportunities. While the bearish trend may be concerning, it also creates potential entry points for those looking to accumulate the pair at lower levels. However, it's crucial to exercise patience and wait for clear signs of a trend reversal before committing significant capital. Investors should also consider the long-term economic outlook for both the UK and the US, as well as the potential impact of geopolitical events and central bank policies.
Scalpers and Swing Traders: Navigating the Choppiness
For scalpers and swing traders, the current market conditions in GBPUSD offer opportunities for both long and short positions. However, it's crucial to be nimble and adapt to the changing market dynamics. Scalpers can capitalize on short-term price fluctuations, while swing traders can look for potential breakout or breakdown patterns. Risk management is paramount in this environment, and traders should use stop-loss orders to protect their capital.
Frequently Asked Questions: GBPUSD Analysis
What happens if GBPUSD breaks below $1.33583 support?
If GBPUSD breaks below the $1.33583 support level, it could trigger a further decline towards the next support levels at 1.3347 and 1.33299. This breakdown would confirm the bearish momentum and potentially lead to a test of lower price targets.
Should I buy GBPUSD at current levels of $1.337 given the RSI at 35.39?
While the RSI at 35.39 on the 1H chart suggests oversold conditions, it's not a definitive buy signal. The overall trend remains bearish, and oversold conditions can persist in a strong downtrend. It's prudent to wait for additional confirmation, such as a break above resistance or a bullish reversal pattern.
Is the MACD signal on the 4H chart a reliable indicator for GBPUSD?
The MACD on the 4H chart shows negative momentum, which reinforces the bearish outlook for GBPUSD. However, it's important to use the MACD in conjunction with other indicators and price action analysis to confirm the signal. A divergence between price and the MACD could signal a potential trend reversal.
How will the upcoming US employment data affect GBPUSD this week?
The upcoming US employment data, including the Non-Farm Payrolls (NFP) report, could significantly impact GBPUSD. A strong NFP number could further strengthen the dollar, putting downward pressure on GBPUSD. Conversely, a weak NFP number could provide some relief to GBPUSD.
Technical Outlook Summary
| Indicator | Value | Signal |
|---|---|---|
| RSI (14) | 35.39 | Neutral |
| MACD Histogram | Negative | Bearish |
| Stochastic | 19.01/19.01 | Oversold |
| ADX | 27.59 | Strong Downtrend |
| Bollinger | Lower Band | Watch |
Key Levels
Support Levels
Resistance Levels
Track markets in real-time
AI-powered analysis, technical indicators and real-time price data.
Join Our Telegram Channel
Breaking market news, AI analysis and trading signals instantly.
Join Channel