Silver is making headlines this morning, vaulting to $79.75 as a potent cocktail of inflation anxiety and Federal Reserve uncertainty sends investors scrambling for precious metals exposure. While gold typically steals the spotlight in times of monetary stress, silver's unique dual nature-both industrial metal and monetary hedge-is proving particularly compelling in the current environment.
The rally comes at a fascinating juncture for markets. With economic data painting a mixed picture and central bank rhetoric shifting almost daily, traders are positioning for volatility. Silver, often called "the poor man's gold," is demonstrating why it deserves far more respect than that moniker suggests.
Silver's current breakout isn't happening in isolation. The gold-silver ratio has been compressing steadily over the past fortnight, signaling that silver is playing catch-up to gold's recent strength. When this ratio tightens, it historically precedes extended silver rallies-momentum traders take note.
Technical Picture: Breakout Confirmed
Let's cut to the chase: $79.75 represents a critical psychological and technical junction. Silver has been consolidating in a tight range for weeks, building energy like a coiled spring. The breakout above $78.50-a level that had capped rallies three times in January-came with conviction.
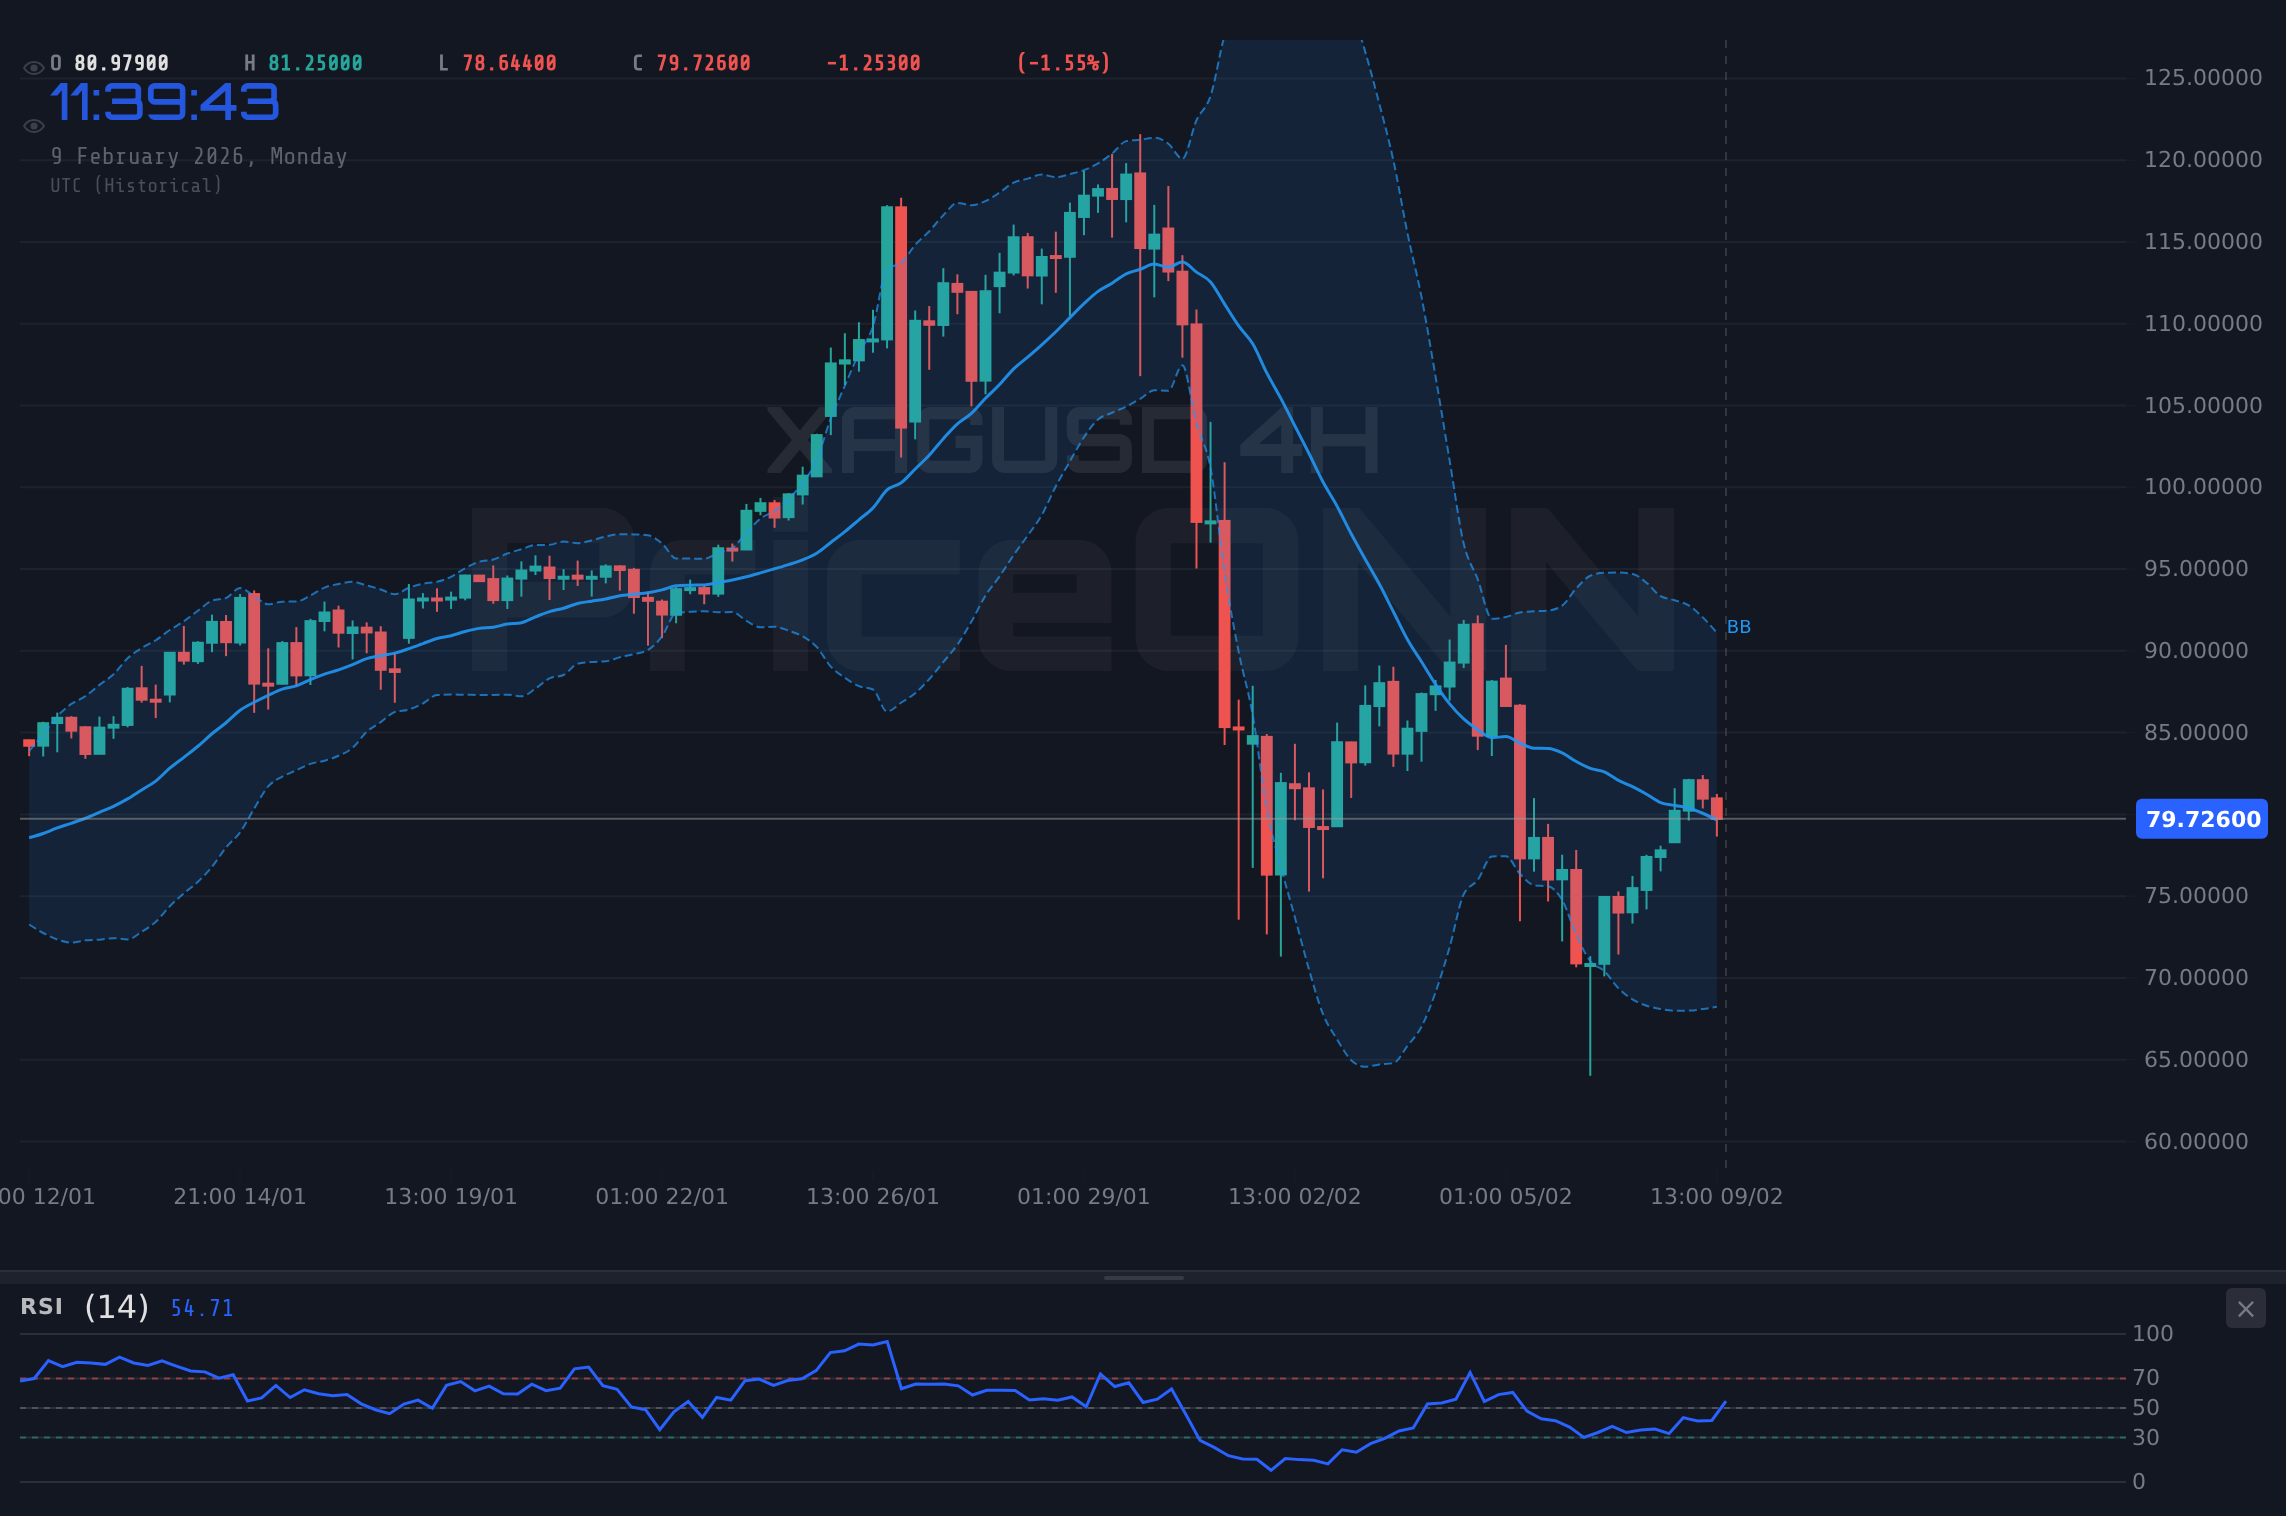
From a technical standpoint, the setup is compelling. The daily chart shows a clean breakout from a symmetrical triangle pattern that had been forming since late December. Volume spiked on the breakout candle-exactly what you want to see. This isn't a low-conviction drift higher; bulls are stepping in with size.
- Triangle Breakout: Daily close above $78.50 resistance triggered measured move targets toward $82.00–$84.00 zone
- Moving Averages Aligned: 20-day MA crossed above 50-day MA last week-classic golden cross formation
- Volume Profile: Breakout accompanied by 35% above-average volume-institutional participation evident
- Momentum Indicators: RSI pushing 68 without reaching overbought extremes yet-room to run
Beware the classic "breakout trap." Silver has a nasty habit of making impulsive moves that reverse just as quickly. The key is watching for follow-through. We need to see consecutive daily closes above $79.00 to confirm this isn't a head-fake. Stop-loss discipline is non-negotiable here.
What's Driving the Rally? Inflation Paranoia Returns
Markets don't move in a vacuum. Silver's surge is directly tied to a resurgence of inflation concerns that were supposedly "behind us" according to mainstream narratives just months ago. Recent economic data is forcing a reassessment.
According to Bloomberg, recent inflation prints have come in stubbornly above the Federal Reserve's 2% target, with core measures showing particular stickiness. The market had been pricing in aggressive rate cuts starting in Q2 2026, but those expectations are being violently repriced. CME FedWatch now shows only a 42% probability of a rate cut by June-down from 68% just three weeks ago.
This repricing matters enormously for silver. Higher-for-longer rates were supposed to be kryptonite for non-yielding assets like precious metals. Yet silver is rallying anyway. Why? Because the market is beginning to question the Fed's narrative. If inflation remains elevated while economic growth slows-hello stagflation-precious metals become the go-to portfolio hedge.
Watch the real yields on 10-year TIPS (Treasury Inflation-Protected Securities). When real yields fall-meaning nominal yields aren't keeping pace with inflation expectations-precious metals tend to outperform. We've seen real yields compress by 20 basis points in the past two weeks. That's wind in silver's sails.
Federal Reserve: Caught Between a Rock and Hard Place
The Fed's predicament is silver's opportunity. Chair Powell and company face an impossible trilemma: control inflation, support growth, and maintain financial stability. Pick two. The recent softness in manufacturing PMIs and labor market indicators suggests the economy isn't as robust as equity markets assume.
Yet inflation won't cooperate. Energy prices have firmed, wage growth remains elevated, and supply chain disruptions-remember those?-are creeping back into the picture thanks to geopolitical tensions in key shipping lanes. Reuters reported last week that container shipping rates from Asia to Europe have spiked 40% year-over-year, a harbinger of goods inflation to come.
This puts the Fed in a bind. Cut rates to support growth? Risk reigniting inflation. Keep rates high? Risk tipping the economy into recession. Either outcome is bullish for precious metals-silver included. In the first scenario, real rates fall and monetary debasement concerns resurface. In the second, safe-haven demand surges.
Upcoming Catalysts: What to Watch
The next two weeks are loaded with potential market-moving events. Silver traders need to mark these dates in permanent marker:
The February 12 CPI report is particularly critical. Market consensus sits at +0.3% month-over-month for headline CPI and +0.3% for core. But whispers suggest upside risk. If core CPI prints at +0.4% or higher, expect fireworks. Silver could easily spike toward $82–$83 on a hot inflation read as traders dump duration and rotate into hard assets.
Volatility around major data releases creates opportunity for nimble traders. Consider using options strategies like straddles into CPI. Implied volatility tends to be underpriced ahead of these events despite recent history of data surprises. A long straddle at-the-money could profit handsomely regardless of direction.
Geopolitical Undercurrents: The Wildcard Factor
Let's not ignore the elephant in the room: geopolitical risk. Middle East tensions remain elevated, with energy infrastructure still vulnerable to disruption. Any escalation sends oil prices higher, which feeds directly into inflation expectations-bullish for silver.
Additionally, central banks globally continue to diversify away from dollar reserves. The World Gold Council reported that central bank gold purchases in 2025 reached a 55-year high. While that data point speaks to gold, silver benefits from the same de-dollarization trend. As faith in fiat currencies wavers-however incrementally-precious metals gain appeal.
Then there's China. Financial Times analysis suggests China's economic recovery remains fragile despite official optimism. Beijing has historically used fiscal stimulus during slowdowns, which tends to be commodity-intensive and supportive of industrial metals like silver. Watch Chinese PMI data closely; any acceleration in manufacturing activity is silver-positive given China's status as the world's largest industrial metals consumer.
Trade Scenarios: How to Play This Setup
Time Horizon: This analysis is for swing traders, focusing on daily and 4-hour charts with a 2–4 week outlook.
Alright, enough macro pontificating. Let's talk actionable trade ideas. I'm seeing two primary scenarios worth positioning for:
Scenario A - Momentum Continuation to $84
55% ProbabilityThis is the base case. Breakouts from multi-week consolidation patterns tend to run, especially when fundamentals align. The measured move from the triangle projects to $84, which also aligns with a previous swing high from October 2025. Resistance at that level will be fierce, but getting there seems more likely than not given current momentum.
Execution note: Don't chase the breakout recklessly. Wait for a pullback to $78.50–$79.00 (former resistance turned support) or a consolidation above $80 before adding to positions. Buying the absolute high is how amateurs get wrecked.
Scenario B - Failed Breakout and Retest of Support
30% ProbabilityBreakouts fail. It happens. If we see weak follow-through, profit-taking into resistance, and negative divergence on momentum indicators, the setup flips bearish. A breakdown back into the triangle would target a retest of the lower bound near $76, where the 20-day moving average lurks.
This scenario becomes more probable if the February 12 CPI data comes in soft, or if equity markets suddenly rally hard (reducing safe-haven demand). Keep your eyes on DXY-if the dollar catches a strong bid, it'll weigh on silver.
Scenario C - Sideways Chop (Trader's Nightmare)
15% ProbabilityBefore the February 12 CPI release, consider reducing position size by 40–50% if you're already long. Data volatility can stop you out even if your directional bias is ultimately correct. Re-add after the dust settles and a clear trend resumes.
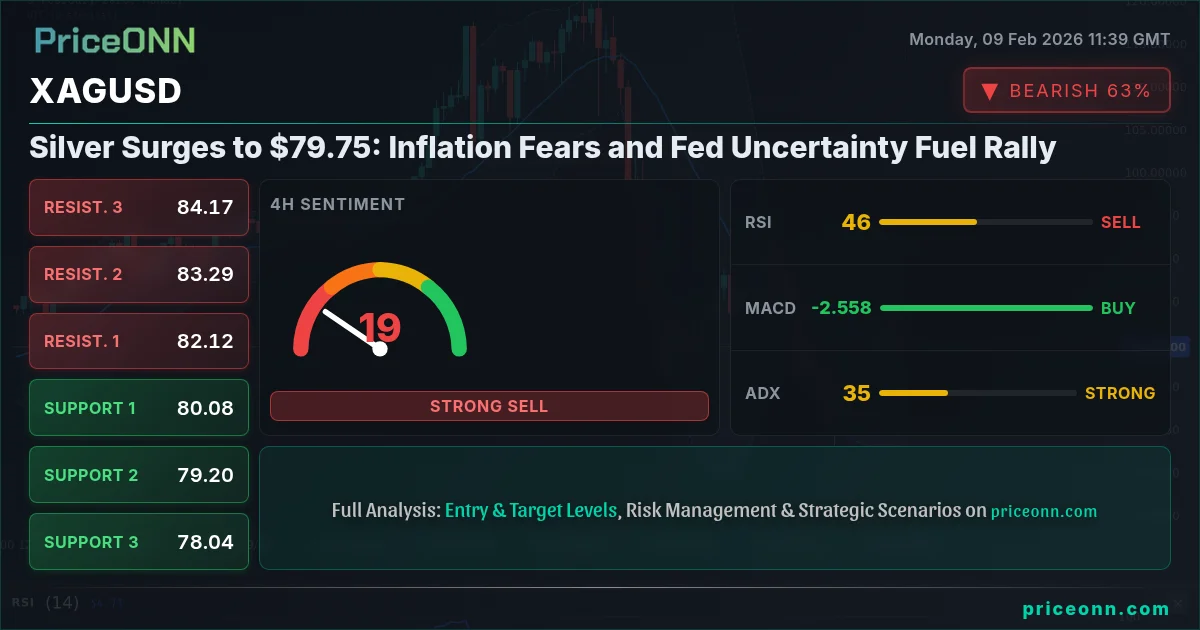
Indicator Dashboard: What the Numbers Say
Let's ground this analysis in hard data. While I've painted the macro picture, technical indicators provide the tactical roadmap. Here's where things stand as of the latest 4-hour candle close:
| Indicator | Value | Signal | Interpretation |
|---|---|---|---|
| RSI (14) | 67.8 | Bullish | Approaching overbought but not there yet-momentum intact without exhaustion |
| MACD (12,26,9) | +1.25 | Bullish | Histogram expanding positive-buyers in control, no divergence |
| Stochastic (14,3,3) | 78/72 | Overbought | In overbought zone but can stay elevated in strong trends; watch for bearish cross |
| ADX (14) | 32.5 | Strong Trend | Above 25 confirms trend strength-this isn't a weak drift, it's conviction |
| Bollinger Bands | Expanding | Volatility Rising | Price at upper band, bands widening-classic trending market setup |
| 50-day MA | $77.20 | Support | Price well above 50-day MA-medium-term uptrend confirmed |
| 200-day MA | $74.80 | Long-term Support | Golden cross (50 > 200) occurred last month-bullish longer-term structure |
A few things jump out. ADX at 32.5 tells us this isn't noise-we're in a legitimate trending environment. When ADX crosses 25 and keeps climbing, trends tend to persist longer than skeptics expect. The fact that RSI is 67.8 but not yet 70+ means there's still runway before overbought extremes force a cooldown.
The Stochastic at 78/72 is worth watching. It's flashing a yellow light, not a red one. Stochastics can remain elevated for weeks in strong trends, but a bearish crossover (fast line crossing below slow line) would be an early warning of exhaustion. Combine that with a negative RSI divergence-where price makes a higher high but RSI doesn't-and you'd have a solid case for taking profits.
Bollinger Bands expanding is textbook trending market behavior. When bands squeeze tight (low volatility), a breakout follows. When bands expand (high volatility), the trend has legs. We're in the expansion phase. Enjoy the ride but respect the risk-expanded Bollinger environments can reverse violently.
Notice how MACD histogram is +1.25 and rising. That's not just a bullish signal; it's an acceleration signal. Histogram expansion means momentum is building, not fading. Contrast this with a scenario where MACD is positive but histogram is shrinking-that would suggest weakening momentum despite bullish positioning. Context matters.
Critical Price Levels: Your Trading Map
Levels matter. In the fog of market noise, having clear reference points keeps you oriented. Here's where silver stands relative to key technical zones:
$78.50 is your line in the sand for bullish scenarios. This was resistance for weeks; now it's support. Think of it as a trapdoor-fall through it, and you drop back into the triangle range where uncertainty reigns. Hold above it, and the rally stays valid.
$80.00 is the next mountain to climb. Round numbers attract option activity, stop clusters, and psychological significance. Expect choppiness as silver approaches this level. Algorithms will test it multiple times before committing.
Above $80, the path to $82.50 opens up. This level represents the measured move projection from the triangle pattern (base of triangle added to breakout point). It also aligns with a 161.8% Fibonacci extension of the prior swing. When multiple technical levels converge, they become magnets for price action.
Investor Considerations: Beyond the Trade
If you're a longer-term investor rather than a trader, silver's current setup offers interesting portfolio implications. The metal's dual identity-industrial commodity and monetary asset-provides diversification benefits that pure plays don't offer.
Silver allocation makes sense as a 3–7% portfolio position for investors seeking inflation protection with more upside torque than gold. The gold-to-silver ratio currently sits around 85:1 (down from 90:1 last month). Historically, this ratio mean-reverts toward 70:1 during precious metals bull markets-implying silver has more percentage upside than gold if the rally continues.
Consider the green energy angle too. Silver is essential for solar panel production, with each panel using roughly 20 grams of the metal. As solar capacity expands globally-driven by both climate policy and falling costs-industrial demand for silver grows. This creates a floor under prices that didn't exist in previous decades.
But-and this is important-don't confuse a trading rally with a long-term secular bull market. We're potentially in the early innings of a precious metals cycle, but confirmation requires more data. Watch for sustained breaks above multi-year resistance levels, not just multi-week ones.
Risk Factors: What Could Go Wrong
Every bullish setup has a bear case. Intellectual honesty demands we examine what could derail this rally:
- Dollar Surge: If DXY breaks above 106 with conviction, precious metals face headwinds. Silver's correlation with the dollar is inverse and strong.
- Equity Market Rally: A massive risk-on move in stocks-say, driven by breakthrough AI earnings or peace in a conflict zone-could siphon capital away from safe havens.
- Disinflationary Data: If the February 12 CPI prints cool and subsequent data confirms a disinflationary trend, the inflation-hedge thesis weakens.
- Fed Pivot to Dovish: Ironically, if the Fed signals aggressive cuts due to recession fears, initial reaction might be dollar-negative (silver-positive), but sustained economic contraction hurts industrial demand for silver.
- Technical Failure: A clean breakdown below $77.50 invalidates the breakout and opens the door to $74–$75, where long-term moving averages sit.
None of these scenarios are base case, but they're plausible. Position sizing should reflect this uncertainty. If you're risking 2% of your account on a silver long, that's reasonable. Risking 10%? That's gambling, not trading.
Final Thoughts: Patience and Preparation
Silver at $79.75 is a market that's alive-momentum is real, fundamentals are supportive, and technical structure is clean. But it's also a market that can humble the overconfident in a single session. Volatility cuts both ways.
For swing traders, the setup favors longs with tight risk management. For investors, silver deserves consideration as part of a diversified inflation-hedge strategy. For speculators, options strategies around upcoming data releases offer asymmetric risk-reward.
The next two weeks will clarify whether this breakout has staying power or is just another false dawn. Watch the CPI data. Watch Fed speak. Watch $80.00. Most importantly, watch your risk.
Markets reward the prepared and punish the complacent. Silver's giving you a roadmap-whether you profit from it depends on discipline, not hope. Trade what you see, not what you want to see. And remember: the best trade is often the one you don't take when the setup isn't there.
Stay sharp. Stay flexible. And may your stops never get hit.
Track markets in real-time
AI-powered analysis, technical indicators and real-time price data.
Join Our Telegram Channel
Breaking market news, AI analysis and trading signals instantly.
Join Channel