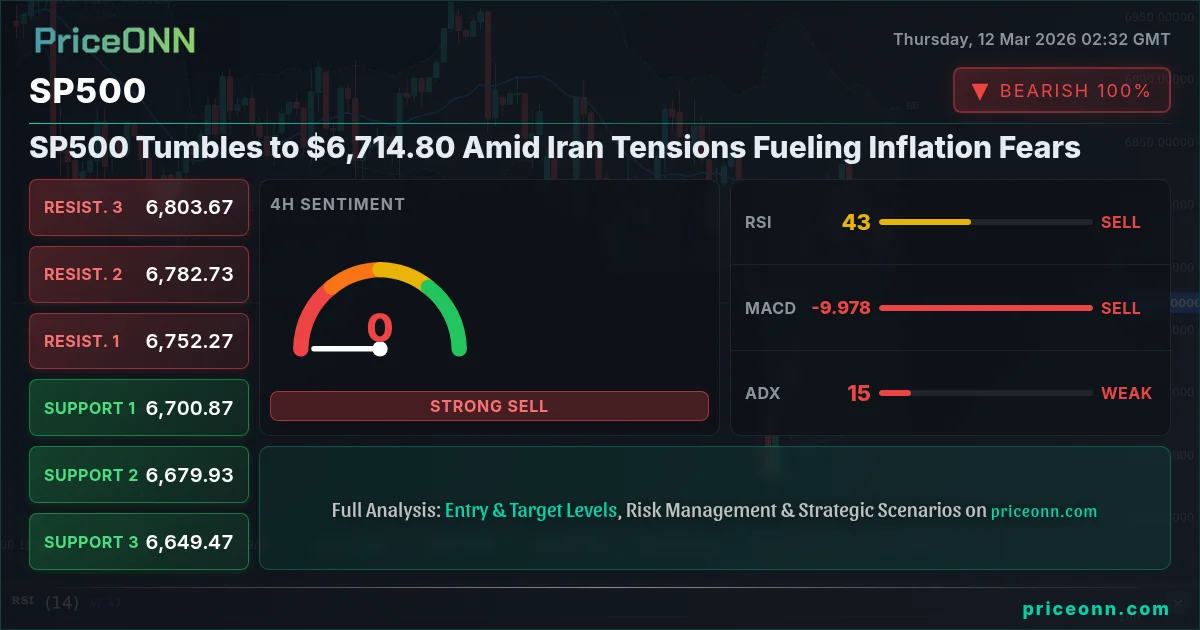
Escalating geopolitical tensions involving Iran are fueling inflation fears and sending shockwaves through global markets, with the SP500 currently trading at $6,714.80. The potential for disruptions to oil supplies is driving up energy prices, adding to concerns about persistent inflation and putting pressure on the Federal Reserve to maintain its hawkish stance.
- SP500 tumbles to $6,714.80 amid escalating geopolitical tensions involving Iran and rising inflation fears.
- Critical support for SP500 lies at 6713.53, a level to watch for potential bounce or further decline.
- MACD histogram shows negative momentum, indicating bearish pressure on SP500.
- The SP500's correlation with DXY is influenced by Fed rate expectations amid the inflation concerns.
The recent slide in the SP500 reflects growing anxiety among investors about the potential for a sustained period of higher inflation, which could force the Fed to raise interest rates more aggressively than previously anticipated. With WTI crude oil currently at $93.68 and Brent at $98.86, energy prices are contributing significantly to inflationary pressures. According to Reuters, multiple Fed officials have recently reiterated the need to remain vigilant about inflation, further fueling speculation that the central bank may delay any potential interest rate cuts.
SP500 Today Analysis: Navigating Choppy Waters
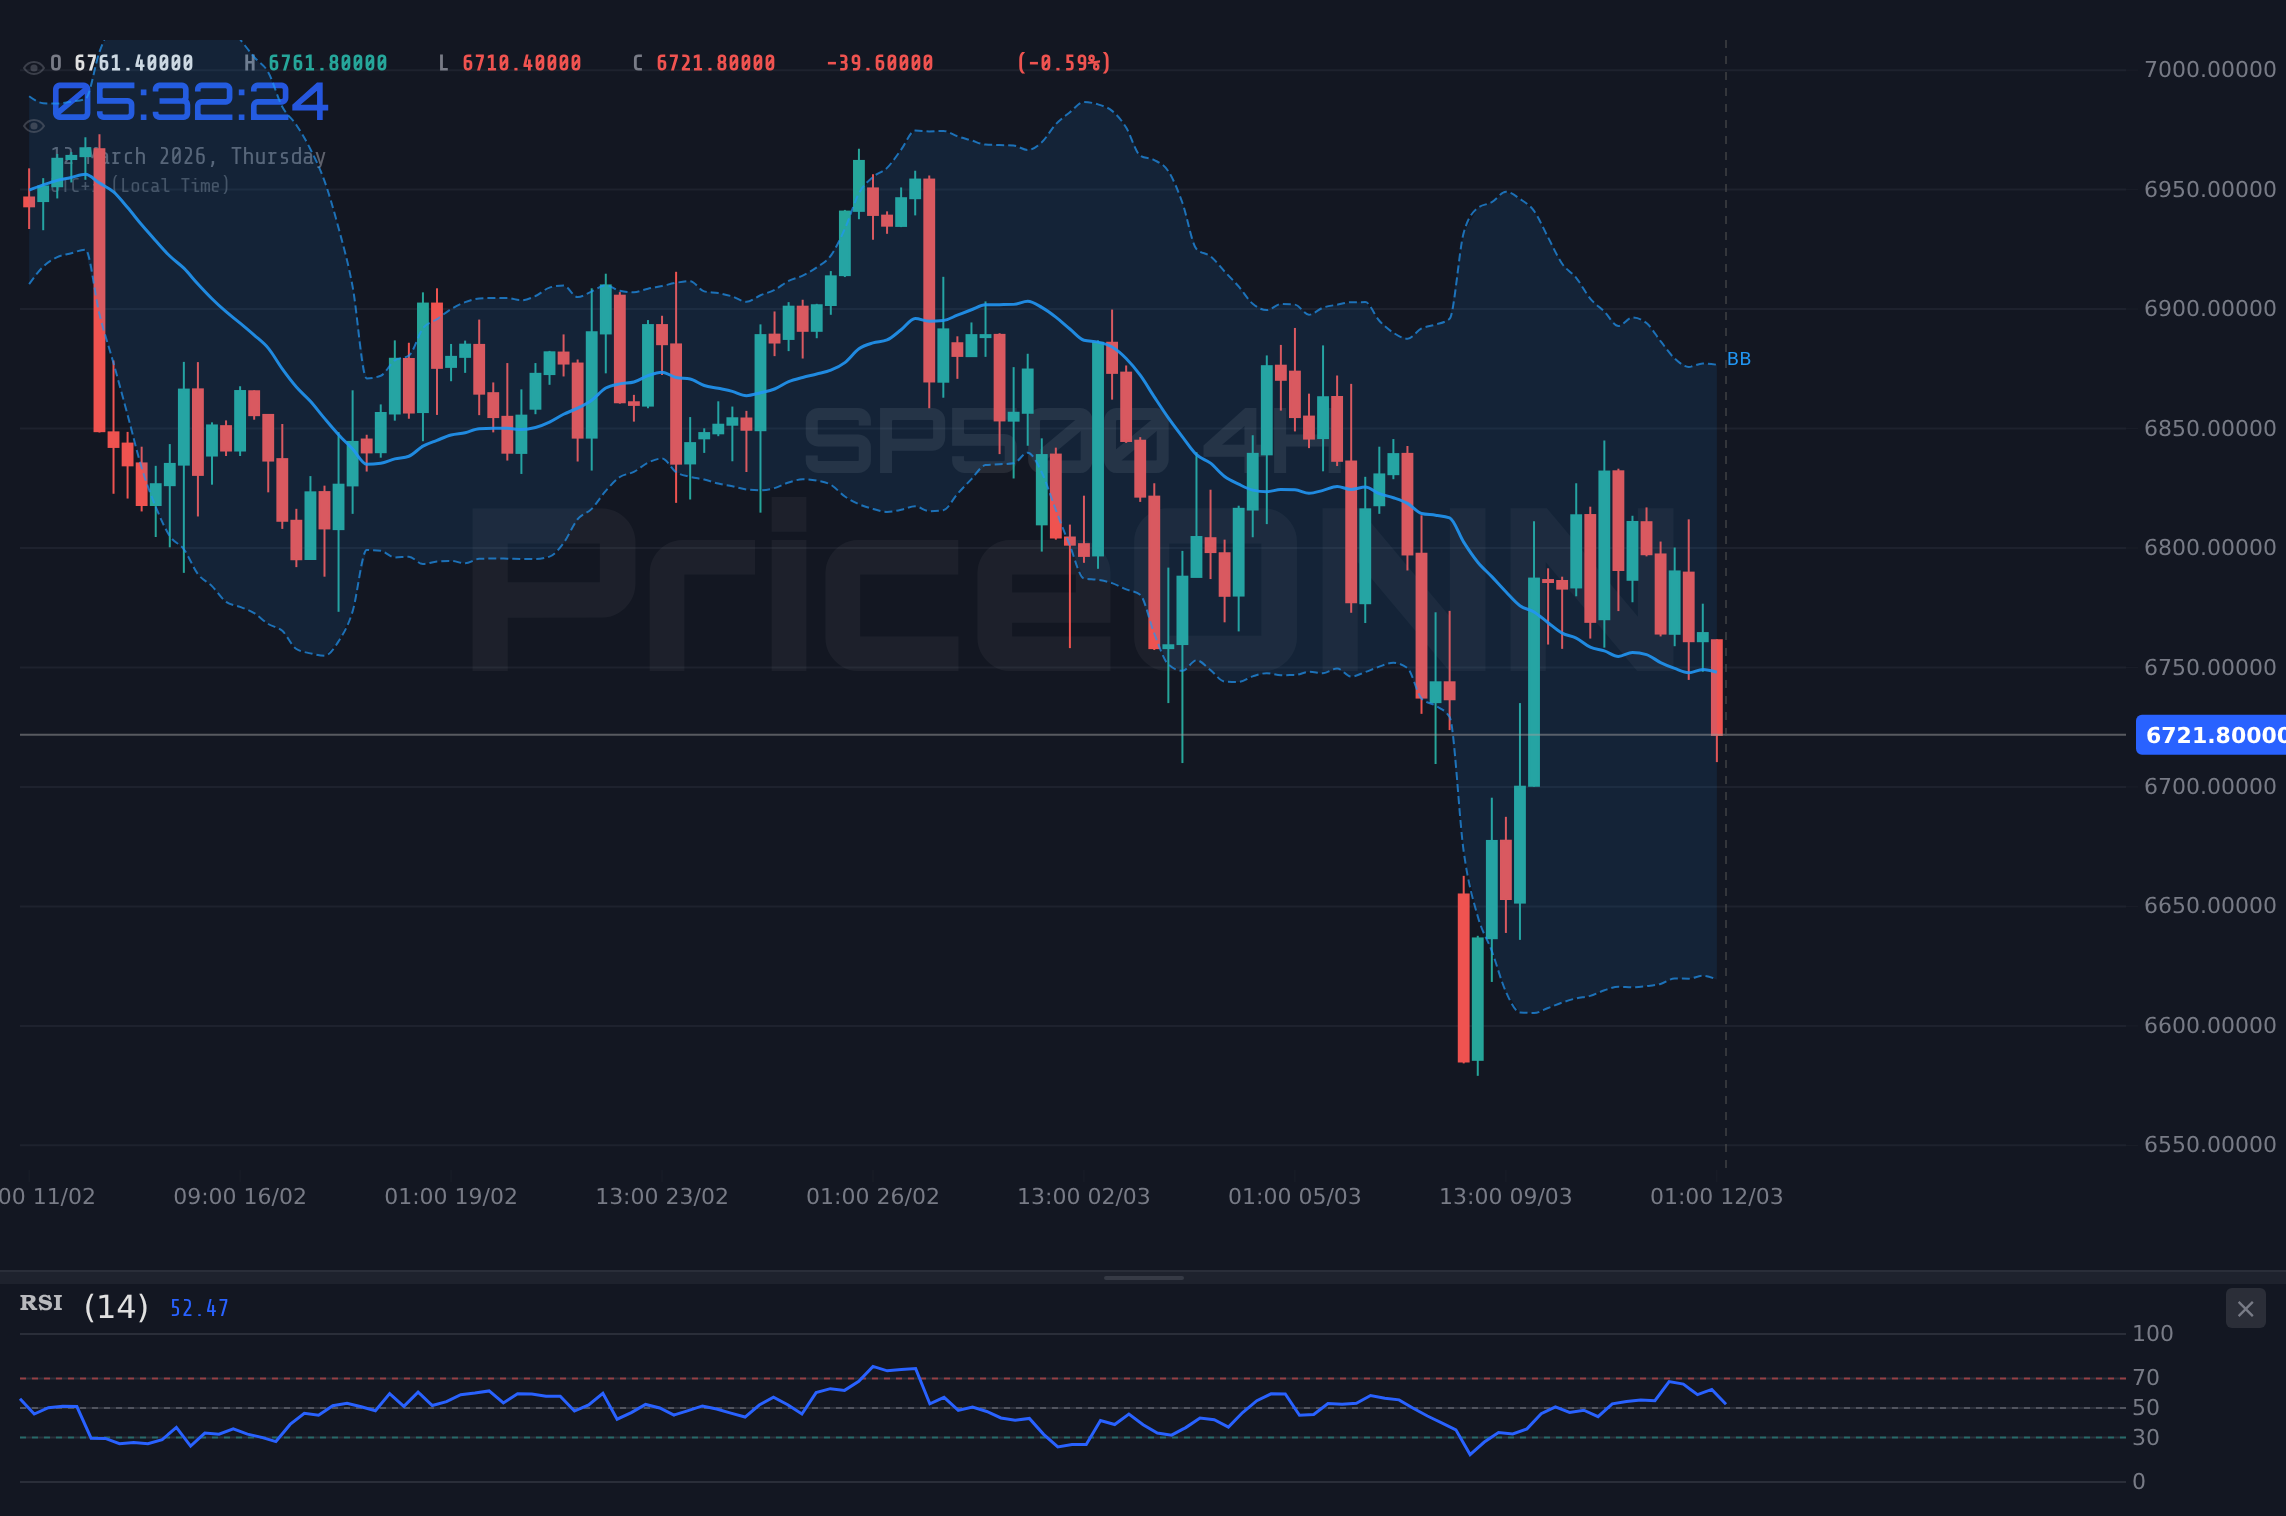
SP500 today analysis reveals a market struggling to find direction amid conflicting signals. The index is currently trading at $6,714.80, down 1.12% on the day, reflecting a risk-off sentiment driven by geopolitical concerns and inflation fears. The 1-hour chart shows a bearish trend with strong downward momentum, as indicated by the ADX at 13.78. However, the RSI at 35.16 suggests the index may be approaching oversold territory, potentially setting the stage for a short-term bounce. The immediate support to watch is 6713.53, a break below which could trigger further losses.
Key Levels for SP500 Trading Signals
Identifying key levels is crucial for SP500 trading signals. The immediate resistance stands at 6729.63 on the 1-hour chart. A sustained move above this level could signal a potential reversal of the current bearish trend. On the downside, the key support level is 6713.53. If this level fails to hold, the next support levels are at 6703.97 and 6697.43. It is important to note that SP500 key levels are not static and can shift based on market conditions and news flow.
SP500 Price Forecast: Short-Term Bearish, Long-Term Uncertain
The short-term SP500 price forecast appears bearish, given the current geopolitical tensions and inflation concerns. The 4-hour chart confirms the downward trend, with the index trading below the 200-period moving average. The RSI at 43.02 further supports this bearish outlook. However, the long-term outlook remains uncertain, depending heavily on the Fed's policy response to inflation and the resolution of the geopolitical risks. Investors should closely monitor upcoming economic data releases, particularly inflation figures, for clues about the Fed's next move.
SP500 Support and Resistance: A Battleground for Bulls and Bears
SP500 support and resistance levels are currently forming a critical battleground for bulls and bears. The 1-day chart shows a strong resistance at 6837.93, which represents the high of the recent rally. A decisive break above this level could signal a resumption of the uptrend. On the support side, the key level to watch is 6750.73. A failure to hold this level could pave the way for a deeper correction towards 6710.67 and potentially even 6663.53.
What the MACD Signal Tells Us About SP500 Trend Analysis
The MACD signal provides valuable insights into SP500 trend analysis. On the 1-hour chart, the MACD histogram is negative, indicating bearish momentum. However, the MACD is also approaching oversold territory, suggesting that the selling pressure may be waning. A crossover of the MACD line above the signal line could signal a potential bullish reversal. The 4-hour chart also shows a negative MACD histogram, further confirming the bearish trend. It's important to note that the MACD is a lagging indicator and should be used in conjunction with other technical indicators and price action analysis.
Why SP500 Volatility Analysis Points to a Breakout
SP500 volatility analysis suggests that the index may be poised for a breakout. The recent increase in geopolitical tensions and inflation concerns has led to a surge in volatility, as measured by the VIX index. High volatility often precedes significant price movements, either to the upside or the downside. Traders should closely monitor the SP500 for a decisive break above resistance or below support, as this could signal the start of a new trend. The ADX on the daily timeframe sits at 34.56, indicating a strong downtrend.
SP500 News Impact: Geopolitical Risks and Inflation Fears
SP500 news impact is currently dominated by geopolitical risks and inflation fears. The escalating tensions involving Iran have raised concerns about potential disruptions to oil supplies, driving up energy prices and fueling inflation. Investors are closely watching the Fed's response to these developments, as a more hawkish stance could put further pressure on the SP500. According to Bloomberg, several analysts have recently lowered their SP500 price targets, citing concerns about the impact of higher interest rates on corporate earnings. The upcoming release of the US inflation data on Friday will be a crucial test for the SP500.
SP500 Market Sentiment: Fear Grips Investors
SP500 market sentiment has turned decidedly negative, as fear grips investors. The recent slide in the index, coupled with the surge in volatility, has led to a sharp decline in investor confidence. Put-call ratios are also on the rise, indicating increased demand for downside protection. The CNN Fear & Greed Index is currently in "Fear" territory, further confirming the negative sentiment. However, it is important to remember that extreme sentiment readings can often be contrarian indicators, suggesting that a potential bottom may be near.
Frequently Asked Questions: SP500 Analysis
What happens if SP500 breaks below 6713.53?
If the SP500 breaks below the immediate support at 6713.53, we could see further losses towards 6703.97 and potentially 6697.43. This breakdown would confirm the bearish trend and could trigger stop-loss orders, accelerating the decline.
Should I buy SP500 at current levels of $6,714.80 given RSI at 35.16?
While the RSI at 35.16 suggests the SP500 is approaching oversold territory, it's not a definitive buy signal. A potential buying opportunity could arise if the index bounces off the 6713.53 support level and the MACD shows a bullish crossover, confirming a reversal of the downtrend.
Is the negative MACD histogram on the 1-hour chart a reliable signal for SP500?
The negative MACD histogram confirms the bearish momentum in the short term, but it's a lagging indicator. Traders should look for additional confirmation, such as a break below support or a continuation of the downtrend on higher timeframes, before acting solely on the MACD signal.
How will the US inflation data on Friday affect SP500 this week?
The US inflation data will be a major catalyst for the SP500 this week. If inflation comes in higher than expected, it could reinforce the Fed's hawkish stance, putting further downward pressure on the index. Conversely, a lower-than-expected inflation reading could trigger a relief rally, as it would ease concerns about aggressive rate hikes.
Track markets in real-time
AI-powered analysis, technical indicators and real-time price data.
Join Our Telegram Channel
Breaking market news, AI analysis and trading signals instantly.
Join Channel