
Week Ahead (May 4-8, Week 19): Everything Points to Friday
Week 19 starts quietly on Monday but all the energy is bunched on Friday: the NFP print at 12:30 GMT will answer whether the US economy is heading for a soft or a hard landing. The Yen intervention pulled USDJPY from 160.72 to 157.05, BRENT jumped from 105.94 to 114.09, and gold cooled by 1.95% though the bullish thesis is still intact.

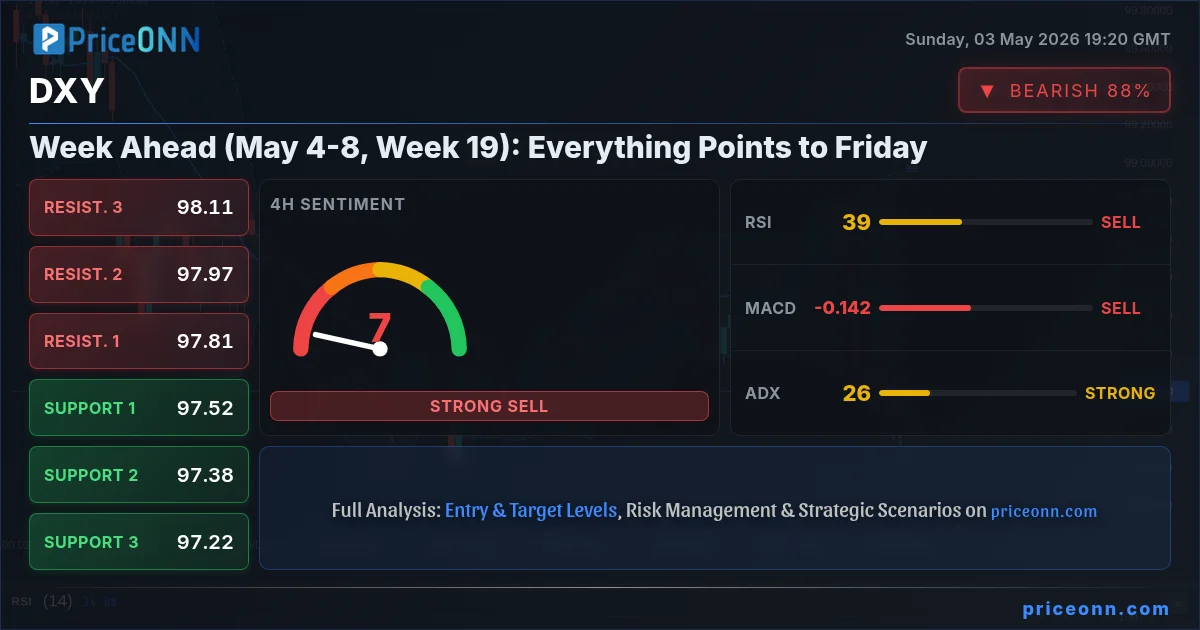
Quick summary
- USDJPY opens at 157.05; Tokyo intervened twice last week, the 156-158 band is no longer technical, it is political.
- BRENT jumped to 114.09 (+7.69%); the Hormuz premium and the OPEC+ rift have stacked on the oil side.
- Gold is cooling at $4,616 (-1.95%). DXY also fell that week, so the pressure is not coming from the dollar but from US real rates.
- Friday 12:30 GMT NFP is the center of the week: forecast slowing from 178K to 73K, AHE rising from 0.2 to 0.3.
- Light positioning Monday-Thursday, cash heavy into Friday; have two baskets ready to deploy after the print.
The macro backdrop this week
The week opens on a tableau where four separate axes overlap. First, the producer-group fragmentation that began with the UAE leaving OPEC+. Second, the fact that the Strait of Hormuz remains practically closed. Third, the persistent hawkish tone that bled into the US yield curve after Powell's farewell meeting. Fourth, Europe being forced back into Russian LNG by its energy crisis. Each of these axes is powerful enough to move an entire asset class on its own; because they are stacked, correlations this week are more fragile than usual.
When you close one weekend, the door Tokyo opens often shuts another in Washington. That is exactly what this week looks like.
Last week Japan's Ministry of Finance pulled USDJPY from 160.72 down to 157.05 with two consecutive interventions on April 30 and May 1. Inside the same window BRENT jumped from 105.94 to 114.09, that is +7.69%, and gold slid from 4,707 to 4,616. Three moves, three different asset classes; but laid side by side they all write the same equation. The dollar pulled back its elbow, geopolitical premia loaded up, the rate-differential engine is still humming.
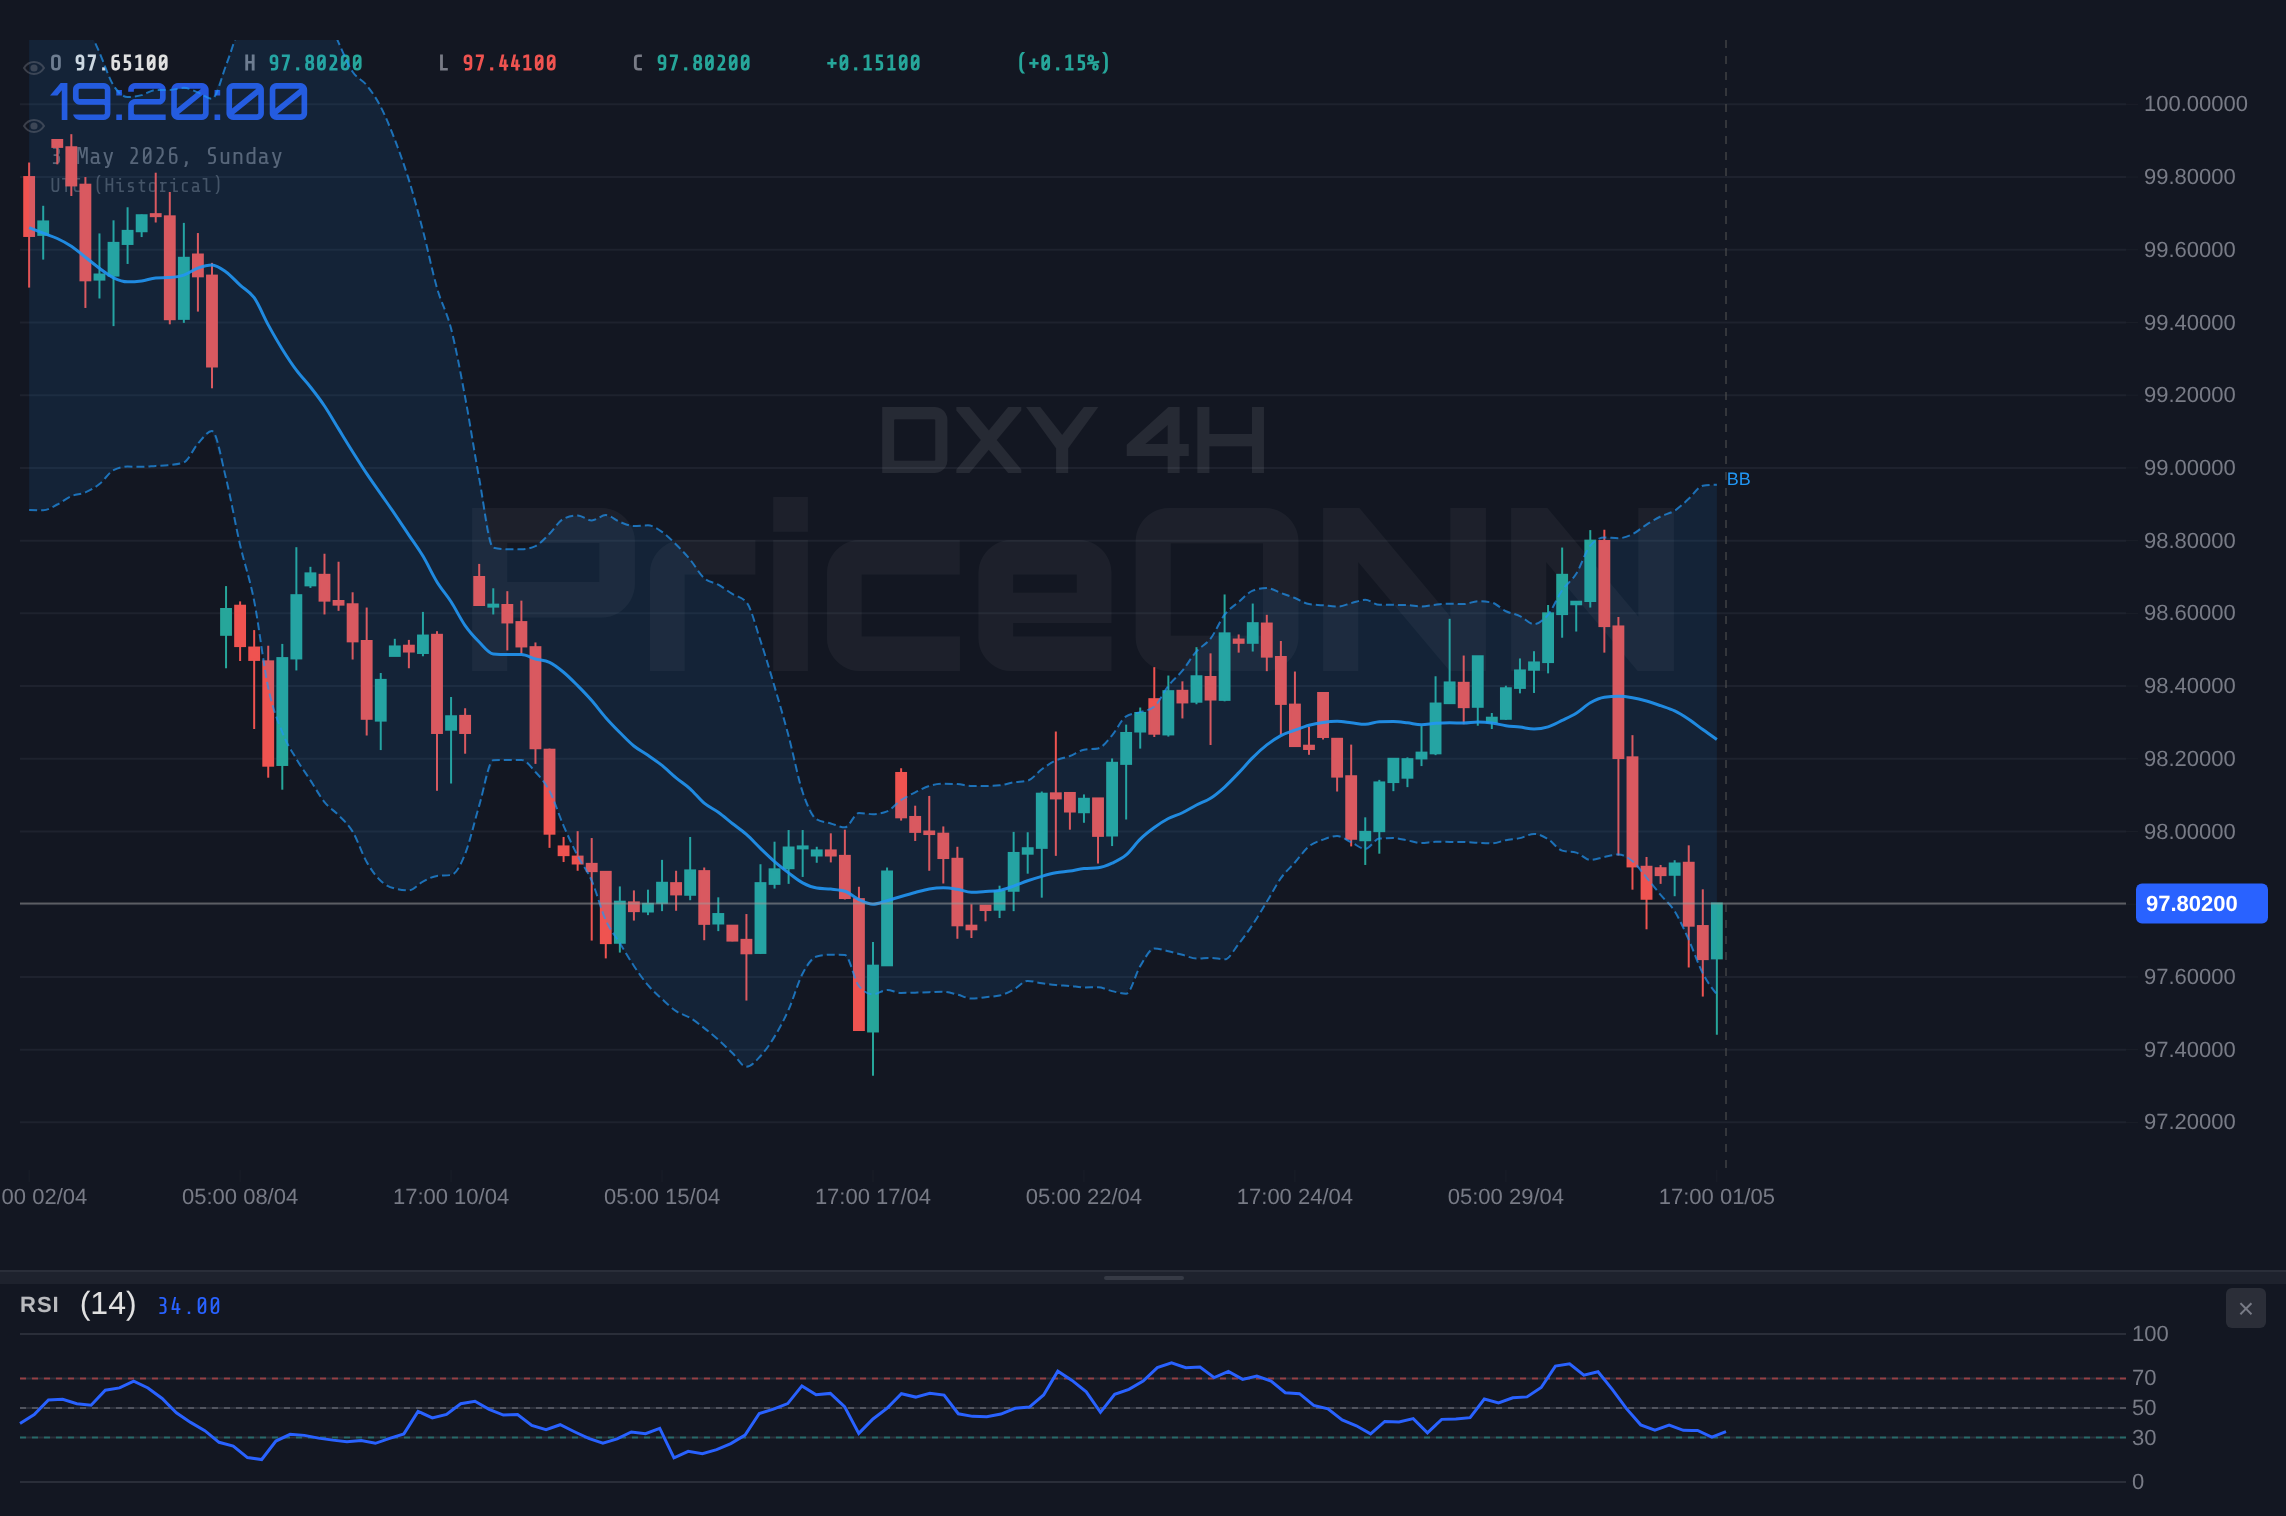
So we enter Week 19 with four high-importance US data blocks domestically and the silence over the Strait of Hormuz externally. As deceptive as it is quiet, because the real tension breaks open on Friday at 12:30 GMT.
Monday morning snapshot
The pricing into the Asian close looks like this:
| Symbol | Monday open | Last week | Move |
|---|---|---|---|
| XAUUSD | 4,616.26 | 4,707.98 → 4,616.26 | -1.95% |
| XAGUSD | 75.38 | flat-down | - |
| BRENT | 114.09 | 105.94 → 114.09 (high 117.92) | +7.69% |
| WTI | 103.65 | 96.98 → 103.65 | +6.88% |
| DXY | 97.943 | 98.227 → 97.943 | -0.29% |
| EURUSD | 1.17192 | 1.1654-1.1784 narrow | flat |
| USDJPY | 157.05 | 159.325 → 157.05 (high 160.719) | -1.43% |
| GBPUSD | 1.35713 | narrow | flat |
| BTCUSD | 78,750 | 78,455 → 78,701 | +0.31% |
| ETHUSD | 2,330 | 2,309 → 2,329 | +0.86% |
| SP500 | 6,572 | 6,572 support | flat |
| Nasdaq100 | 27,663 | bullish band | slight up |
The real story under these prices is not what each asset is doing on its own; it is how they are speaking to each other. So we will read them not one by one but in three separate correlation tables.
First correlation table: Yen and oil are two faces of the same equation
Start with the textbook bond. The Yen is traditionally a risk-off currency; oil is the classic inflation commodity. The two should normally show negative correlation; when oil rises USDJPY rises with it, because Japan is a net energy importer and pricier crude weighs on the trade balance and on the Yen.
Last week opened exactly that way. When BRENT printed 117.92, USDJPY printed 160.719. But the correlation broke on the evening of April 30. Tokyo stepped into the open market across two sessions and sold dollars. The Yen recovered 350 pips, oil stayed where it was. One gear of the machine was forced from outside.
The implication for this week is that the 156-158 USDJPY range is no longer mathematical, it is political. While it holds, every MoF statement, especially the BOJ Monetary Policy Minutes due Wednesday May 6 at 23:50 GMT, can put down a new floor. If a fresh Hormuz spark sends BRENT back to 117, Tokyo's defense line this time will not sit at 158 but at 159. Because every intervention has a cost. Japan's FX reserves are sizable but each round burns roughly 50-60 billion dollars; the intervention skirt eventually runs short.
The natural conclusion for the investor: hedging long-Yen positions against oil is not unreasonable. The real sustainability of Yen strength hinges on the BOJ moving toward policy divergence at the June meeting; the minutes this week are the first window into that hint.
Second correlation table: Gold pulled back, but the bullish story is still standing
Gold is the most deceptive asset of the week. A 1.95% weekly close sells as a headline, but read without the rest of the table the loss misleads. Because DXY also fell 0.29% in the same week. In the textbook equation gold should have risen as the dollar fell. It did not. Which means something else is in the room, and that something is most likely real yields.
With the persistent hawkish tone in the dot-plot released after Powell's farewell meeting, the US 10-year yield pushed up and real rates climbed. Real rates are gold's actual rival, not the nominal dollar. So this time gold was pricing the yield curve, not the greenback.
Two separate corridors open up for gold to find direction this week.
On Tuesday at 14:00 GMT the US ISM Services PMI is expected at 53.8 (prior 54.0) and ISM Prices at 70.7 (prior 70.7). ISM Prices is the critical print. It has been stuck above 70; that signals that inflation in the service sector is sticky. A headache for the Fed, a tailwind for gold via real rates. If it eases below 70 the Fed cut timeline pulls forward and gold tests 4,700 resistance.
Friday 12:30 GMT brings an NFP forecast of 73K (prior 178K). A surprise to the downside, say 40K or less, opens the stagflation story. Stagflation is gold's favorite macro setting: rates cannot rise because growth is weak, inflation cannot fall because the wage side is sticky. Average Hourly Earnings is already expected to lift from 0.2 to 0.3; that combination (weak NFP and strong AHE) is the perfect intersection for gold.
Market Compass's May 2 read is bullish on gold with 88% confidence; support 4,550, resistance 4,700. If either of those levels breaks this week, expect another 60-70 dollars of follow-through. Risk-reward should be re-examined from there.
Third correlation table: Oil, the OPEC+ rift, and the Hormuz premium
BRENT's jump last week was not the product of a single headline. It is a three-layered story.
Layer one is the producer-group fragmentation that started with the UAE exiting OPEC+. The UAE no longer adheres to Saudi discipline; that lames the cartel's marginal-supply tool. Layer two is the Strait of Hormuz still being practically closed; roughly one fifth of global oil flow passes through it. Layer three is Europe being forced back into Russian LNG by the energy crisis; the supply-diversification thesis has been turned on its head.
The main numerical print to track for oil this week is the EIA crude stocks release on Wednesday at 14:30 GMT. Prior draw was 6.234 million barrels. American stocks ate down rapidly last week. If it prints negative again BRENT walks back to the 117 target and Yen-side intervention becomes harder; Tokyo flew the flag at half mast twice in two days, a third move costs more both politically and financially.
The second oil signal is the Friday 17:00 GMT Baker Hughes rig count. Prior 408; if that drops, the medium-term supply tightness is still in place. That is the last link to carry the bullish-oil thesis into Saturday.
An interesting note: as oil printed such a strong weekly gain, gold melted in the same table. Yet the academic literature places them in the same inflation-hedge basket. So this week the market pulled some of the geopolitical premium out of gold and parked it in oil. The first place this rotation could reverse is NFP Friday, particularly if the print forces the Fed toward a cut.
Volatility and external signals
The week will not be steered by US data alone. Two risk gauges and one Asian print belong on the table.
VIX is sitting in the 18-20 zone, calm territory. Historically NFP weeks add 2-3 points on average; a jump above 22 is an alarm signal, a slide below 16 means the market is too relaxed about NFP. That itself creates a contrarian risk.
The MOVE Index is the bond market's VIX, measuring US Treasury volatility. The hawkish tone in the post-Powell yield curve has kept MOVE elevated. If MOVE rises while gold falls within the week, that is additional confirmation of the earlier point: gold is pricing real rates, not the dollar. If NFP comes in weak on Friday, the typical sequence is MOVE dropping first, then a gold rally.
On the Chinese side, the Caixin Services PMI lands Wednesday at 01:45 GMT. China's consumption demand is the only major demand-side cue for oil prices outside of the supply story. PMI staying above 50 helps BRENT defend levels above 114; a slip below 50 could trigger profit-taking in oil despite the Hormuz premium.
The week's calendar at a glance
Monday is quiet. European manufacturing PMIs print around 08:00 GMT, with France expected to jump from 50 to 52.8. On the US side there is Factory Orders at 14:00 GMT and FOMC's Williams speaking at 16:50 GMT. Williams is the first signal testing the post-Powell Fed line. If the tone shifts hawkish, DXY presses above 98.
Tuesday is the first heavy data day. Lagarde speaks at 12:30 GMT, S&P Global Services PMI lands at 13:45 GMT, and ISM, JOLTS, and New Home Sales drop simultaneously at 14:00 GMT. That window alone can pull the week's direction forward by a step. JOLTS prior 6.882 million, forecast 6.87 million. A drop below 6.5 million would feed the "labor market cooling" narrative, which has already been the dominant theme of the past few weeks.
Wednesday morning brings European services PMIs at 08:00 GMT. Eurozone is sitting at 47.4, in contraction territory; if the figure slips below 47 ECB doves accelerate. ADP employment at 12:15 GMT, EIA crude at 14:30 GMT. BOJ Minutes at 23:50 GMT.
Thursday is the calmer day. Initial Jobless Claims (prior 189K, forecast 203K) and Unit Labor Costs (prior 4.4%, forecast 2.5%) at 12:30 GMT. The latter, if it lands, is good news for the Fed, meaning wage inflation is softening. Schnabel and Williams speak in the evening.
Friday is where the entire week was written. Lagarde at 07:00 GMT, BoE Governor Bailey at 12:20 GMT, NFP block at 12:30 GMT, Michigan Sentiment at 14:00 GMT. NFP forecast 73K, prior 178K, unemployment steady at 4.3%. AHE expected to rise from 0.2 to 0.3.
NFP scenario table
Every trader should have this table in their wallet:
| NFP actual | DXY | XAUUSD | SP500 | USDJPY | BTC | BRENT |
|---|---|---|---|---|---|---|
| Above 110K | Above 98.5 | 4,550 support | 6,620+ | Above 158.5 | Below 77K | 112-115 flat, demand confirmed |
| 60-90K | 97.7-98.1 flat | 4,600-4,650 | range | range | range | 113-116 narrow |
| Below 40K | 97.0-97.5 | Above 4,700 | mix, Fed-cut hope | Below 156 | Above 80K | 116-118, demand-weakness fear |
| Below 0K | 96.5 capitulation | 4,750+ rally | shock first, then rally | Below 155, intervention trigger | Above 82K | down to 110 first, then 118+ on Hormuz premium |
The most important row is the bottom one. Note that a negative NFP would draw a two-wave reaction in oil: the first leg down on recession fears, the second leg up on the Fed-cut rotation and a re-loading of the geopolitical premium. Timing is everything here.
What the correlations say
Three traditional bonds from the textbook.
The DXY-gold negative correlation is classic. Both fell last week; this break is either temporary noise or the first sign of a structural shift. If NFP comes in weak this week and DXY falls below 97 while gold fails to break 4,700, the second case strengthens; the market is pricing gold no longer as the conventional anti-dollar but as the anti-yield.
USDJPY and the UST 10-year positive correlation. This engine is still running. Last week's intervention only suppressed it, did not turn it off. As long as the rate differential stays positive USDJPY's natural direction is up; the 156-158 band is a false floor.
The oil-SP500 correlation has been neutral for the last three months. Energy shocks used to be negative for stocks; but the current price increases are supply-shock not demand-shock. Until margins are hit there is no panic wave in indices. The day this correlation could change is the day a data set forces the Fed into a tighter corner, which NFP could deliver.
Bitcoin entered the table in an interesting way recently. BTC has been consolidating in the 78-79 thousand zone for weeks. The consolidation is not a crypto-specific story; it is part of the risk-on/risk-off machine. If NFP comes in weak, the Fed-cut hope nudges BTC indirectly because falling real rates create a faster bid for BTC than they do for gold. Above 80,000 the "100K back on the table" narrative finds momentum.
What to put in the Monday bag
A three-layered approach makes sense for the week.
Light positioning into Tuesday. Opening a big directional bet ahead of the ISM and JOLTS block carries the risk of an instant loss on a data surprise.
Build in stages on Wednesday. After the ADP and EIA block confidence in the NFP direction reaches sixty to seventy percent. The first technical trigger for oil and gold is meaningful at this stage.
Pull half the position on Thursday. Friday morning into NFP the market trades cash-heavy; banking some profit and waiting on the data is rational.
After Friday both directions remain open. If NFP is weak the basket is gold long, USDJPY short, BTC long. If strong, the hedge basket of DXY long, EURUSD short, Nasdaq short kicks in. Both baskets should be ready in advance; the actual entry should come after the print.
Final word
This is a week that opens quietly and closes loud. While reading the Monday open, look less at the numbers themselves and more at the bonds between them. The Yen may be standing at 157 but as long as BRENT holds at 114 the balance is fragile. Gold may be cooling at 4,616 but as long as ISM Prices stays at 70 the real-rate pressure persists. VIX may be sitting at 18 but an NFP week creates its own mathematical incentive for that figure to change.
At 12:30 GMT on Friday these three tables converge into a single answer: is the US economy on a soft landing or a hard one? The answer will set not just prices at the end of Week 19 but the direction of the narrative.
This week it is not the numbers that matter, it is the tension between them. Whoever watches that tension wins.
Data source: PriceONN live quotes, Market Compass, and economic calendar feed. This content is not investment advice.
Track markets in real-time
AI-powered analysis, technical indicators and real-time price data.
Join Our Telegram Channel
Breaking market news, AI analysis and trading signals instantly.
Join Channel