Weekly Market Review - Week 17 (April 20, 2026 – April 24, 2026): Dollar Weakens, Gold Firms, Oil Dips
Week 17 (April 20-24, 2026) market review: The US Dollar weakened, Gold firmed, and energy markets dipped. Key technical and economic factors analyzed.
Weekly Market Review: April 20, 2026 – April 24, 2026 (Week 17)
Executive Summary
The trading week of April 20-24, 2026, saw a notable shift in market sentiment, characterized by a weakening US Dollar, a firming Gold price, and a dip in energy markets. The US Dollar Index (DXY) closed the week down 0.31% at 98.236, influenced by softer economic data and a general risk-on appetite. Gold prices exhibited resilience, closing the week up 0.31% at $4,708.36, finding support near the $4,654.24 level. Energy commodities experienced a downturn, with WTIcrude oil falling 2.15% to $97.07 and Brent crude down 0.69% to $106.04, despite some geopolitical tensions, suggesting supply factors and demand outlooks were more dominant. Major stock indices like the S&P 500 and Nasdaq 100 posted gains, reflecting continued strength in equity markets, though the S&P 500 showed signs of daily weakness with a SELL signal on the daily timeframe.
US Dollar & DXY Analysis
The US Dollar faced headwinds throughout the week, culminating in a weekly decline. The Dollar Index (DXY) closed at 98.236, down 0.31% for the week. Technical indicators across multiple timeframes suggested a bearish bias. On the 1-hour timeframe, RSI was at 38.6, indicating a potential oversold condition, while the MACD histogram showed a negative -0.03 reading, pointing to bearish momentum. The 4-hour chart presented a similar picture with RSI at 49.9, nearing the neutral zone, and a MACD histogram of -0.01. The daily timeframe displayed an RSI of 46.6 and a MACD histogram of -0.04, both reinforcing a bearish sentiment. The ADX remained at 1.0 across all monitored timeframes, indicating a lack of strong trend. The Bollinger Bands on the daily chart showed the price trading below the middle band, with the upper band at 100.20 and the lower band at 97.110, suggesting room for further downside. The weekly sentiment was predominantly SELL, with a strength of 90%, supported by SELL signals on the 1-hour, 4-hour, and daily charts.
Resistance
Price
R3
99.13
R2
98.89
R1
98.72
Pivot
98.48
Support
Price
S1
98.30
S2
98.06
S3
97.89
Fib 61.8%
97.97
Forex Majors Review
EUR/USD concluded the week at 1.17223, marking a gain of 0.34%. The pair demonstrated consistent bullish momentum across timeframes. The 1-hour RSI stood at 62.5, the 4-hour at 48.9, and the daily at 54.5. The MACD histogram was positive across all timeframes, indicating upward pressure. The Stochastic %K on the 1-hour was in overbought territory at 86.2, while the DXY's weakness provided a supportive backdrop. The overall sentiment was BUY with a strength of 85%, reflected in BUY signals on 1-hour, 4-hour, and daily charts.
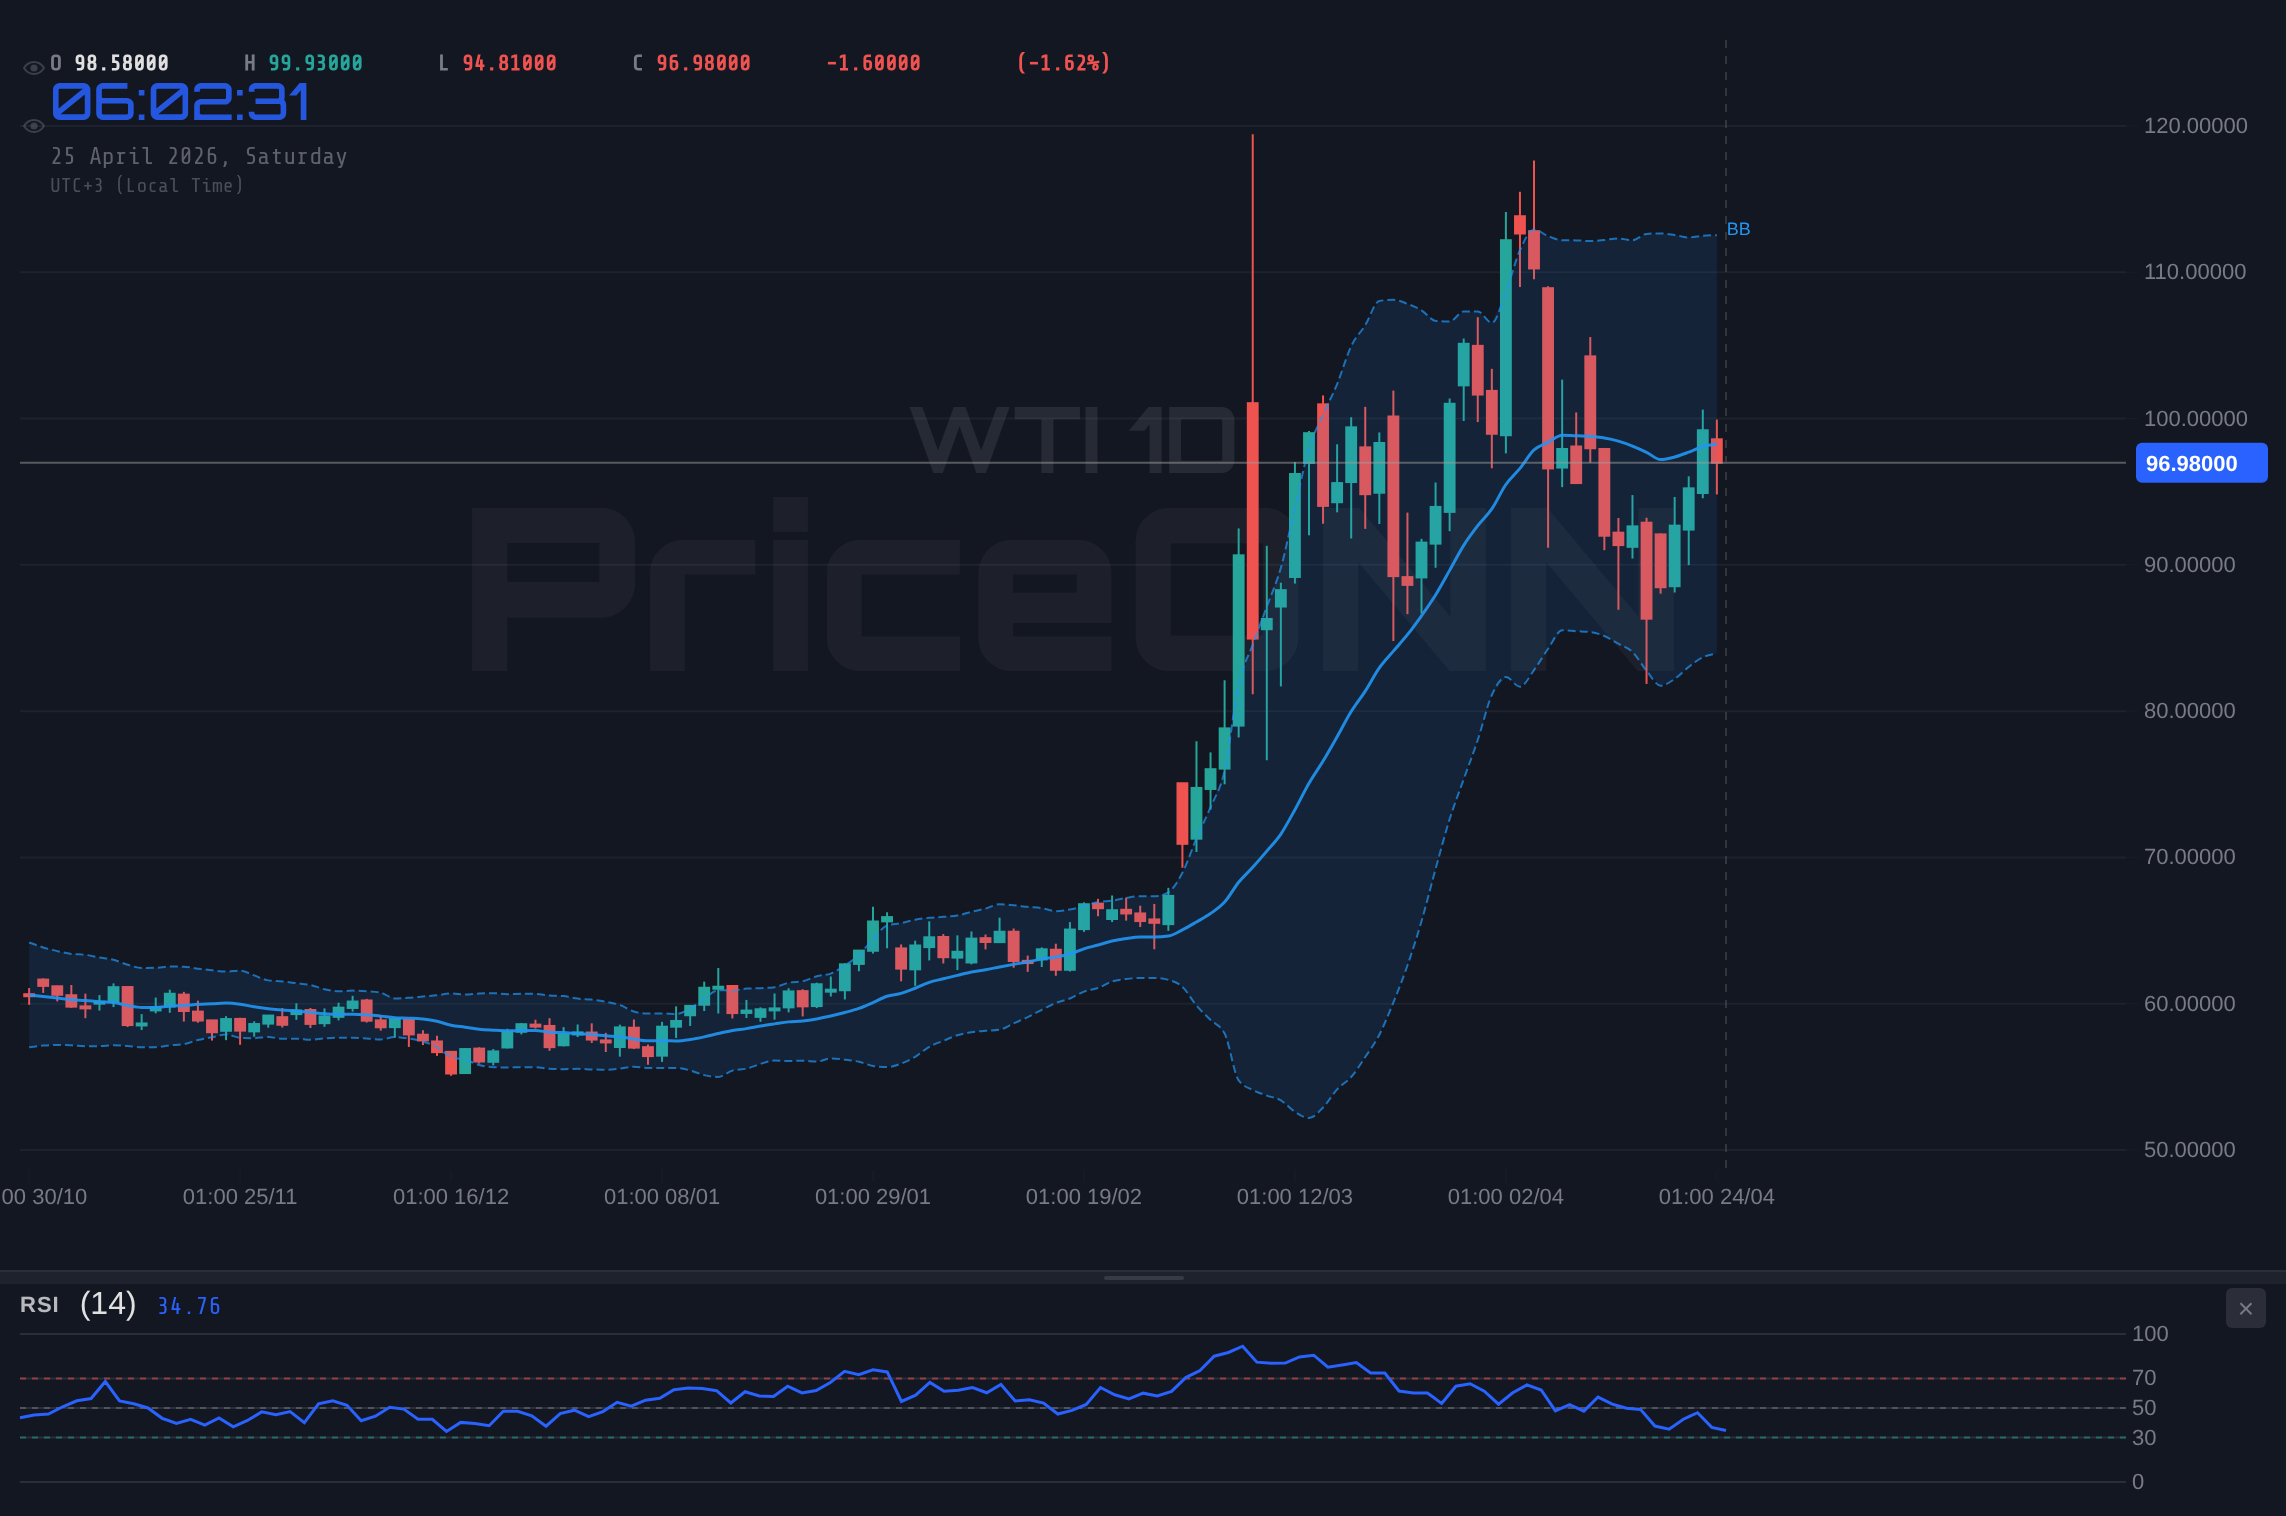
WTI 4H Chart
Resistance
Price
R3
1.17567
R2
1.17363
R1
1.17093
Pivot
1.16889
Support
Price
S1
1.16619
S2
1.16415
S3
1.16145
Fib 61.8%
1.17000
GBP/USD appreciated by 0.54% to close at 1.35372. The Sterling showed robust strength, with a 1-hour RSI at 73.4 entering overbought territory, and a daily RSI of 58.6. The Stochastic %K on the 1-hour reached 95.2, signaling strong upward momentum. The MACD histogram was positive on all timeframes, supporting the bullish trend. The ADX was at 1.0, indicating a lack of strong directional trend. The overall sentiment was BUY with a strength of 84%, driven by BUY signals across 1-hour, 4-hour, and daily charts.
Resistance
Price
R3
1.35765
R2
1.35468
R1
1.35059
Pivot
1.34762
Support
Price
S1
1.34353
S2
1.34056
S3
1.33647
Fib 61.8%
1.35000
USD/JPY depreciated by 0.2% to 159.34. The pair displayed mixed signals across different timeframes. The 1-hour RSI was 38.1, suggesting bearish momentum, while the 4-hour RSI was 48.9, nearing neutrality. The daily RSI stood at 53.8, indicating a slightly bullish leaning. The MACD histogram was negative on the 1-hour (-0.04) and 4-hour (-0.02) charts, contrasting with a positive reading on the weekly chart. The overall sentiment was SELL with a strength of 83%, primarily driven by the short-term SELL signals on the 1-hour and 4-hour charts, despite a BUY signal on the daily.
Resistance
Price
R3
160.45
R2
160.14
R1
159.90
Pivot
159.60
Support
Price
S1
159.36
S2
159.05
S3
158.81
Fib 61.8%
155.56
AUD/USD gained 0.37% to close at 0.71529. The pair showed consistent bullish strength. The 1-hour RSI was 58.8, with the daily RSI at 60.3, both in bullish territory. The MACD histogram was positive across all timeframes. The Stochastic %K on the 1-hour was 83.1, indicating strong upward momentum. The overall sentiment was BUY with a strength of 88%, supported by BUY signals on 1-hour, 4-hour, and daily charts.
Resistance
Price
R3
0.72138
R2
0.71897
R1
0.71583
Pivot
0.71342
Support
Price
S1
0.71028
S2
0.70787
S3
0.70473
Fib 61.8%
1.17000
NZD/USD advanced by 0.54% to end the week at 0.58823. The pair displayed mixed short-term signals but a generally positive daily outlook. The 1-hour RSI was 61.0, while the 4-hour RSI was 49.1, nearing neutrality. The daily RSI was 54.5. The MACD histogram was positive on the daily chart, supporting the bullish sentiment, but neutral on the 4-hour. The overall sentiment was BUY with a strength of 82%, driven by the daily BUY signal, despite a neutral signal on the 4-hour timeframe.
Resistance
Price
R3
0.59629
R2
0.59358
R1
0.58934
Pivot
0.58663
Support
Price
S1
0.58239
S2
0.57968
S3
0.57544
Fib 61.8%
0.59000
Precious Metals
Gold (XAUUSD) closed the week at $4,708.36, a modest increase of 0.31%. The weekly chart showed a BUY signal, indicating long-term positive sentiment, while the daily and 4-hour charts exhibited SELL signals. The 1-hour RSI was 50.4, the daily RSI was 46.4, and the weekly RSI was 54.8. The MACD histogram on the daily chart was positive at +6.87, but the 4-hour histogram was negative at -1.25. Gold traded near its 1-hour Bollinger Band lower limit, suggesting short-term consolidation. The overall sentiment leaned towards SELL with a strength of 85% due to the prevailing daily and 4-hour sell signals, despite the weekly buy signal.
Resistance
Price
R3
4,833.20
R2
4,793.41
R1
4,743.72
Pivot
4,703.93
Support
Price
S1
4,654.24
S2
4,614.45
S3
4,564.76
Fib 61.8%
4,914.68
Silver (XAGUSD) finished the week at $75.689, up 0.39%. The weekly chart indicated a BUY signal, while the daily and 4-hour charts showed SELL signals. The 1-hour RSI was 49.3, the daily RSI was 47.4, and the weekly RSI was 53.3. The MACD histogram on the daily chart was positive at +0.28, but the 4-hour histogram was negative at -0.13. Silver was trading within its 1-hour Bollinger Bands, with the upper band at 76.740 and the lower band at 74.140. The overall sentiment was SELL with a strength of 81%, driven by the prevailing daily and 4-hour sell signals, despite the weekly buy signal.
Resistance
Price
R3
81.870
R2
80.090
R1
77.740
Pivot
75.970
Support
Price
S1
73.620
S2
71.850
S3
69.500
Fib 61.8%
82.830
Energy Markets
Brent Crude Oil declined by 0.69% to close at $106.04. The weekly chart displayed a BUY signal, while the daily chart also showed a strong BUY signal. The 1-hour RSI was 56.2, and the daily RSI was 57.3, both in bullish territory. The MACD histogram on the 1-hour chart was negative at -0.18, but positive on the 4-hour at +0.24. The ADX was at 1.0 across all timeframes, indicating a lack of strong trend. Brent traded within its 1-hour Bollinger Bands, with the upper band at 107.28 and the lower band at 104.08. The overall sentiment was BUY with a strength of 88%, driven by the consistent daily and weekly BUY signals.
Resistance
Price
R3
114.75
R2
111.26
R1
109.02
Pivot
105.53
Support
Price
S1
103.29
S2
99.80
S3
97.56
Fib 61.8%
87.24
WTI Crude Oil experienced a more significant drop, closing down 2.15% at $97.07. The weekly and daily charts both showed BUY signals, but the 1-hour chart was NEUTRAL. The 1-hour RSI was 48.9, and the daily RSI was 53.5. The MACD histogram was negative on the 1-hour (-0.31) and daily (-0.84) charts, indicating bearish momentum in the short to medium term. WTI traded near its 1-hour Bollinger Band lower limit, with the upper band at 100.39 and the lower band at 95.32. The overall sentiment was BUY with a strength of 76%, supported by the weekly and daily BUY signals, despite the neutral short-term signal.
Resistance
Price
R3
107.75
R2
104.18
R1
101.69
Pivot
98.12
Support
Price
S1
95.63
S2
92.06
S3
89.57
Fib 61.8%
83.89
Cryptocurrency Update
Bitcoin (BTCUSD) closed the week at $77,624, a slight decrease of 0.34%. The weekly chart showed a SELL signal, while the daily chart displayed a BUY signal. The 1-hour RSI was 46.6, indicating bearish momentum, and the 4-hour RSI was 53.3. The MACD histogram on the daily chart was strongly positive at +353.08, supporting the bullish case from that perspective, but the 1-hour and 4-hour histograms were negative (-33.00 and -128.78 respectively). Bitcoin traded below its 1-hour SMA 20 at 77,753. The overall sentiment was SELL with a strength of 80%, influenced by the conflicting signals and the weekly SELL signal.
Resistance
Price
R3
80,688
R2
79,757
R1
78,824
Pivot
77,893
Support
Price
S1
76,960
S2
76,029
S3
75,096
Fib 61.8%
70,532
Ethereum (ETHUSD) finished the week at $2,316.76, down 0.27%. The weekly chart indicated a SELL signal, while the daily chart showed a BUY signal. The 1-hour RSI was 48.9, and the 4-hour RSI was 45.9, both in bearish territory. The MACD histogram on the daily chart was negative at -1.58, suggesting waning bullish momentum. Ethereum traded below its 1-hour SMA 20 at 2,315.24 and its 1-hour EMA 12 at 2,315.57. The overall sentiment was BUY with a strength of 77%, primarily driven by the daily BUY signal, despite conflicting signals on other timeframes.
Resistance
Price
R3
2,511.50
R2
2,457.60
R1
2,390.27
Pivot
2,336.37
Support
Price
S1
2,269.04
S2
2,215.14
S3
2,147.81
Fib 61.8%
2,119.67
Stock Indices
S&P 500 closed the week at 6,573, posting a gain of 0.74%. The index showed strong bullish momentum on the 1-hour and 4-hour charts, with BUY signals and high RSI values (71.0 and 62.8 respectively). However, the daily chart presented a SELL signal, with an RSI of 45.4. The MACD histogram on the 1-hour was -0.36, but on the 4-hour it was positive at +27.63. The overall sentiment was BUY with a strength of 83%, driven by the short-term bullish signals, but the daily SELL signal warrants caution.
Resistance
Price
R3
6,833
R2
6,686
R1
6,605
Pivot
6,458
Support
Price
S1
6,377
S2
6,231
S3
6,150
Fib 61.8%
6,744
Nasdaq 100 demonstrated significant strength, closing up 1.9% at 27,302. The index showed consistent BUY signals across all timeframes. The 1-hour RSI was 72.6, and the daily RSI was 76.1, both firmly in overbought territory. The MACD histogram was positive on all timeframes, indicating strong upward momentum. The overall sentiment was BUY with a strength of 86%, reflecting broad bullish conviction.
Resistance
Price
R3
27,489
R2
27,247
R1
27,020
Pivot
26,778
Support
Price
S1
26,551
S2
26,309
S3
26,082
Fib 61.8%
24,515
Dow Jones 30 closed at 49,262, a modest gain of 0.11%. The index exhibited strong BUY signals across all monitored timeframes. The 1-hour RSI was 52.6, and the daily RSI was 65.6, both indicating bullish sentiment. The MACD histogram was positive on the 1-hour (+6.52) and daily (+189.60) charts. The overall sentiment was BUY with a strength of 91%, reflecting sustained positive momentum.
Resistance
Price
R3
50,191
R2
49,856
R1
49,532
Pivot
49,197
Support
Price
S1
48,873
S2
48,538
S3
48,214
Fib 61.8%
47,949
Economic Calendar Impact
The completed economic events this week provided some context for market movements, though actual data releases were sparse for high-impact USD events. The absence of actual figures for U.S. Manufacturing and Services PMI, Initial Jobless Claims, and Crude Oil Inventories limited direct impact analysis. Similarly, U.S. Core and headline Retail Sales figures were not reported with actuals, preventing surprise assessments. The U.K. Consumer Price Index (CPI) YoY was forecasted at 3.3%, but no actual figure was provided, leaving its impact on GBP undetermined from the data.
Week in Summary
Week 17 of 2026 saw a complex interplay of factors shaping market performance. The US Dollar's weakening trend provided a tailwind for riskier assets and commodities, although energy markets experienced a decline despite some geopolitical concerns. Gold showed resilience, holding its ground near key support levels. Equity markets, particularly the Nasdaq 100 and Dow Jones, continued their upward trajectory, with the S&P 500 also gaining but showing some daily caution. The cryptocurrency market presented mixed signals, with Bitcoin and Ethereum showing divergent trends across different timeframes, indicating a period of consolidation or indecision. The lack of concrete economic data surprises limited the ability to attribute sharp market moves to specific releases, suggesting broader technical and geopolitical factors were more influential this week. The dominant theme was the shift away from the dollar, benefiting other major currencies and precious metals, while oil prices faced downward pressure.
Disclaimer: This content is for informational and educational purposes only and does not constitute investment advice, financial recommendation, or an offer to buy or sell any financial instrument. Past performance does not guarantee future results. Always do your own research and consult a licensed financial advisor before making investment decisions.
Track markets in real-time
AI-powered analysis, technical indicators and real-time price data.
We are looking for writers who produce market analysis, macro commentary, and data-driven content. Reach readers in 10 languages through our multilingual publishing platform.