

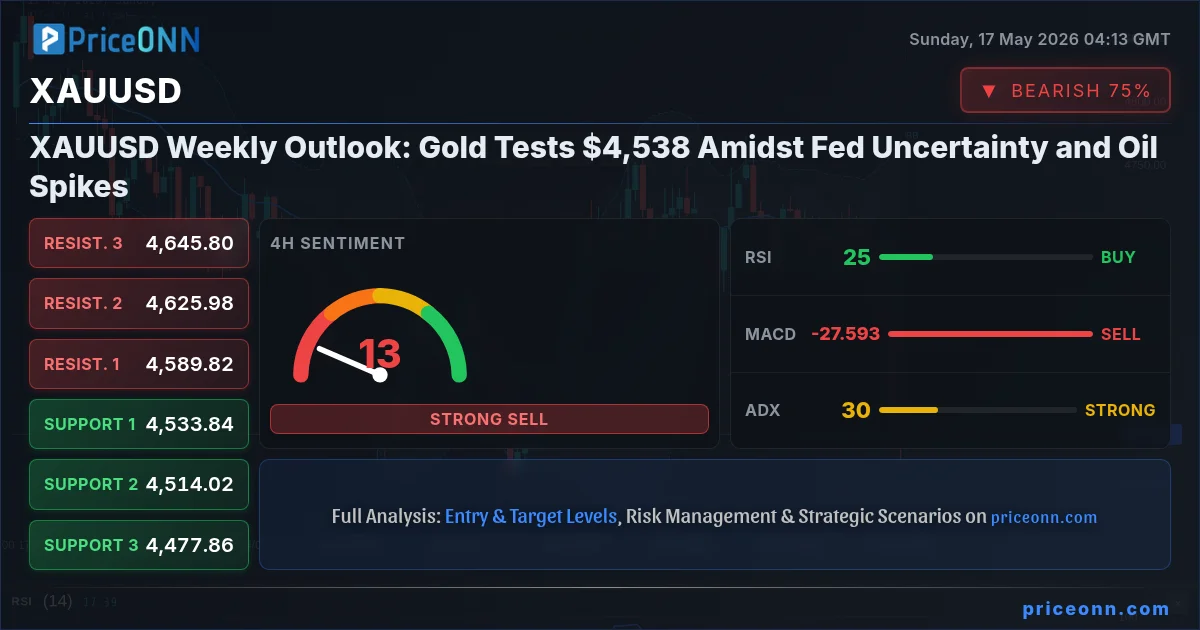
The battleground for gold traders this week is firmly set around the $4,538 mark. As the dust settles from a volatile trading period, XAUUSD finds itself at a critical juncture, caught between persistent inflation fears amplified by surging oil prices and the looming shadow of the Federal Reserve's next monetary policy move. Last Friday, gold closed down significantly, a sharp retreat that has traders and analysts alike scrutinizing the charts and economic calendar for clues on the path ahead. The question on everyone's mind is whether this bearish slide is a temporary pause or the start of a deeper correction, especially as geopolitical tensions continue to simmer, traditionally a tailwind for the precious metal.
- RSI at 25.75 on the 1H chart signals extreme oversold conditions, suggesting a potential short-term bounce opportunity for gold.
- Critical support for XAUUSD sits at $4,524.02, a level that must hold to prevent further downside pressure.
- The ADX at 45.94 on the 1H timeframe indicates a strong existing downtrend, suggesting any bounce might be met with selling pressure.
- Market sentiment is heavily influenced by Fed rate expectations, with traders awaiting the FOMC minutes for policy direction, impacting XAUUSD's correlation with the DXY.
The narrative driving gold's recent weakness is complex, a confluence of factors that have pushed the shiny metal down nearly 2.45% on the day, closing near $4,538.03. This significant drop below key psychological and technical levels underscores the prevailing bearish sentiment in the short term. The 1-hour chart paints a stark picture: a strong downtrend with an ADX reading of 45.94, indicating substantial directional force. However, the RSI(14) at 25.75 is flashing an extreme oversold signal, hinting that the immediate selling pressure might be nearing exhaustion, even if the overarching trend remains firmly down. This divergence between trend strength and oversold conditions is precisely where trading opportunities, albeit risky ones, often emerge.
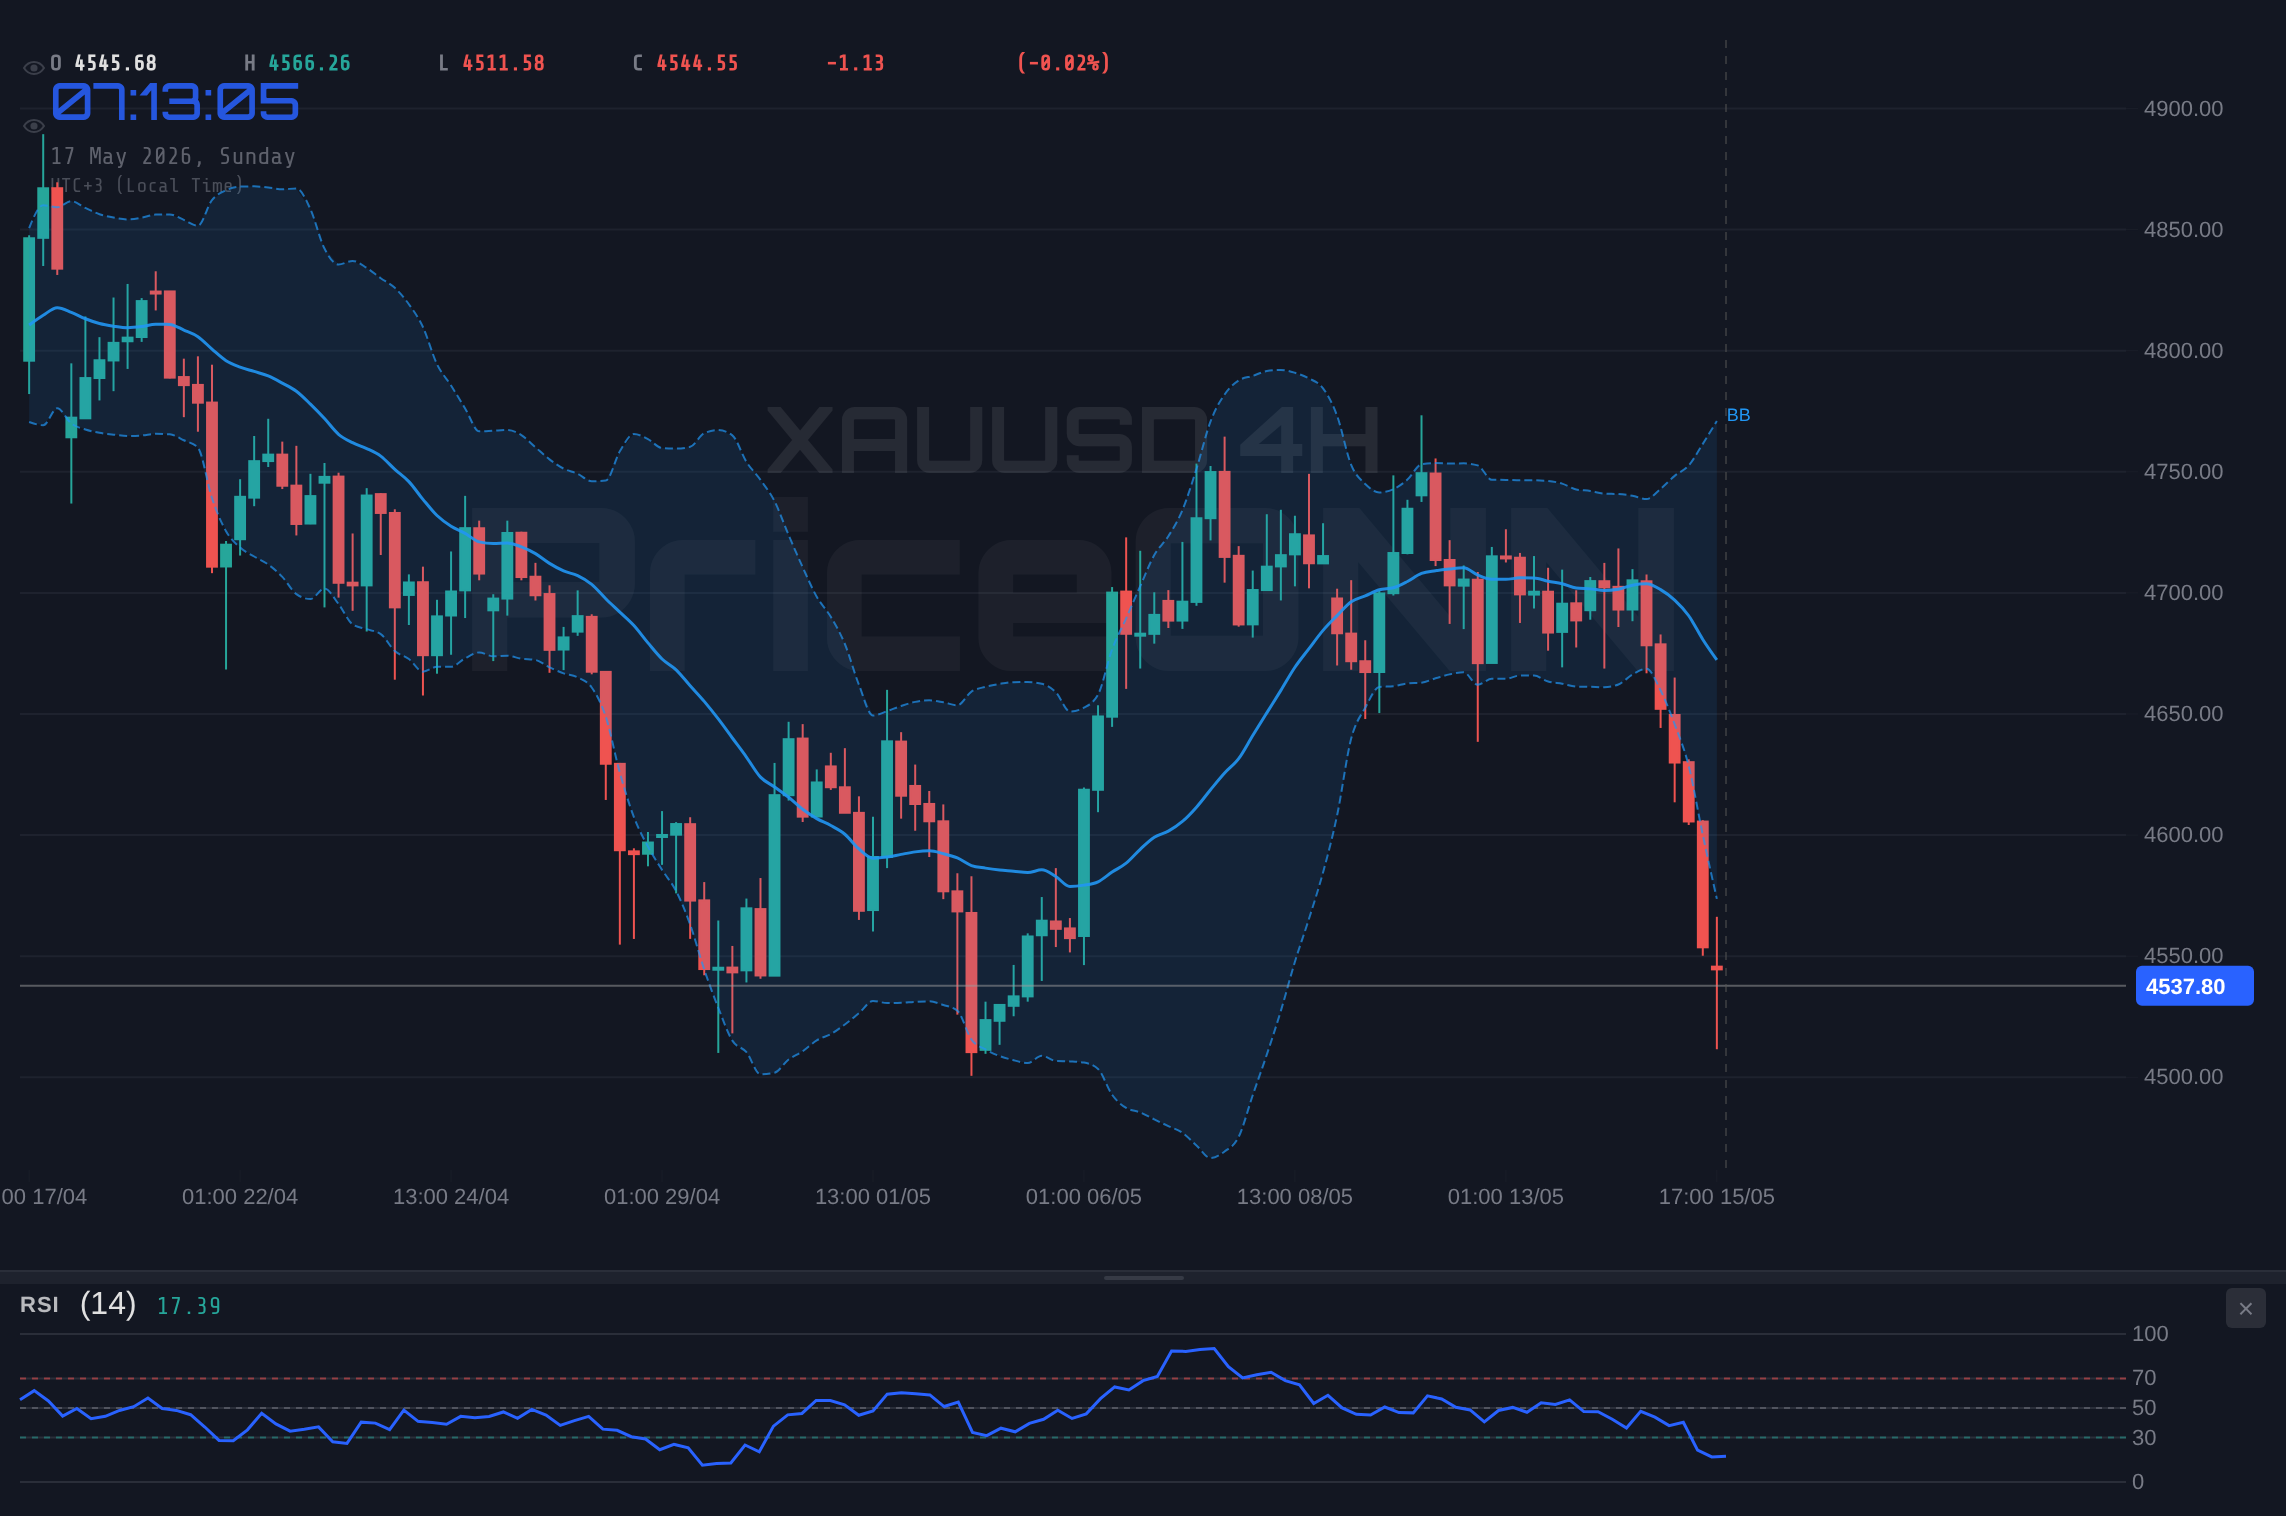
Looking at the broader technical landscape, the 4-hour timeframe reinforces the bearish outlook. The trend remains decidedly downwards with 100% strength, and the price is hugging the lower Bollinger Band, a classic sign of strong selling pressure. The ADX here, while lower than on the 1H chart at 29.74, still signifies a robust trend. Yet, even within this bearish structure, the Stochastic oscillator is deeply oversold, with %K at 5.38 and %D at 19.79. This suggests that, technically, the market is showing signs of capitulation, where sellers might be running out of steam, at least temporarily. The crucial question is whether these oversold conditions will translate into a meaningful bounce or if the relentless selling pressure will simply push the price to new lows, further testing the support levels identified around $4,533.84.
The daily chart presents a slightly more nuanced, though still predominantly bearish, picture. The trend is officially classified as 'Düşüş' (Downtrend) with 83% strength. While the RSI(14) at 39.28 is in neutral territory, it still leans towards the lower end, indicating a lack of bullish conviction. The MACD, however, shows positive momentum with its histogram above the signal line, a potential divergence from the shorter timeframes. This could be a sign that the longer-term trend might not be as decisively bearish as the intraday charts suggest, or it could simply be lagging price action. The Bollinger Bands remain below the middle band, and the ADX at 16.77 points to a weak trend, suggesting that the daily timeframe might be entering a consolidation phase or preparing for a potential reversal if key levels are defended. This conflict between short-term selling pressure and longer-term technical signals is the crux of the current market tension.
The Case for the Bears: Why Gold is Under Pressure
The bearish argument for gold is multifaceted, drawing strength from both technical indicators and macroeconomic undercurrents. The sheer momentum captured on the shorter timeframes is undeniable. On the 1-hour chart, the trend strength is at a maximum 100%, with the ADX at a formidable 45.94. This isn't just a trend; it's a dominant force. The RSI's dive to 25.75, while signaling oversold, often precedes further downside in strong trends as sellers push the price lower until exhaustion finally sets in. The MACD also remains firmly in negative territory, confirming the prevailing bearish momentum. Key support levels at $4,544.32 and $4,536.85 are being tested, and a decisive break below these could trigger a cascade of stop-loss orders, accelerating the descent towards the $4,524.02 level.
Furthermore, the correlation with the US Dollar Index (DXY) cannot be ignored. The DXY itself is showing strength, indicated by its 1-hour trend at 100% and an ADX of 52.56, pushing towards the 99.03 level. Historically, a strengthening dollar often exerts downward pressure on gold prices, as it becomes more expensive for holders of other currencies. The current situation, where the dollar is showing resilience while gold falters, aligns with this inverse relationship. The recent news flow also supports a risk-off sentiment that might favor the dollar over gold, at least in the short term. Reports suggest that traders are anticipating a hawkish tone from the upcoming FOMC minutes, which would typically bolster the dollar and weigh on gold.
On the 4-hour chart, the bearish picture is reinforced. The trend remains firmly down, with the price trading below the lower Bollinger Band. This suggests a potential for a 'boiling the frog' scenario, where the selling is gradual but persistent, leading to significant losses over time. The ADX at 29.74 still indicates a strong trend, and the deeply oversold Stochastic levels could simply be a precursor to further capitulation rather than a reversal signal. The support levels at $4,533.84 and $4,514.02 are critical. A failure to hold these could open the door to the next major support zone at $4,477.86, a level not seen in some time. The general signal across multiple timeframes leans heavily towards 'SELL', reflecting the dominant bearish sentiment in the market.
The fundamental narrative also plays into the bears' hands. While oil prices have surged, potentially fueling inflation fears that usually support gold, the market's reaction has been complex. The recent PriceONN market news indicated that gold dipped below $4,620 despite oil skyrocketing past $106, suggesting that other factors are currently overriding the typical inflation hedge narrative. This could be due to a stronger dollar, anticipation of tighter monetary policy, or simply a market that is more focused on rate hikes than inflation hedges at this precise moment. The confirmation of Kevin Warsh as the new Fed Chair, as reported, could signal a more hawkish stance, which would generally be negative for gold prices. This combination of technical weakness and a potentially unfavorable macro environment provides a strong foundation for the bearish case.
The Case for the Bulls: Signs of a Potential Reversal
Despite the overwhelming bearish technical signals on shorter timeframes, there are glimmers of hope for the bulls, primarily stemming from the extreme oversold conditions and the potential for a shift in market sentiment. The 1-hour RSI at 25.75 is a significant data point. Readings below 30 are traditionally considered oversold, and often precede a bounce, especially if buyers step in to take advantage of perceived value. While the trend is strong, markets rarely move in a straight line, and a short-term correction or consolidation is a natural part of any trend. The Stochastic oscillator on the 1H chart, showing %K (22.26) above %D (15.57), is actually flashing a bullish crossover, indicating a potential shift in momentum, even if it's against the dominant trend.
The daily chart offers the most compelling argument for the bulls, primarily due to the MACD showing positive momentum with its histogram above the signal line. This divergence between the daily MACD and the shorter-term bearish signals could be a precursor to a larger trend change. If gold can hold the current support levels, particularly around $4,544.32 and $4,536.85, it might signify a floor being established. The ADX on the daily timeframe is a low 16.77, indicating a weak trend, which could mean that the current downward move is losing steam and a period of consolidation or reversal is possible. A break back above the middle Bollinger Band on the daily chart would be a significant bullish confirmation, suggesting that the selling pressure is abating.
Furthermore, the macroeconomic backdrop, while currently favoring the dollar, could shift. If the upcoming FOMC minutes are interpreted as less hawkish than expected, or if inflation data continues to surprise to the upside, gold could find renewed strength as an inflation hedge. The surge in oil prices, despite its current muted effect on gold, is a persistent inflationary pressure. If this translates into broader consumer price increases, central banks might be forced into a policy dilemma, potentially supporting gold. The geopolitical risks, such as ongoing tensions in the Middle East, also provide a background hum of uncertainty that historically benefits gold as a safe-haven asset. While these factors are not currently dominating the price action, they represent potential catalysts for a bullish turn.
From a risk management perspective, the current oversold levels present a compelling risk/reward scenario for contrarian buyers. If the bulls can defend the $4,536.85 support level, a move back towards the $4,564.62 resistance could offer a quick profit. The invalidation point would be a clear break below the $4,524.02 level. This strategy relies on the assumption that the current selling pressure is overextended and that the market will revert to the mean or react to the extreme oversold technicals. The potential for a short squeeze, should the bulls manage to regain control, cannot be discounted, especially if key resistance levels are breached with conviction and volume.
Navigating the Levels: Key Price Action to Watch
The immediate focus for gold traders will be the price action around the $4,538 level. The 1-hour chart's immediate support is found at $4,544.32 and $4,536.85. A failure to hold these levels could lead to a test of the $4,524.02 support. On the resistance side, the $4,564.62 level is the first hurdle, followed by $4,577.45 and $4,584.92. A decisive break above $4,584.92 would start to challenge the bearish narrative on the shorter timeframes.
The 4-hour chart provides broader reference points. Support lies at $4,533.84, $4,514.02, and a more significant level at $4,477.86. Resistance is seen at $4,589.82, $4,625.98, and potentially $4,645.8. These levels will be crucial in determining the medium-term direction. A break below $4,514.02 could signal a continuation of the sharp downtrend, while holding above $4,589.82 might indicate the beginning of a stabilization or recovery.
On the daily chart, the key support levels are $4,624.79, $4,597.45, and $4,550.67. These are the levels that need to hold if the longer-term trend is to remain intact or begin to reverse. Resistance is more distant, starting at $4,698.91, then $4,745.69, and $4,773.03. The battle between these daily support and resistance levels will likely dictate the market's sentiment in the coming week. The current price action below the middle Bollinger Band on the daily chart suggests that the path of least resistance is still downwards, but the oversold indicators on shorter timeframes warrant caution.
Trade Scenarios and Probability Assessment
Given the conflicting signals between the strong bearish trend on shorter timeframes and the oversold conditions coupled with potential daily divergences, a probabilistic approach is essential. The market is clearly in a state of tension, with bears having the upper hand in the immediate term, but with technical conditions ripe for a potential bounce.
Bearish Scenario: Trend Continuation
70% ProbabilityNeutral Scenario: Consolidation and Re-evaluation
20% ProbabilityBullish Scenario: Oversold Bounce
10% ProbabilityEconomic Calendar and Geopolitical Context
The economic calendar this week is dominated by the release of the April FOMC minutes, a critical event that could provide much-needed clarity on the Federal Reserve's monetary policy path. Traders are on edge, seeking any hint of a potential rate cut or hike, especially as inflation data remains stubbornly elevated. Recent news indicates that traders are anticipating a hawkish shift under the new Fed Chair, Kevin Warsh, which has already contributed to a strengthening US Dollar (DXY). The DXY is currently trading around 99.03, a level that typically puts pressure on gold. If the FOMC minutes confirm a hawkish bias, the dollar could extend its gains, further weighing on XAUUSD.
The persistent surge in oil prices, with Brent crude trading near $111.85 and WTI at $105.22, adds another layer of complexity. Traditionally, rising oil prices signal increasing inflationary pressures, which should theoretically benefit gold as an inflation hedge. However, as noted in recent PriceONN market news, gold has shown a muted reaction, even dipping below $4,620 despite oil prices soaring past $106. This suggests that the market is currently prioritizing Fed policy expectations over inflation concerns, or perhaps anticipating that central banks will act decisively to curb inflation, even if it means further tightening. This disconnect between oil prices and gold's typical safe-haven appeal highlights the dominant influence of monetary policy expectations.
Geopolitical tensions, particularly in the Middle East, continue to provide a background level of support for gold as a safe-haven asset. However, the market's immediate focus seems to be elsewhere. The ongoing US-China summit and the Iran stalemate, while significant, have not translated into sustained buying pressure for gold recently. Instead, any 'risk-off' sentiment appears to be channeled more towards the US Dollar, as evidenced by the DXY's strength. This suggests that for gold to reclaim its safe-haven status effectively, either geopolitical risks need to escalate dramatically, or the Fed's stance needs to soften considerably.
The Bottom Line: A Waiting Game for Gold
Gold is currently navigating a treacherous landscape. The technical picture on shorter timeframes screams 'sell', with strong downtrends and bearish momentum. However, extreme oversold conditions on the 1-hour and 4-hour charts, coupled with potential divergences on the daily timeframe, suggest that a bounce is technically plausible. The key will be how the market digests the upcoming FOMC minutes and whether the persistent strength in the US Dollar continues to dominate price action. The surge in oil prices, while a bullish fundamental factor for gold in normal times, is currently being overshadowed by monetary policy expectations.
Traders should remain vigilant. A break below $4,533.84 could accelerate the downside, targeting $4,514.02 and potentially $4,477.86. Conversely, if the bulls can defend the $4,536.85 level and a more dovish tone emerges from the Fed, a recovery towards $4,564.62 and $4,577.45 could be on the cards. The current environment is one of high uncertainty, demanding disciplined risk management and patience. Waiting for clear confirmation signals, whether a confirmed breakdown or a sustained bounce above key resistance, will be crucial for navigating this volatile period.
Frequently Asked Questions: XAUUSD Analysis
What happens if XAUUSD breaks below $4,533.84 support?
A break below $4,533.84 on the 4-hour chart would invalidate the current oversold bounce potential and likely trigger further selling. The next significant support level to watch would be $4,514.02, with a more substantial floor expected around $4,477.86.
Should I buy XAUUSD at current levels of $4,538.03 given the oversold RSI?
Buying at current levels carries significant risk due to the strong bearish trend indicated by the ADX at 45.94. While the RSI at 25.75 suggests oversold conditions, a confirmed hold above $4,536.85 and a bullish signal from the daily MACD would be needed for a higher-probability bullish setup.
Is the RSI at 25.75 a buy signal for XAUUSD right now?
An RSI reading of 25.75 is indeed in oversold territory, historically suggesting a potential for a short-term bounce. However, in a strong downtrend with an ADX of 45.94, it's not a standalone buy signal. Confirmation from price action and other indicators, like a bullish MACD crossover or holding key support, is crucial.
How will the FOMC minutes affect XAUUSD this week?
The FOMC minutes are highly anticipated and could dictate XAUUSD's direction. A hawkish tone might strengthen the USD and push gold lower towards $4,514.02, while a dovish interpretation could support gold, potentially leading it back towards $4,577.45.
Track markets in real-time
AI-powered analysis, technical indicators and real-time price data.
Join Our Telegram Channel
Breaking market news, AI analysis and trading signals instantly.
Join Channel