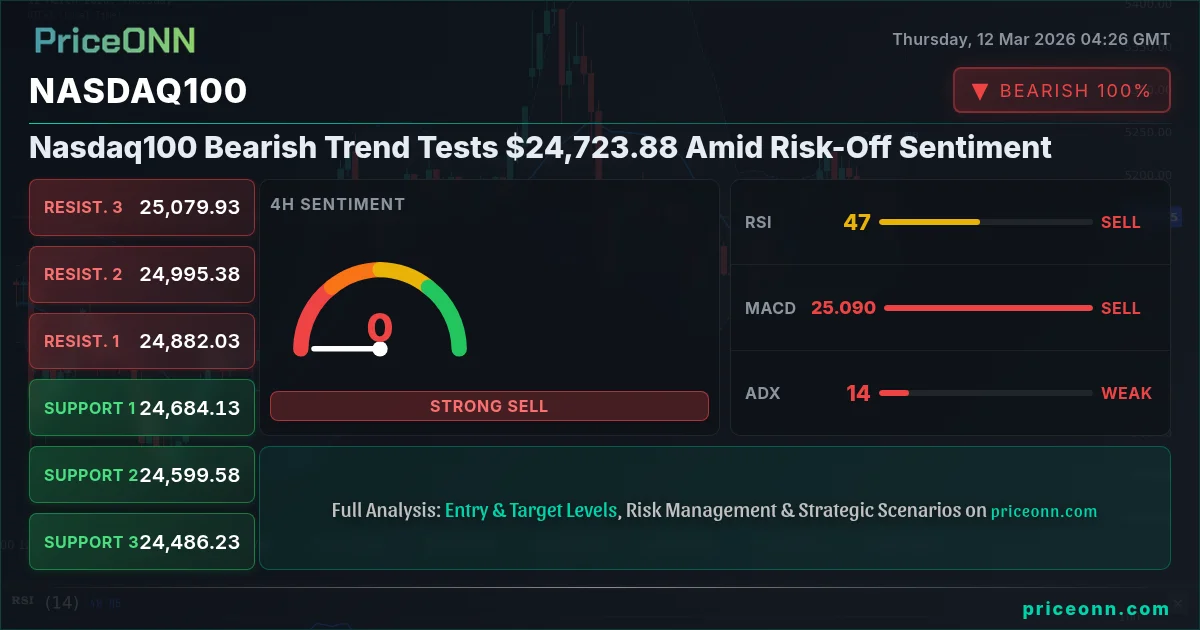
Nasdaq100 is currently grappling with a bearish trend, finding itself testing the $24,723.88 level. This move comes amid a backdrop of escalating geopolitical tensions and a strengthening dollar, creating a risk-off sentiment that is weighing on equities.
- RSI at 36.4 on the 1H chart signals potential oversold conditions, but further downside pressure may persist.
- Critical support lies at 24,670.15, a break below which could trigger further declines.
- MACD histogram indicates negative momentum, suggesting bearish sentiment is still in control.
- DXY strength is negatively correlated with Nasdaq100, adding to downside pressure.
The Nasdaq100's performance is being influenced by several factors. The dollar index (DXY) is currently trading at 99.23, experiencing a 0.34% increase. This rise in the dollar index generally puts pressure on equities and other risk assets, including the Nasdaq100. The inverse correlation between the DXY and Nasdaq100 is worth noting, as a stronger dollar makes U.S. equities relatively more expensive for foreign investors.
Adding to the bearish sentiment, geopolitical tensions in the Middle East are escalating, as highlighted by recent news indicating a surge in oil prices above $90 a barrel. This has triggered concerns about potential inflationary pressures and their impact on global economic stability. The increased uncertainty surrounding the Middle East is driving investors towards safer assets, further weighing on riskier assets such as the Nasdaq100.
From a technical perspective, the Nasdaq100 faces significant challenges. On the 1-hour timeframe, the trend is bearish with 78% strength. Key support levels to watch are 24,670.15, 24,631.65, and 24,579.37. A break below 24,670.15 could lead to further downside, potentially targeting the next support level at 24,631.65. Resistance levels are positioned at 24,760.93, 24,813.21, and 24,851.71. The RSI(14) on the 1H chart stands at 36.4, indicating that the index is approaching oversold conditions. However, this does not necessarily mean an immediate reversal is imminent, as the index could remain oversold for an extended period during a strong downtrend.
The MACD on the 1-hour chart shows negative momentum, with the MACD line below the signal line. This indicates that the bearish trend is still intact. The Stochastic oscillator, with K=14.25 and D=15.89, is in oversold territory, signaling a potential for a short-term bounce. However, the overall trend suggests that any such bounce is likely to be limited.
On the 4-hour timeframe, the situation is somewhat mixed. While the trend is neutral, the RSI(14) is at 46.36, indicating that there is still room for further downside before the index reaches oversold conditions. The MACD also indicates negative momentum, supporting the bearish outlook. The Stochastic oscillator is in oversold territory, with K=15.49 and D=46.4, suggesting a potential for a bounce. However, the ADX is at 14.78, indicating a weak trend, which implies that the index may remain range-bound in the near term.
Looking at the daily timeframe, the trend is bearish with 90% strength. Key support levels to watch are 24,797.04, 24,672.1, and 24,493.88. Resistance levels are positioned at 25,100.2, 25,278.42, and 25,403.36. The RSI(14) is at 45.24, indicating that there is still room for further downside. The MACD also indicates negative momentum, supporting the bearish outlook. The Stochastic oscillator is in overbought territory, with K=70.21 and D=58.86, suggesting a potential for a pullback. The ADX is at 29.02, indicating a strong trend, which supports the bearish bias.
The combination of factors - a stronger dollar, geopolitical tensions, and negative technical indicators - is creating a challenging environment for the Nasdaq100. Investors should exercise caution and closely monitor key support levels. A break below 24,670.15 on the 1-hour chart could trigger further declines, while a break below 24,797.04 on the daily chart would confirm the bearish trend. Conversely, a sustained move above 24,760.93 on the 1-hour chart or 25,100.2 on the daily chart would suggest that the bearish pressure is easing.
Adding to the complexities, crude oil prices are eyeing $90 as Iran tensions threaten Eurozone stability. This highlights the interconnectedness of global markets and the potential for geopolitical events to impact equity prices. If the tensions in the Middle East continue to escalate, it could lead to further risk aversion and negatively impact the Nasdaq100.
The upcoming economic data releases will also play a crucial role in shaping the near-term outlook for the Nasdaq100. Investors will be closely watching the GBP data on Friday. Any surprises in these data releases could trigger significant market volatility and impact the Nasdaq100's performance.
Given the current market conditions, it's essential to consider the overall market sentiment. Market sentiment can often act as a self-fulfilling prophecy, driving prices in a particular direction. It's important to be aware of prevailing sentiment and to avoid getting caught on the wrong side of the market.
For swing traders, it's crucial to identify entry and exit points based on technical indicators and chart patterns. Look for confirmation signals before entering a trade, such as a break above a key resistance level or a break below a key support level. Always use stop-loss orders to limit potential losses.
Frequently Asked Questions: Nasdaq100 Analysis
What happens if Nasdaq100 breaks below $24,670.15 support?
If Nasdaq100 breaches the $24,670.15 support level, it could trigger a further decline towards the next support at $24,631.65 on the 1-hour chart. This breakdown would reinforce the bearish trend and potentially lead to increased selling pressure.
Should I buy Nasdaq100 at current levels of $24,723.88 given the RSI at 36.4?
While the RSI at 36.4 suggests the Nasdaq100 is approaching oversold conditions on the 1H timeframe, buying at current levels carries risk. The overall trend remains bearish, so waiting for confirmation of a reversal before entering a long position is advisable.
Is the negative MACD signal on the 1H chart a reliable indicator of further downside?
The negative MACD signal on the 1H chart, with the MACD line below the signal line, corroborates the bearish trend. While not a standalone signal, it strengthens the case for continued downside pressure, especially if coupled with breaks below key support levels.
How will the upcoming GBP data on Friday affect Nasdaq100?
The upcoming GBP data releases on Friday could indirectly influence the Nasdaq100 through broader market sentiment and risk appetite. Positive data could boost global market confidence, providing some support, while negative data might exacerbate risk aversion and weigh on the index.
Volatility creates opportunity-those prepared will be rewarded.
Track markets in real-time
AI-powered analysis, technical indicators and real-time price data.
Join Our Telegram Channel
Breaking market news, AI analysis and trading signals instantly.
Join Channel